
I went looking for a shoe size by country table I could trust, and found two very different kinds of source. The sizing systems themselves are well documented in standards. The “average shoe size by country” tables mostly aren’t. So this page keeps the two jobs apart. It maps which countries use which system, shows the arithmetic that links them, and then takes the foot measurements that do exist for a handful of countries and turns them into shoe sizes, with the working shown and the data free to download.
Six headline shoe size numbers. Select one to see what it counts and where it comes from.
Select a topic above, for example “Japan”, to see what the number counts.
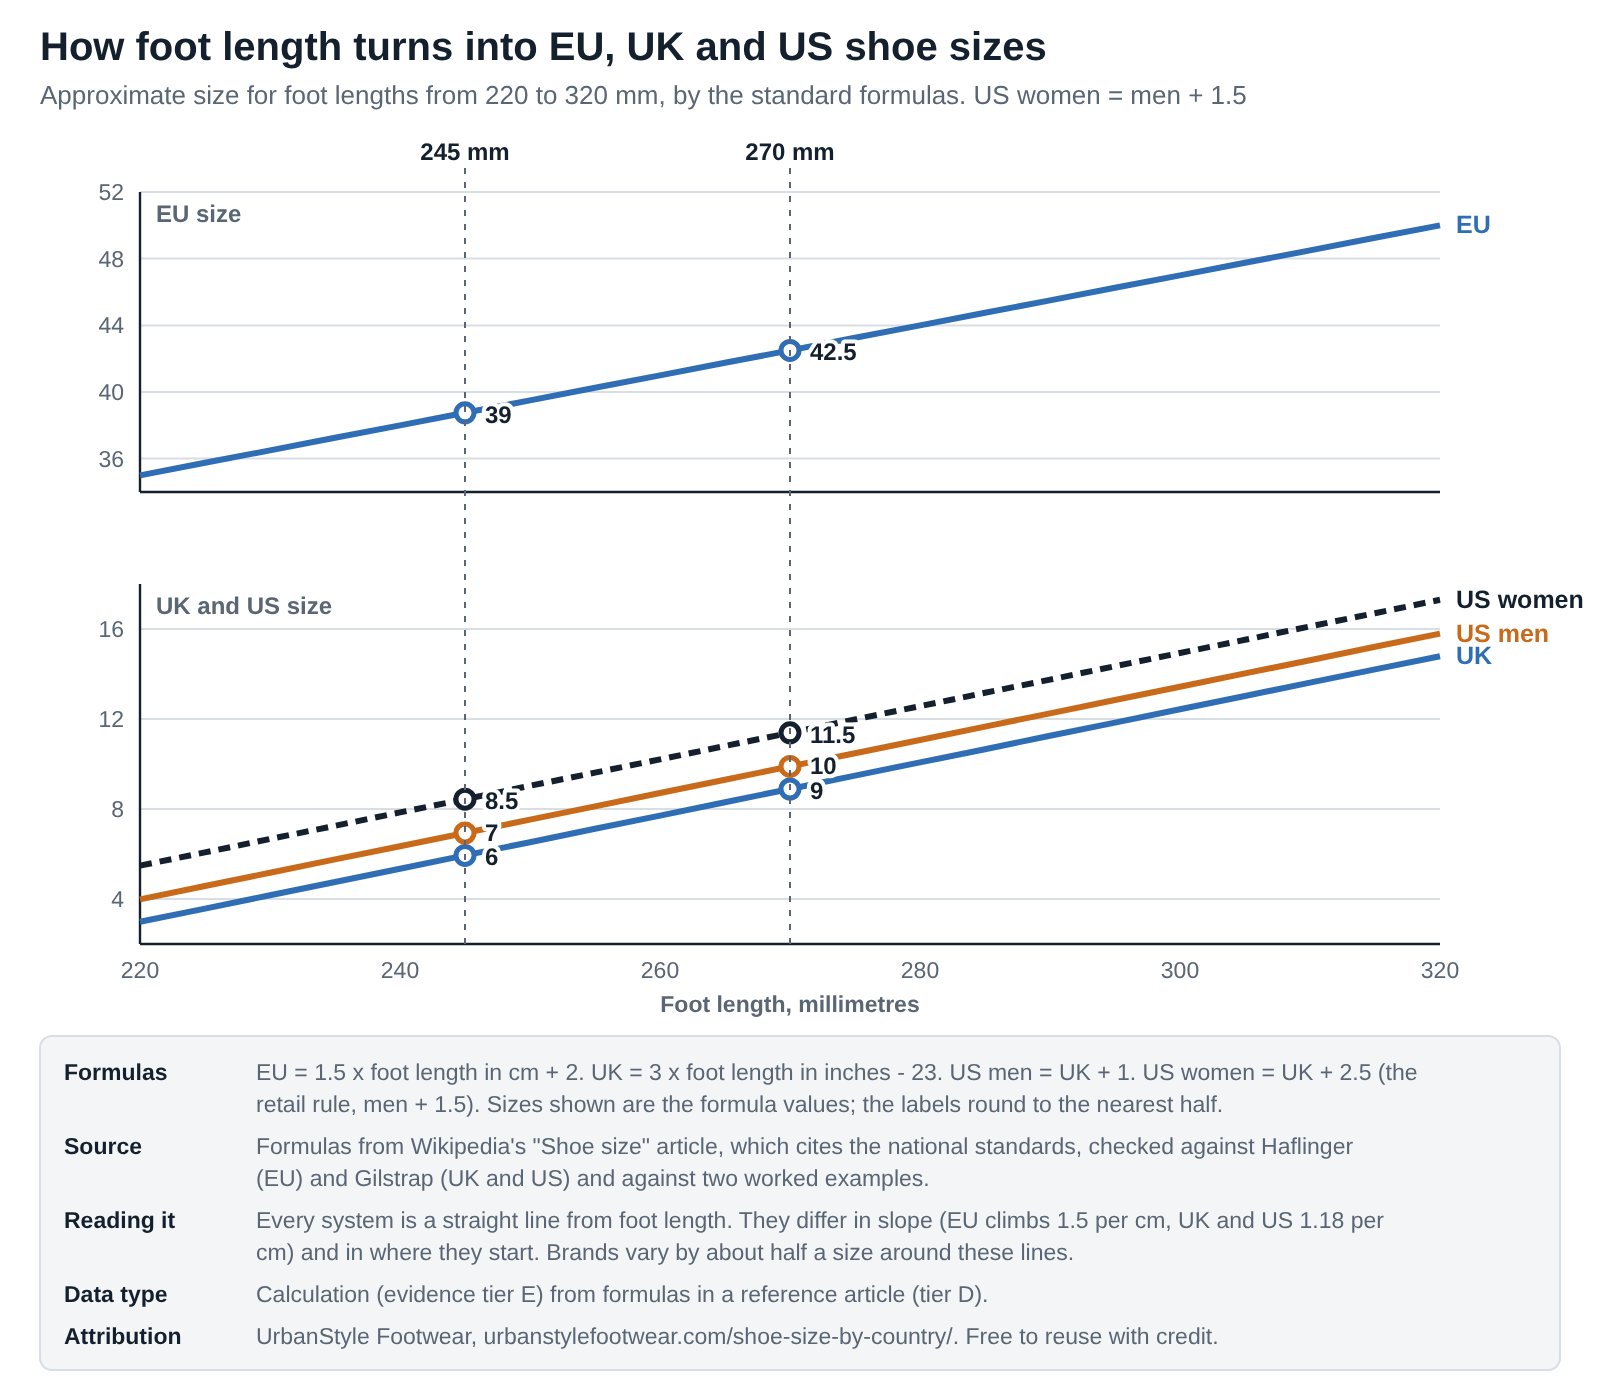
270 mmA 270 mm foot is about EU 42.5, UK 9 and US men's 10 (my calculation, tier E). Same foot, three numbers. In Japan, China and Korea the label is just the foot length: 270.
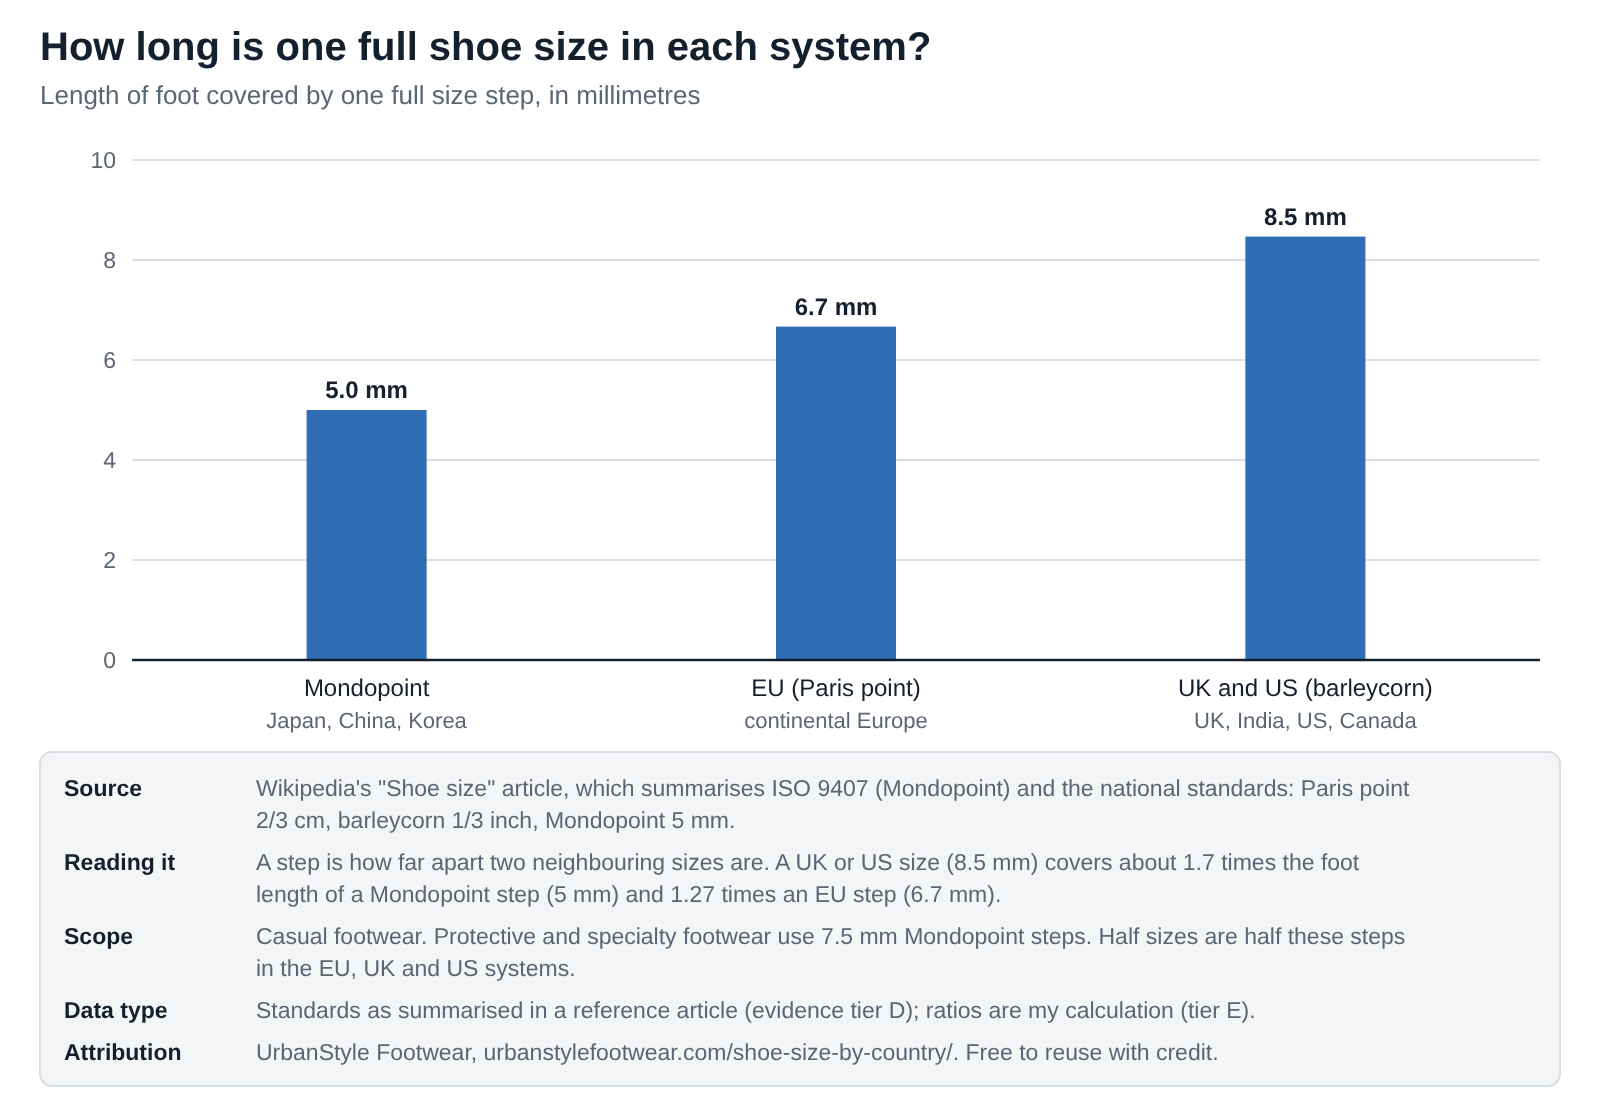
5 / 6.7 / 8.5 mmOne full size is 5 mm in Mondopoint, 6.7 mm in EU sizes and 8.5 mm in UK and US sizes (tier D). So "two sizes bigger" is not the same distance in every system.
254.5 / 233 mmA Japanese report of 937,718 people measured with ZOZOMAT in 2020 gives a mean foot length of about 254.5 mm for men and 233 mm for women (tier C). That is roughly EU 40 and EU 37.
1.9 sizesThe US Army median man's foot (271 mm) is about 16 mm longer than the Japanese mean (254.5 mm). That is about two UK or US sizes (tier E). Different groups, so an indication only.
+1 or +1.5Retailers such as Road Runner Sports say a women's US size is 1.5 above the men's size for the same foot (tier C). The standard scale puts it 1 above (tier D). Both are in use.
NoneNo statistics office I checked publishes an average shoe size by country. What exists are measured foot lengths for a handful of countries, which can be converted into sizes (tier E).
Each number names its source and evidence tier. All fifteen of my citable statistics are further down this page.
Shoe sizes by country at a glance
Quick answer. Countries use six families of shoe sizing: UK sizes, US sizes, EU sizes (Paris points), Mondopoint (foot length, used in Japan, China, Korea and Taiwan), the Australian and New Zealand mix, and Mexico’s foot-length scale. They all start from the foot, so the clean way to compare them is foot length in millimetres: a 270 mm foot is about EU 42.5, UK 9 and US men’s 10. There is no official average shoe size by country. The foot measurements that exist put the average man’s foot at about EU 40 (UK 7, US 8) in Japan and about EU 42.5 to 43 (UK 9 to 9.5, US 10 to 10.5) in Iran, the US Army survey and Australia. I treat every conversion as good to about half a size.
This is the numbers page for shoe sizes across countries. For the conversion tool itself, use my shoe size conversion calculator. For the foot measurements underneath, see my foot size statistics, and for sales, returns and fit data see the footwear statistics hub.
Key findings
- The 23 countries in my directory fall into six groups: five on UK sizes, two on US sizes, two on the Australian and New Zealand mix, eight on EU (Paris point) sizes, five on Mondopoint and Mexico on its own. It is a sample of named countries, not a full list.
- ISO publishes both ends of this. ISO 9407:2019 defines Mondopoint, and ISO’s own record says it was confirmed in June 2026. ISO 19407:2023 gives conversion tables for seven systems based on foot length, and it calls them a guideline.
- A “size” is not one distance. One full size covers 5 mm in Mondopoint, about 6.7 mm in EU sizes and about 8.5 mm in UK and US sizes, so two sizes is about 10, 13 or 17 mm depending on the system.
- Foot length converts into each system with simple formulas. Mine reproduce the two worked examples in the source article exactly, and two other formula sources land within 0.25 of an EU size and 0.5 of a UK size. So I treat conversions as good to about half a size.
- A 270 mm foot is about EU 42.5, UK 9 and US men’s 10. A 245 mm foot is about EU 39, UK 6, US men’s 7 and US women’s 8 to 8.5 (my calculations).
- The US women’s size is 1 above the men’s size on the standard scale and 1.5 above by the rule retailers quote. Both are in use, and the difference is half a size.
- No statistics office I checked publishes an average shoe size by country. The best single-country data I found is Japan’s: 937,718 people measured in 2020, with mean foot lengths of about 254.5 mm for men and 233 mm for women, which is roughly EU 40 and EU 37.
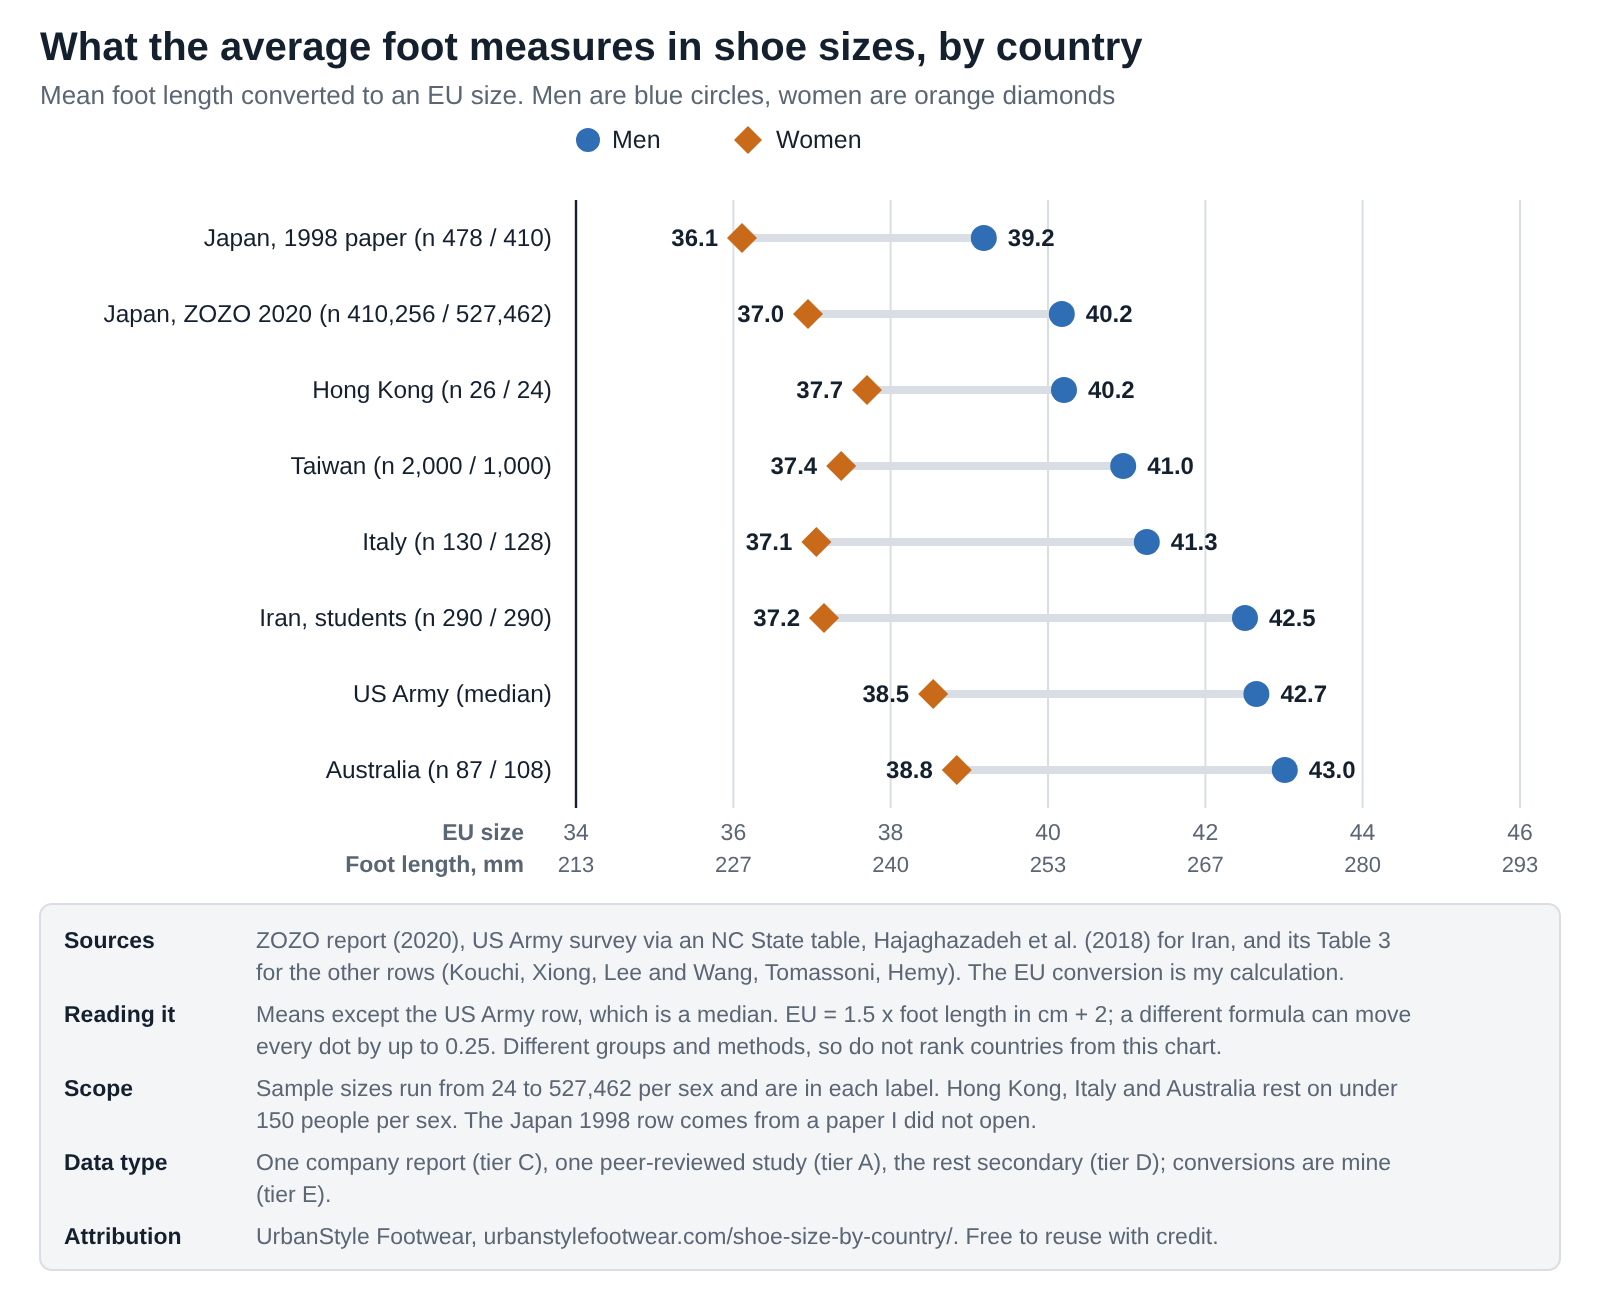
- Across eight measured groups, men’s mean foot length converts to about EU 39 to 43 and women’s to about EU 36 to 39. The groups differ in who was measured and how, so I show the spread and do not rank countries.
- The US Army survey’s median man’s foot (271 mm) is about 16.5 mm longer than Japan’s ZOZO mean (254.5 mm), about two UK or US sizes. In 1.2 million foot scans the gap between North America and Asia was 15 mm. Different groups, so these are indications.
- Of three popular “average shoe size by country” pages I read, none tied its country figures to a named measurement survey, and one table lists Chinese women at UK 3.5 and US 3.5, which the scales do not allow.
What I noticed while putting this together
I expected to find a table of average shoe size by country that I could cite. I didn’t. Searching the phrase mostly returns the same handful of numbers repeated, and the sources the tables name are usually Wikipedia and a conversion chart. That is why this page is split in two.
The sizing side was easier than I expected. ISO has public records for both standards, and the formulas in the Wikipedia article reproduce its worked examples to the nearest size. I then checked them against two other formula sources, a footwear brand’s blog page and an independent PDF, and they agree to within a quarter of an EU size and about half a UK size at worst. That is where “good to about half a size” comes from.
The thing that surprised me most is how different the steps are. I had always thought of a size as one thing. It’s 5 mm in Mondopoint, 6.7 mm in EU sizes and 8.5 mm in UK and US sizes, so “go up two sizes” means a different length depending on where the shoe is from.
The averages side was harder. One popular table I read lists Chinese women as UK 3.5 and US 3.5. Those can’t both be right, because for the same foot a US women’s size runs 2 to 2.5 above the UK size. I only looked at that one row closely, but it told me how much weight to give the rest of that table.
The best country data I could find was Japan’s. ZOZO, the online fashion company, published a report on 937,718 people it measured with its ZOZOMAT. I read the original report in Japanese, and a news report gave the same national average. It is a 2020 company report on online shoppers, so I mark it tier C, but it is far bigger than anything else I found for a single country.
Everything else is thinner. Six other countries’ feet come to me through a table in one Iranian paper, and I could not open the original studies. I kept those rows and marked them tier D. I dropped three other rows from that table (Malaysian, Chinese and Indian samples from one study in a forensic science journal) because their men’s figures sit more than 20 mm below every other Asian men’s figure I have, and I couldn’t check why.
What we know about shoe sizes by country and what we don’t
Here’s where the public evidence stands as of October 2026. Official statistics bodies don’t publish average shoe size, so the figures rest on standards, research and company reports.
| Question | Evidence status | Why |
|---|---|---|
| Which system a country uses | Well documented | National and ISO standards, summarised by Wikipedia. I read ISO’s public records, not the paid standards |
| Converting between systems | Good to about half a size | Three formula sources agree closely. ISO calls its own tables a guideline |
| Official average shoe size by country | None found | No statistics office I checked publishes it |
| Measured foot length, Japan | Good estimate | 937,718 people in 2020, but online shoppers, and a company report |
| Measured foot length, the US, Iran, Taiwan, Italy, Hong Kong, Australia | Estimate | Soldiers, students and small samples, mostly read second-hand |
| Measured foot length for most other countries | No verified figure | Nothing usable in my searches for India, Brazil, Mexico, most of Africa or Latin America |
| Women’s size against men’s size | Two conventions | Plus 1 on the standard scale, plus 1.5 by the retail rule |
| Brazil and Mexico numeric conversions | Not tabulated | I couldn’t confirm either offset from a second source |
15 shoe size by country statistics you can cite
Each card has one number, one sentence of context and its source. “Copy text” opens a box with the sentence, the source and a link back here. Please cite the original source for any single statistic. Cards marked E are my own calculations, and the method is on the card or in the dataset.
A full size step is 5 mm in Mondopoint (Japan, China, Korea), about 6.7 mm in EU sizes and about 8.5 mm in UK and US sizes, so the same "one size" covers different lengths (Wikipedia's summary of the standards).
Copy text
5 / 6.7 / 8.5 mm length of one full shoe size: A full size step is 5 mm in Mondopoint (Japan, China, Korea), about 6.7 mm in EU sizes and about 8.5 mm in UK and US sizes, so the same "one size" covers different lengths (Wikipedia's summary of the standards). Source: Wikipedia, Shoe size. Via UrbanStyle Footwear: https://urbanstylefootwear.com/shoe-size-by-country/
Mondopoint designates footwear size from defined measurements of the foot. ISO lists ISO 9407:2019 as edition 2, published in July 2019 and confirmed on June 30, 2026.
Copy text
ISO 9407:2019 the Mondopoint standard: Mondopoint designates footwear size from defined measurements of the foot. ISO lists ISO 9407:2019 as edition 2, published in July 2019 and confirmed on June 30, 2026. Source: ISO 9407:2019 (ISO 9407:2019). Via UrbanStyle Footwear: https://urbanstylefootwear.com/shoe-size-by-country/
ISO 19407:2023 gives three conversion tables for Mondopoint, European, UK, Chinese, Japanese, Korean and US sizes, based on foot length, and calls them a guideline. It follows ISO/TS 19407:2015, withdrawn in June 2023.
Copy text
ISO 19407:2023 the conversion standard: ISO 19407:2023 gives three conversion tables for Mondopoint, European, UK, Chinese, Japanese, Korean and US sizes, based on foot length, and calls them a guideline. It follows ISO/TS 19407:2015, withdrawn in June 2023. Source: ISO 19407:2023 (ISO 19407:2023). Via UrbanStyle Footwear: https://urbanstylefootwear.com/shoe-size-by-country/
I list 23 countries by sizing system: 8 on EU sizes, 5 on UK sizes, 5 on Mondopoint, 2 on US sizes, 2 on the Australian and New Zealand mix and Mexico on its own (UrbanStyle count from Wikipedia).
Copy text
23 countries in my directory, 6 groups: I list 23 countries by sizing system: 8 on EU sizes, 5 on UK sizes, 5 on Mondopoint, 2 on US sizes, 2 on the Australian and New Zealand mix and Mexico on its own (UrbanStyle count from Wikipedia). Source: UrbanStyle calculation. Via UrbanStyle Footwear: https://urbanstylefootwear.com/shoe-size-by-country/
By the standard formulas, a 270 mm foot is about EU 42.5, UK 9 and US men's 10, and a size 270 in Japan, China or Korea (UrbanStyle calculation). Brand charts can differ by half a size.
Copy text
270 mm is EU 42.5, UK 9, US 10: By the standard formulas, a 270 mm foot is about EU 42.5, UK 9 and US men's 10, and a size 270 in Japan, China or Korea (UrbanStyle calculation). Brand charts can differ by half a size. Source: UrbanStyle calculation. Via UrbanStyle Footwear: https://urbanstylefootwear.com/shoe-size-by-country/
A 245 mm foot is about EU 39, UK 6 and US women's 8 on the standard scale or 8.5 by the retail rule of men's size plus 1.5 (UrbanStyle calculation).
Copy text
245 mm is EU 39, UK 6, US women's 8 to 8.5: A 245 mm foot is about EU 39, UK 6 and US women's 8 on the standard scale or 8.5 by the retail rule of men's size plus 1.5 (UrbanStyle calculation). Source: UrbanStyle calculation. Via UrbanStyle Footwear: https://urbanstylefootwear.com/shoe-size-by-country/
Road Runner Sports says US women's sizes run about 1.5 larger than men's for the same foot, so a women's 8.5 is a men's 7. The standard women's scale in the formulas is 1 above men's, so the two conventions differ by half a size.
Copy text
+1.5 the retail men's-to-women's rule: Road Runner Sports says US women's sizes run about 1.5 larger than men's for the same foot, so a women's 8.5 is a men's 7. The standard women's scale in the formulas is 1 above men's, so the two conventions differ by half a size. Source: Road Runner Sports, 2026. Via UrbanStyle Footwear: https://urbanstylefootwear.com/shoe-size-by-country/
A ZOZO report from June 2020 describes 937,718 people aged 16 and over (410,256 men and 527,462 women) measured with its ZOZOMAT between February 27 and May 31, 2020. It is the largest single-country sample I found.
Copy text
937,718 people measured in Japan: A ZOZO report from June 2020 describes 937,718 people aged 16 and over (410,256 men and 527,462 women) measured with its ZOZOMAT between February 27 and May 31, 2020. It is the largest single-country sample I found. Source: ZOZO report, 2020. Via UrbanStyle Footwear: https://urbanstylefootwear.com/shoe-size-by-country/
In the same ZOZO report, men averaged 25.5 cm (left) and 25.4 cm (right) and women 23.3 cm. That is roughly EU 40 and 37, or UK 7 and 4.5 (my calculation).
Copy text
254.5 / 233 mm mean foot length in Japan: In the same ZOZO report, men averaged 25.5 cm (left) and 25.4 cm (right) and women 23.3 cm. That is roughly EU 40 and 37, or UK 7 and 4.5 (my calculation). Source: ZOZO report, 2020. Via UrbanStyle Footwear: https://urbanstylefootwear.com/shoe-size-by-country/
The US Army median man's foot (271 mm) is about 16.5 mm longer than the Japanese ZOZO mean (254.5 mm), roughly 1.9 UK or US sizes. Different groups and years, so it is an indication (UrbanStyle calculation).
Copy text
about 2 sizes US Army median against Japanese mean, men: The US Army median man's foot (271 mm) is about 16.5 mm longer than the Japanese ZOZO mean (254.5 mm), roughly 1.9 UK or US sizes. Different groups and years, so it is an indication (UrbanStyle calculation). Source: UrbanStyle calculation. Via UrbanStyle Footwear: https://urbanstylefootwear.com/shoe-size-by-country/
In 1.2 million foot scans, the most common men's length was 270 mm in North America and 255 mm in Asia, a gap of 15 mm or about 1.8 UK or US sizes (Jurca et al., 2019; the conversion is my calculation).
Copy text
15 mm North America against Asia, men: In 1.2 million foot scans, the most common men's length was 270 mm in North America and 255 mm in Asia, a gap of 15 mm or about 1.8 UK or US sizes (Jurca et al., 2019; the conversion is my calculation). Source: UrbanStyle calculation. Via UrbanStyle Footwear: https://urbanstylefootwear.com/shoe-size-by-country/
A 2022 systematic review of 17 studies and 15,235 participants concluded that foot shape differs among ethnicities and between the sexes. The abstract is all I read.
Copy text
17 studies on foot shape by ethnicity and sex: A 2022 systematic review of 17 studies and 15,235 participants concluded that foot shape differs among ethnicities and between the sexes. The abstract is all I read. Source: Footwear Science review, 2022 (Footwear Science 15(1)). Via UrbanStyle Footwear: https://urbanstylefootwear.com/shoe-size-by-country/
I read three popular "average shoe size by country" pages in October 2026. None tied its country averages to a named measurement survey.
Copy text
0 of 3 popular country tables name a survey: I read three popular "average shoe size by country" pages in October 2026. None tied its country averages to a named measurement survey. Source: World Population Review table. Via UrbanStyle Footwear: https://urbanstylefootwear.com/shoe-size-by-country/
One country table lists Chinese women at EU 36, UK 3.5 and US 3.5. US women's sizes run 2 to 2.5 above UK sizes for the same foot, so those numbers cannot both be right (my calculation).
Copy text
UK 3.5 = US 3.5 in one popular table: One country table lists Chinese women at EU 36, UK 3.5 and US 3.5. US women's sizes run 2 to 2.5 above UK sizes for the same foot, so those numbers cannot both be right (my calculation). Source: World Population Review table. Via UrbanStyle Footwear: https://urbanstylefootwear.com/shoe-size-by-country/
Two other formula sources agree with the standard formulas to within 0.25 EU sizes and 0.48 UK sizes across 220 to 320 mm, so I treat conversions from foot length as good to about half a size (UrbanStyle calculation).
Copy text
0.5 size accuracy of foot-to-size formulas: Two other formula sources agree with the standard formulas to within 0.25 EU sizes and 0.48 UK sizes across 220 to 320 mm, so I treat conversions from foot length as good to about half a size (UrbanStyle calculation). Source: UrbanStyle calculation. Via UrbanStyle Footwear: https://urbanstylefootwear.com/shoe-size-by-country/
How many shoe sizing systems are there?
Short answer. Four measuring bases cover most of the world: Mondopoint (foot length in mm), the Paris point behind EU sizes, and two barleycorn scales (UK and US) that count in thirds of an inch. A few places add their own twist, such as the Australian women’s scale, Mexico and Brazil.
I wanted one picture of how they relate, so I started with the step each system takes between one size and the next. The chart shows it.
Embed this chart
<figure style="margin:0"><a href="https://urbanstylefootwear.com/shoe-size-by-country/"><img src="https://urbanstylefootwear.com/wp-content/uploads/2026/10/usf-length-of-one-shoe-size-by-system.png" alt="Bar chart of foot length covered by one full shoe size: 5 mm Mondopoint, 6.7 mm EU, 8.5 mm UK and US" width="800" style="max-width:100%;height:auto"></a><figcaption>Source: UrbanStyle Footwear, based on Wikipedia's summary of ISO 9407 and the national standards. <a href="https://urbanstylefootwear.com/shoe-size-by-country/">Shoe Size by Country 2026</a></figcaption></figure>Click the code, press Ctrl+C (Cmd+C on Mac), and paste it into any web page. Please keep the attribution link.
View as table
| System | Used in | Length of one full size, mm | Length of one half size, mm |
|---|---|---|---|
| Mondopoint | Japan, China, Korea | 5.0 | not used (5 mm is the finest step) |
| EU (Paris point) | Continental Europe | 6.67 | 3.33 |
| UK and US (barleycorn) | UK, India, US, Canada | 8.47 | 4.23 |
The three steps are 5 mm, about 6.7 mm and about 8.5 mm. That has a practical effect. Two sizes in the UK system is about 17 mm of foot, but two sizes in EU numbers is about 13 mm. When someone says “I’m between sizes”, the gap they are describing is not the same length everywhere.
| System | One full size | What the number means | Where it is used | Standard or source |
|---|---|---|---|---|
| Mondopoint | 5 mm (7.5 mm for protective footwear) | The foot length the shoe is meant to fit, with an optional width. A label of 280/110 means 280 mm long and 110 mm wide | Japan, China, Taiwan, South Korea, and later Russia | ISO 9407:2019; JIS S 5037:1998; GB/T 3293.1-1998; CNS 4800-S1093:2000; KS M 6681:2007 |
| Paris point (EU) | 2/3 cm, about 6.7 mm | The length of the last, in Paris points. For a foot, about 1.5 times the length in cm plus 2 | Continental Europe, Iran, Hong Kong, Brazil (with an offset) | National standards such as DIN 66074:1975 and UNE 59850:1998 |
| UK barleycorn | 1/3 inch, about 8.5 mm | Counts up from a smallest practical size. For a foot, about 3 times the length in inches minus 23 | UK, Ireland, India, Pakistan, South Africa; men and children in Australia and New Zealand | BS 4981:1973; IS 8751:1978 |
| US barleycorn | 1/3 inch, about 8.5 mm | Same step, different start. Men’s about 3 times the foot in inches minus 22, so one number above UK | United States, Canada | Wikipedia’s summary of US practice |
The easiest way to hold this in your head is that every system is a ruler for the same foot. Mondopoint prints the reading directly. EU, UK and US sizes are the same foot read off three differently marked rulers, which is why they are all straight lines against foot length, as the conversion chart below shows. The UK and US rulers have the same step and different starting points. That is the whole reason a US men’s 10 is about a UK 9.
What you can safely say. “Shoe sizes are all derived from foot length, but one size step is 5 mm in Mondopoint, about 6.7 mm in EU sizing and about 8.5 mm in UK and US sizing.” Name the source and say these are standards as summarised, not brand charts.
My read. If you only remember one thing, remember the step. It explains why EU sizes feel finer than UK ones and why “size up” means a different amount of room depending on where you shop.
Sources: Wikipedia’s “Shoe size” article (tier D), which cites ISO and the national standards listed; ISO 9407:2019 record (tier B). Step ratios are my calculations (tier E).Which countries use which shoe size system?
Short answer. The UK, Ireland, India, Pakistan and South Africa use UK sizes. The US and Canada use US sizes. Continental Europe, Iran and Hong Kong use EU sizes. Japan, China, Taiwan and South Korea use Mondopoint, which is foot length. Australia and New Zealand mix the UK and US scales, and Mexico sizes by foot length in cm.
This is the part that is well documented, and I took it from Wikipedia’s summary of the standards. Filter the directory below by system. It is a sample of 23 countries Wikipedia names, not every country.
| Country | Sizing system | National standard, where listed | Note |
|---|---|---|---|
| United Kingdom | UK sizes | BS 4981:1973 | Steps of one barleycorn (8.5 mm). |
| Ireland | UK sizes | n/a | |
| India | UK sizes | IS 8751:1978 | A new system called Bha, with eight sizes, was proposed. In the April 2024 report I read it was still a proposal. |
| Pakistan | UK sizes | n/a | |
| South Africa | UK sizes | n/a | |
| United States | US sizes | n/a | Men's sizes run about one number above UK sizes. The women's scale is set differently (see men and women below). |
| Canada | US sizes | n/a | Same scale as the United States. |
| Australia | UK scale for men and children, other for women | n/a | Wikipedia describes the UK scale for men and children and US sizing for women. Women's charts vary, so check the brand chart. |
| New Zealand | UK scale for men and children, other for women | n/a | As Australia. |
| Austria | EU sizes (Paris point) | n/a | |
| France | EU sizes (Paris point) | n/a | |
| Germany | EU sizes (Paris point) | DIN 66074:1975 | |
| Italy | EU sizes (Paris point) | n/a | |
| Spain | EU sizes (Paris point) | UNE 59850:1998 | |
| Iran | EU sizes (Paris point) | n/a | |
| Hong Kong | EU sizes (Paris point) | n/a | |
| Brazil | EU sizes (Paris point) | n/a | Paris-point method with 2 subtracted from the result. I did not tabulate it, because I could not confirm the offset from a second source. |
| Japan | Mondopoint (foot length) | JIS S 5037:1998 | Sized by foot length, usually in cm. |
| China (mainland) | Mondopoint (foot length) | GB/T 3293.1-1998 | Sized by foot length, usually in mm. |
| Taiwan | Mondopoint (foot length) | CNS 4800-S1093:2000 | |
| South Korea | Mondopoint (foot length) | KS M 6681:2007 | Sized by foot length in mm. |
| Russia | Mondopoint (foot length) | GOST 11373-88; GOST R 58149-2018 | Paris points in the Soviet era, Mondopoint later. |
| Mexico | Foot length in cm or a barleycorn variant | n/a | Sized by foot length in cm, or by a barleycorn variant with a different offset. I did not tabulate it. |
A few of these surprised me or are easy to get wrong.
- Australia and New Zealand. Men’s and children’s sizes follow the UK scale, so a men’s UK 8 is an Australian 8. The women’s scale is described as following US sizing, and women’s charts vary, so I don’t give a number for it. My US to Australian chart covers it in detail.
- India. India is on the UK-style scale. A new system called Bha, with eight sizes, was proposed, and in the April 2024 report I read it was still a proposal. See my Indian vs UK shoe size guide and the Indian vs US guide.
- Japan, China, Korea. The label is the foot length, so conversions are the easy ones: 27.0 in Japan is 270 in China and Korea. My US to Japan and China to US charts cover the US side.
- Mexico and Brazil. Mexico uses foot length in cm or a barleycorn variant, and Brazil uses the Paris point method with an offset. I did not tabulate either, because I couldn’t confirm the offsets from a second source. See my US to Mexico chart.
- Russia. Soviet-era Paris points, later Mondopoint under GOST standards. If a Russian label looks like a foot length, that is why.
How do shoe sizes compare across countries?
Short answer. Convert from foot length, not from one size to another. By the standard formulas, 270 mm is EU 42.5, UK 9 and US men’s 10, and 245 mm is EU 39, UK 6, US men’s 7 and US women’s 8 to 8.5. In Japan, China and Korea the size is the foot length itself: 27.0 or 270.
Here is the arithmetic I used. The formulas come from Wikipedia’s article, which cites the standards, and every number on this page that converts a foot length uses them.
- EU = 1.5 x foot length in cm + 2
- UK = 3 x foot length in inches – 23
- US men’s = UK + 1
- US women’s = UK + 2 on the standard scale, or men’s + 1.5 (UK + 2.5) by the retail rule
- Japan, China, Korea = the foot length (cm in Japan, mm in China and Korea)
Embed this chart
<figure style="margin:0"><a href="https://urbanstylefootwear.com/shoe-size-by-country/"><img src="https://urbanstylefootwear.com/wp-content/uploads/2026/10/usf-foot-length-to-eu-uk-us-shoe-size.png" alt="Lines of EU, UK and US shoe sizes rising with foot length from 220 to 320 mm, with 245 and 270 mm marked" width="800" style="max-width:100%;height:auto"></a><figcaption>Source: UrbanStyle Footwear, based on standard conversion formulas (UrbanStyle calculation). <a href="https://urbanstylefootwear.com/shoe-size-by-country/">Shoe Size by Country 2026</a></figcaption></figure>Click the code, press Ctrl+C (Cmd+C on Mac), and paste it into any web page. Please keep the attribution link.
View as table
| Foot length, mm | EU | UK | US men | US women (men + 1.5) |
|---|---|---|---|---|
| 220 | 35 | 3 | 4 | 5.5 |
| 225 | 36 | 3.5 | 4.5 | 6 |
| 230 | 36.5 | 4 | 5 | 6.5 |
| 235 | 37.5 | 5 | 6 | 7.5 |
| 240 | 38 | 5.5 | 6.5 | 8 |
| 245 | 39 | 6 | 7 | 8.5 |
| 250 | 39.5 | 6.5 | 7.5 | 9 |
| 255 | 40.5 | 7 | 8 | 9.5 |
| 260 | 41 | 7.5 | 8.5 | 10 |
| 265 | 42 | 8.5 | 9.5 | 11 |
| 270 | 42.5 | 9 | 10 | 11.5 |
| 275 | 43.5 | 9.5 | 10.5 | 12 |
| 280 | 44 | 10 | 11 | 12.5 |
| 285 | 45 | 10.5 | 11.5 | 13 |
| 290 | 45.5 | 11.5 | 12.5 | 14 |
| 295 | 46.5 | 12 | 13 | 14.5 |
| 300 | 47 | 12.5 | 13.5 | 15 |
| 305 | 48 | 13 | 14 | 15.5 |
| 310 | 48.5 | 13.5 | 14.5 | 16 |
| 315 | 49.5 | 14 | 15 | 16.5 |
| 320 | 50 | 15 | 16 | 17.5 |
I tested them before trusting them. Wikipedia gives two worked examples, a 280 mm foot and a 230 mm foot, and my formulas reproduce both to the nearest whole size in all four systems. A footwear brand’s blog page gives EU as (foot length in cm + 1.5) x 1.5, and an independent PDF gives the UK and US scales with slightly different allowances. Across every 5 mm from 220 to 320 mm, the largest gap against the brand formula was 0.25 of an EU size, and against the PDF it was 0.48 of a UK size. That is why I call them good to about half a size.
The table does the sums for every 5 mm. I rounded to the nearest half size. Wikipedia notes its own sample conversions round up to the larger size, so if your foot falls between two sizes, the larger one is the safe choice.
| Foot length, mm | Foot length, inches | Japan (cm) | China and Korea (mm) | EU | UK | US men | US women (men + 1.5) | US women (standard scale) |
|---|---|---|---|---|---|---|---|---|
| 220 | 8.66 | 22.0 | 220 | 35 | 3 | 4 | 5.5 | 5 |
| 225 | 8.86 | 22.5 | 225 | 36 | 3.5 | 4.5 | 6 | 5.5 |
| 230 | 9.06 | 23.0 | 230 | 36.5 | 4 | 5 | 6.5 | 6 |
| 235 | 9.25 | 23.5 | 235 | 37.5 | 5 | 6 | 7.5 | 7 |
| 240 | 9.45 | 24.0 | 240 | 38 | 5.5 | 6.5 | 8 | 7.5 |
| 245 | 9.65 | 24.5 | 245 | 39 | 6 | 7 | 8.5 | 8 |
| 250 | 9.84 | 25.0 | 250 | 39.5 | 6.5 | 7.5 | 9 | 8.5 |
| 255 | 10.04 | 25.5 | 255 | 40.5 | 7 | 8 | 9.5 | 9 |
| 260 | 10.24 | 26.0 | 260 | 41 | 7.5 | 8.5 | 10 | 9.5 |
| 265 | 10.43 | 26.5 | 265 | 42 | 8.5 | 9.5 | 11 | 10.5 |
| 270 | 10.63 | 27.0 | 270 | 42.5 | 9 | 10 | 11.5 | 11 |
| 275 | 10.83 | 27.5 | 275 | 43.5 | 9.5 | 10.5 | 12 | 11.5 |
| 280 | 11.02 | 28.0 | 280 | 44 | 10 | 11 | 12.5 | 12 |
| 285 | 11.22 | 28.5 | 285 | 45 | 10.5 | 11.5 | 13 | 12.5 |
| 290 | 11.42 | 29.0 | 290 | 45.5 | 11.5 | 12.5 | 14 | 13.5 |
| 295 | 11.61 | 29.5 | 295 | 46.5 | 12 | 13 | 14.5 | 14 |
| 300 | 11.81 | 30.0 | 300 | 47 | 12.5 | 13.5 | 15 | 14.5 |
| 305 | 12.01 | 30.5 | 305 | 48 | 13 | 14 | 15.5 | 15 |
| 310 | 12.20 | 31.0 | 310 | 48.5 | 13.5 | 14.5 | 16 | 15.5 |
| 315 | 12.40 | 31.5 | 315 | 49.5 | 14 | 15 | 16.5 | 16 |
| 320 | 12.60 | 32.0 | 320 | 50 | 15 | 16 | 17.5 | 17 |
What you can safely say. “By the standard formulas, a 270 mm foot is about EU 42.5, UK 9 and US men’s 10.” Say that it is an approximation from foot length, and that brand charts differ by up to about half a size.
My read. The table is a sanity check, not a size chart for any brand. Use it to see whether a size you’ve been quoted is in the right place, then trust the seller’s own chart. My men’s and women’s conversion charts go size by size, and the US vs UK vs EU guide explains the differences.
Sources: Wikipedia, “Shoe size” (tier D); Haflinger blog page and Gilstrap PDF as cross-checks (tier D); ISO 19407:2023 record (tier B). Every converted figure is my calculation (tier E).What is the average shoe size by country?
Short answer. There is no official average. The nearest thing is measured foot length, converted into sizes. The average man’s foot works out to about EU 40 (UK 7, US 8) in Japan, EU 41 in Taiwan and EU 42.5 to 43 in Iran, the US Army survey and Australia. The average woman’s is about EU 37 to 39.
This is the part where I could do the least, and I’d rather say so than fill the table with guesses. Pick a dataset to see who was measured and where it falls short.
See what each study measured and where it falls short
Choose a dataset to see who was measured, what it found and how I would read it.
Select a dataset above.
Japan (ZOZO). February to May 2020. 937,718 people aged 16 and over (410,256 men, 527,462 women) measured with ZOZOMAT, the company's measuring mat. Mean foot length was 25.5 cm (left) and 25.4 cm (right) for men and 23.3 cm for women. How to read it: The biggest measured sample I found for any single country, and a BCN+R news report gives the same national average (24.2 and 24.3 cm for the right and left foot, both sexes). But these are online shoppers who chose to be measured, the report is from 2020, and it is a company report (tier C). I could not read its width figures.
Seven earlier studies. Papers from 1994 to 2015. Table 3 of the Iran paper lists mean foot lengths for Japan, Taiwan, Hong Kong, Italy, Australia and North American men from earlier studies, with samples from 24 to 2,000 people per sex. How to read it: Secondary (tier D): I read the table, not the original studies. Three groups have fewer than 150 people per sex, one comes from a forensic journal, and the methods differ, so I would not rank countries by these rows.
Foot scans. November 2017 to August 2018. 1,200,847 barefoot 3D scans of customers at 712 stores: 1,105,508 in North America, 74,534 in Europe and 20,805 in Asia. The most common foot-length class was 270 mm for men and 245 mm for women in North America and Europe, and 255 mm and 235 mm in Asia. How to read it: Peer-reviewed (tier A) and large, but shoppers, not a random sample, with no ages and only about 2% from Asia. It reports a most common class, not a mean, and the lead author has a financial interest in the scanner maker.
US Army survey. 2010 to 2012, published 2014. Median foot length of 271 mm for men and 244 mm for women, from the 2012 Anthropometric Survey of US Army Personnel. How to read it: A government measurement survey, but I read it through an NC State summary table (tier D), it covers soldiers, and I converted it from inches.
Embed this chart
<figure style="margin:0"><a href="https://urbanstylefootwear.com/shoe-size-by-country/"><img src="https://urbanstylefootwear.com/wp-content/uploads/2026/10/usf-average-foot-in-shoe-sizes-by-country.png" alt="Dot plot of mean foot length as EU shoe size for men and women in Japan, Taiwan, Italy, Iran, US, Australia" width="800" style="max-width:100%;height:auto"></a><figcaption>Source: UrbanStyle Footwear, based on the ZOZO report (2020), a US Army survey table, Hajaghazadeh et al. (2018) and earlier studies listed in its Table 3. <a href="https://urbanstylefootwear.com/shoe-size-by-country/">Shoe Size by Country 2026</a></figcaption></figure>Click the code, press Ctrl+C (Cmd+C on Mac), and paste it into any web page. Please keep the attribution link.
View as table
| Group | Men, mm | Women, mm | Men, EU size | Women, EU size | Men n | Women n | Kind of average | Source |
|---|---|---|---|---|---|---|---|---|
| Japan, Kouchi 1998 | 247.9 | 227.4 | 39.2 | 36.1 | 478 | 410 | mean | Hajaghazadeh et al., Table 3 |
| Japan, ZOZOMAT 2020 | 254.5 | 233.0 | 40.2 | 37.0 | 410,256 | 527,462 | mean | ZOZO report, 2020 |
| Hong Kong, Xiong 2008 | 254.7 | 238.0 | 40.2 | 37.7 | 26 | 24 | mean | Hajaghazadeh et al., Table 3 |
| Taiwan, Lee and Wang 2015 | 259.7 | 235.8 | 41.0 | 37.4 | 2,000 | 1,000 | mean | Hajaghazadeh et al., Table 3 |
| Italy, Tomassoni 2014 | 261.7 | 233.7 | 41.3 | 37.1 | 130 | 128 | mean | Hajaghazadeh et al., Table 3 |
| Iran, Hajaghazadeh 2018 | 270.0 | 234.3 | 42.5 | 37.2 | 290 | 290 | mean | Hajaghazadeh et al., 2018 |
| United States, Army survey | 271.0 | 243.6 | 42.7 | 38.5 | n/a | n/a | median | US Army survey (via NC State table) |
| Australia, Hemy 2013 | 273.4 | 245.6 | 43.0 | 38.8 | 87 | 108 | mean | Hajaghazadeh et al., Table 3 |
The chart converts each group’s mean foot length into an EU size. Here are the same groups with UK and US sizes too, and the foot lengths behind them.
| Group | Men, mm | Women, mm | Men: EU, UK, US | Women: EU, UK, US (men + 1.5) | Average and sample | Tier |
|---|---|---|---|---|---|---|
| Japan, Kouchi 1998 | 247.9 | 227.4 | 39, 6.5, 7.5 | 36, 4, 6.5 | Mean; n 478 men, 410 women | D |
| Japan, ZOZOMAT 2020 | 254.5 | 233.0 | 40, 7, 8 | 37, 4.5, 7 | Mean; n 410,256 men, 527,462 women | C |
| Hong Kong, Xiong 2008 | 254.7 | 238.0 | 40, 7, 8 | 37.5, 5, 7.5 | Mean; n 26 men, 24 women | D |
| Taiwan, Lee and Wang 2015 | 259.7 | 235.8 | 41, 7.5, 8.5 | 37.5, 5, 7.5 | Mean; n 2,000 men, 1,000 women | D |
| Italy, Tomassoni 2014 | 261.7 | 233.7 | 41.5, 8, 9 | 37, 4.5, 7 | Mean; n 130 men, 128 women | D |
| Iran, Hajaghazadeh 2018 | 270.0 | 234.3 | 42.5, 9, 10 | 37, 4.5, 7 | Mean; n 290 men, 290 women | A |
| United States, Army survey | 271.0 | 243.6 | 42.5, 9, 10 | 38.5, 6, 8.5 | Median; n n/a men, n/a women | D |
| Australia, Hemy 2013 | 273.4 | 245.6 | 43, 9.5, 10.5 | 39, 6, 8.5 | Mean; n 87 men, 108 women | D |
A few things about these rows before you quote them.
- Japan. ZOZO measured 937,718 customers aged 16 and over between February 27 and May 31, 2020. Men averaged 25.5 cm (left foot) and 25.4 cm (right), women 23.3 cm. I averaged left and right for men. A 1998 paper in the same table gives 247.9 and 227.4 mm, about 6 mm shorter. Different people, different methods and 22 years apart, so I don’t read it as a trend.
- The US. The Army median is 271 mm for men and 244 mm for women, from soldiers. In 1.2 million foot scans, the most common length class in North America was 270 mm and 245 mm. Both point to about a US men’s 10 and a US women’s 8 to 8.5. Nobody publishes an official US average, and my average men’s shoe size and average women’s shoe size pages cover the sales side.
- Iran. 290 men and 290 women, all university students in Urmia. Peer-reviewed, but one city and a young group.
- Taiwan, Italy, Hong Kong, Australia. All via the Iran paper’s comparison table. Hong Kong (26 and 24 people), Italy (130 and 128) and Australia (87 and 108) are small samples, and the Australian one was published in a forensic medicine journal.
- India. A reported survey scanned 101,880 people, but the reports I read give no foot lengths. I cannot give an Indian average.
Put the two ends side by side and the gap is real. The median man’s foot in the US Army survey is about 16.5 mm longer than the Japanese ZOZO mean, which is about two UK or US sizes. In the 1.2 million foot scans, the most common men’s length was 270 mm in North America and 255 mm in Asia, a 15 mm gap or about 1.8 sizes. A 2022 systematic review of 17 studies and 15,235 participants also concluded that foot shape differs between ethnic groups and between the sexes. None of that makes a rule for any one person.
What you can safely say. “No official average shoe size by country exists. In a 2020 report on 937,718 people, the average Japanese man’s foot was about 254.5 mm, roughly EU 40, and the average woman’s about 233 mm, roughly EU 37.” Say that the sizes are my conversion from foot length.
My read. The spread across countries is smaller than the spread within any one of them. The middle 90% of men’s feet in the US Army survey spans about 43 mm, which is five UK sizes. That is why an average, by country or otherwise, should never pick your size. Your own measurement should. My foot size statistics page has the underlying numbers.
Sources: ZOZO report (tier C); Hajaghazadeh et al., Health Scope, 2018 (tier A) and its Table 3 (tier D); US Army survey via an NC State table (tier D); Jurca et al., Scientific Reports, 2019 (tier A); Footwear Science review, 2022 (tier A). Conversions are mine (tier E).How do men’s and women’s shoe sizes relate?
Short answer. For the same foot, the US women’s size is 1 above the men’s size on the standard scale and 1.5 above by the rule most retailers quote. A men’s 7 is a women’s 8 or 8.5, depending on whose chart you use.
This one tripped me up while checking numbers, because two sources I trust disagree. Wikipedia’s formulas put the standard women’s scale at 3 x foot in inches minus 21, which is one above the men’s 3 x foot minus 22. Road Runner Sports, a US running retailer, says women’s sizes run about 1.5 above men’s and gives the example that a women’s 8.5 is a men’s 7. An independent PDF I used as a cross-check also uses the 1.5 spread, so the retail convention is common in practice.
| Foot length | US men’s | US women’s, standard scale | US women’s, men’s + 1.5 |
|---|---|---|---|
| 245 mm | 7 | 8 | 8.5 |
| 270 mm | 10 | 11 | 11.5 |
It is half a size either way, which is inside the half-size accuracy I claim for the whole table. The more useful point is that a men’s and a women’s shoe of the same size number are built on different lasts, so the number is only part of the story. My men’s to women’s conversion chart uses the 1.5 rule, and the unisex size chart covers shoes sold across both.
Sources: Wikipedia, “Shoe size” (tier D); Road Runner Sports blog page, updated August 7, 2026 (tier C); Gilstrap PDF (tier D). The table is my calculation (tier E).Why do “average shoe size by country” lists disagree?
Short answer. They mix shoe sizes sold, feet measured and conversions between systems, and few of them say which. I read three popular lists and none named a measurement survey for its country figures.
I picked one row to test, because it was easy to check against the formulas. A popular table lists Chinese women at EU 36, UK 3.5 and US 3.5. Each number points to a foot length, and the three should agree.
| Number in the table | Foot length it implies | Does it agree? |
|---|---|---|
| EU 36 | 227 mm | Yes, close to the UK figure |
| UK 3.5 | 224 mm | Yes, close to the EU figure |
| US women’s 3.5 | 203 to 207 mm | No, about 20 mm shorter. US women’s runs 2 to 2.5 above UK, so the US number should be about 5.5 to 6 |
EU and UK agree, so the US figure looks like a copy of the UK one. For a foot of about 225 mm, the EU and UK numbers also sit about 6 to 12 mm below the measured Asian women’s figures I have: 233 mm in Japan, 235 mm in the Asian foot scans and 235.8 mm in Taiwan. I don’t take that further, since the table gives no source or date.
| Reason | Example from my research | What to do |
|---|---|---|
| Foot length, size sold or size converted | “Average size” can mean what people buy, what feet measure, or a conversion of either | Ask which one it is |
| Different systems quoted as one | Row in one table with UK and US the same number | Check the offset between systems |
| Men’s and women’s offsets | Plus 1 or plus 1.5 for the US women’s size | Say which rule you used |
| No named survey | 0 of the 3 country lists I read named one | Look for a sample size and date |
| Who was measured | Online shoppers in Japan, soldiers in the US, students in Iran | Name the group |
| Kind of average | Means, a median and a most common class on this page | Say which kind it is |
| Same page, two numbers | One page gives the US men’s average as 10 in a table and 10.5 in its text | Check the page against itself |
| Age of the data | Japan’s best data is from 2020, an older paper from 1998 | Date every figure |
What you can safely say. “No official average shoe size by country exists, and published country tables rarely name the survey behind their figures.” Then name the figure you’re quoting and its source.
Do brands and children’s sizes follow the same country rules?
Short answer. Only roughly. Brands add their own differences on top of the national system, and children’s sizes start again from a different zero. I didn’t test brands for this page, so I’d point you to the brand’s own chart.
Everything above is about the system. A brand can pick a last that runs a little long or short, and a half size of difference between two brands in the same country is common. I haven’t measured brands for this page, so I’m not putting numbers on it. My brand size charts convert US, UK and EU sizes, and most add foot length in cm: Nike, Adidas, New Balance, ASICS, HOKA and Brooks are the ones I’d start with.
Children’s sizes are a separate scale. The adult table on this page doesn’t apply to them. For children and babies, start with my kids shoe size conversion chart, the children’s shoe size chart by age and the baby shoe size conversion chart.
Width is the other thing a country system doesn’t capture. Among North American men with a 270 mm foot in a large scan study, the middle 90% spanned about 16 mm in width, so see my shoe width guide.
Who measures what?
The material on this page comes from five kinds of source, and each answers a different question. No statistics office appears, which is why the averages rest on research and company reports. Select a step to see what it covers and how I use it.
1Standards bodiesISO and national standards bodies
Define Mondopoint and give conversion tables for seven systems. I read ISO’s public records and abstracts, not the paid text, and I rely on Wikipedia’s summary for the formulas and the country list. ISO describes its own tables as a guideline.
2Reference articles and technical notesWikipedia, a footwear brand’s blog page, an independent PDF
Explain the units and give formulas from foot length to each size. I used the Wikipedia formulas and tested them against the other two, which agreed to within half a size.
3Company measurement reportsZOZO (Japan), the foot-scan study’s scanner maker
Measure a huge number of customers, such as 937,718 people in Japan in 2020. Large, but customers who chose to be measured, so not a random sample, and the report is the company’s own.
4University and government studiesThe Iran study, the US Army survey, earlier studies in a comparison table
Measure students, soldiers or small local groups with set methods. Careful, but small or unusual samples, and I read most of them through a table or summary. I mark them tier A or D.
5Popular country tablesSites that publish “average shoe size by country”
Give a size for each country with no survey, sample or date. I read them to test claims, and I use none of their figures.
How good is the evidence behind shoe sizes by country?
Short answer. Strong on the systems, thin on the averages. Of the 74 rows in this page’s dataset, 45% are my calculations (tier E), 30% are secondary reporting (tier D), 9% are company or retailer statements (tier C), 5% are official ISO records (tier B) and 11% are peer-reviewed (tier A).
| Evidence tier | Rows | Share |
|---|---|---|
| A Peer-reviewed research | 8 | 11% |
| B Official records and standards | 4 | 5% |
| C Company and retailer statements | 7 | 9% |
| D Secondary reporting | 22 | 30% |
| E UrbanStyle calculations | 33 | 45% |
| Total | 74 | 100% |
- Tier E is large on purpose. Most of what I add is conversion arithmetic. It’s shown, but it’s mine, not a published measurement.
- Tier D carries the country averages. Most rows that put numbers on a country’s feet are second-hand, and I say so each time.
- Counts are not quality scores. A tier B row tells you a standard exists, not that every brand follows it.
What I’m watching next
I don’t forecast. These are the things that would change this page, and what I’ll do if they appear.
- A new ISO 19407 edition or a notified Indian Bha standard. I’ll update the directory and the conversion notes.
- A newer ZOZO or other large national measurement report. The 2020 figures are the oldest thing I lean on for Japan, so I’d replace them as soon as something newer appears.
- Published foot lengths from India’s CSIR-CLRI survey or from Size Korea. Either would let me add an average for a country that is empty today.
- A second source for the Brazil and Mexico offsets. Then I can tabulate them.
- Any national foot survey from Europe, Latin America or Africa that reports means by sex.
- Corrections. If you know a measured source I missed, email me.
Every change goes in the freshness log.
Where other shoe-size-by-country articles go wrong
I read three popular “average shoe size by country” pages and looked at the search results for the phrase. Some of what follows I saw, and the rest are traps that are easy to fall into. This is not a complete audit of anyone’s work.
- Problem 1Country tables with no survey, sample size or date behind them. The ones I read named Wikipedia or a conversion chart as sources, or listed studies with no links.
- Problem 2Numbers that contradict the system, such as UK 3.5 and US 3.5 for the same women in one row.
- Problem 3The same page giving two different figures for the same average, such as the US men’s average as 10 in a table and 10.5 in the text.
- Problem 4Five countries presented as “the world”, with men missing for some of them and women missing for others.
- Problem 5Shoe size treated as if it were foot length, with no mention that the step differs between systems.
- Problem 6A single men’s-to-women’s rule stated without saying the other convention exists.
- Problem 7No downloadable data, so nobody can check or reuse the numbers.
How should you buy shoes from another country?
This is practical advice, separate from the research. It reflects what the standards and studies show, plus my own opinions where I say so.
- Measure both feet in millimetres and use the longer one. My foot measuring guide shows how, with versions for men and women.
- Convert from the measurement, not from a size. Use the table above or the calculator. Converting a size to a size passes the error twice.
- Check the seller’s own chart. Brands differ by up to about half a size around the standard conversions. If the chart gives foot length in cm or mm, match your measurement to that.
- If you are between sizes, go up. Wikipedia notes the standard sample conversions round up, and a foot can squeeze into a bigger shoe more easily than a smaller one. That last part is my opinion.
- For Japan, China and Korea, buy by foot length. A 270 mm foot is a 27.0 in Japan and a 270 in China and Korea. My US to Japan and China to US guides go through it.
- For women’s sizes, check which rule the seller uses. The plus 1 and plus 1.5 conventions differ by half a size.
- Know the return policy before you order across borders. Fit is the usual reason shoes come back. See my shoe return statistics and online shoe shopping statistics.
If you don’t want to work any of this out, my footwear buying guide covers the rest of the process.
Sources and evidence tiers
Evidence hierarchy
- APeer-reviewed research. The 1.2 million foot scan study, the Iranian measurement study and the 2022 systematic review on foot shape.
- BOfficial records and standards. The ISO records for ISO 9407:2019 and ISO 19407:2023. No statistics office publishes average shoe size, so there are no official statistics here.
- CCompany and retailer statements. The ZOZO report and the Road Runner Sports sizing rule. Useful, but a company’s own data and not independently reviewed.
- DSecondary reporting. Wikipedia’s summary of the standards, a brand’s blog page and a PDF used as cross-checks, the comparison rows in the Iran paper’s Table 3, the US Army survey read through a table, and a popular country table I tested.
- EEstimates and calculations. My conversions, differences and counts, with the method stated.
Primary versus secondary data
Primary source: the organisation or researchers who collected the data or wrote the standard. Secondary source: an article or table summarising someone else’s data. Where I could only read a secondary source, the table says so.
Source table
| Source | Year | Sample | Geography | Finding used | Tier | Series ID | Primary source |
|---|---|---|---|---|---|---|---|
| ISO 9407:2019, "Footwear sizing, Mondopoint system of sizing and marking", record on iso.org | 2019 | International standard. I read the public record and abstract, not the paid text | International | Specifies the Mondopoint method of designating and marking footwear size, based on defined measurements of the foot the footwear is meant to fit. Edition 2, published July 2019, confirmed June 30, 2026 | B | ISO 9407:2019 | ISO record |
| ISO 19407:2023, "Footwear, Sizing, Conversion of sizing systems", record on iso.org | 2023 | International standard. I read the public record and abstract, not the paid tables | International | Three conversion tables covering Mondopoint, European and UK systems plus China, Japan, Korea and the US, based on foot length. The tables are described as a guideline. It follows ISO/TS 19407:2015, withdrawn June 22, 2023 | B | ISO 19407:2023 | ISO record |
| Wikipedia, "Shoe size" (read October 21, 2026) | 2026 | Reference article that cites ISO and national standards and books | International | Paris point 2/3 cm, barleycorn 1/3 inch, Mondopoint 5 mm steps; formulas linking foot length to UK, US and EU sizes; which countries use which system; national standard numbers | D | n/a | Wikipedia |
| Haflinger, "Schuhgroesse berechnen mit dem Pariser Stich" (blog page, read October 21, 2026) | 2026 | Footwear brand blog page | Europe | EU size = (foot length in cm + 1.5) x 1.5; one Paris point is 2/3 cm; a 26.5 cm foot gives EU 42 | D | n/a | Haflinger blog page |
| J. S. Gilstrap, "Paris Point Barleycorn Shoe Sizing" (2019, CC BY-NC-ND 4.0), PDF hosted on amstzone.org | 2019 | Independent formula document | International | Formulas from foot length for Paris point, UK adult, US men and US women under different toe allowances; example: EU 40 = UK 6.5, US men 7.5, US women 9 | D | n/a | Gilstrap PDF |
| Road Runner Sports, "Women to men shoe size" (blog page published January 29, 2026, updated August 7, 2026) | 2026 | Retailer statement of a sizing rule | United States | In the US, women's sizes run about 1.5 larger than men's for the same foot length; a women's 8.5 is a men's 7 | C | n/a | Road Runner Sports page |
| ZOZO, Inc., "ZOZOレポ#1" report (June 11, 2020), measured with the ZOZOMAT | 2020 | 937,718 people aged 16 and over (410,256 men, 527,462 women) measured with ZOZOMAT from February 27 to May 31, 2020 | Japan | Mean foot length: men 25.5 cm (left foot) and 25.4 cm (right), women 23.3 cm (both feet); both sexes together 24.3 cm (left) and 24.2 cm (right) | C | n/a | ZOZO report (PDF) |
| Hajaghazadeh M, Emamgholizadeh Minaei R, Allahyari T, Khalkhali H, "Anthropometric Dimensions of Foot in Northwestern Iran and Comparison with Other Populations", Health Scope, 2018 | 2018 | 580 university students aged 18 to 30 in Urmia (290 men, 290 women), right foot | Iran | Mean foot length 270.03 mm for men and 234.35 mm for women | A | Health Scope 7(3), e14063 | Hajaghazadeh et al. (Brieflands) |
| Table 3 of Hajaghazadeh et al. (2018), which lists mean foot lengths from earlier studies of other populations | 2018 | Six earlier studies of 24 to 2,000 people per sex. I did not open the originals | Japan, Taiwan, Hong Kong, Italy, Australia, North America | Japan (Kouchi, 1998): 247.9 and 227.4 mm; Taiwan (Lee and Wang, 2015): 259.7 and 235.8; Hong Kong (Xiong et al., 2008): 254.7 and 238.0; Italy (Tomassoni et al., 2014): 261.7 and 233.7; Australia (Hemy et al., 2013): 273.4 and 245.6; North America men (Hawes and Sovak, 1994): 263.2 | D | Health Scope 7(3), e14063, Table 3 | Hajaghazadeh et al. (Table 3) |
| Jurca A, Zabkar J, Dzeroski S, "Analysis of 1.2 million foot scans from North America, Europe and Asia", Scientific Reports, 2019 | 2019 | 1,200,847 3D foot scans of customers at 712 stores, Nov 2017 to Aug 2018 (North America 1,105,508; Europe 74,534; Asia 20,805) | North America, Europe, Asia | Most frequent foot-length class: men 270 mm and women 245 mm in North America and Europe; men 255 mm and women 235 mm in Asia | A | DOI 10.1038/s41598-019-55432-z | Jurca et al. (PMC) |
| Gordon CC et al., "2012 Anthropometric Survey of U.S. Army Personnel: Methods and Summary Statistics" (Natick TR-15/007, 2014), read through an NC State Ergonomics Center summary table | 2012 | US Army personnel measured 2010 to 2012. The table I read does not state its sample | United States (military) | Median foot length 10.67 in (271 mm) for men and 9.59 in (244 mm) for women | D | Table row 30 (inches) | NC State summary table |
| "Foot morphological variations between different ethnicities and sex: a systematic review", Footwear Science, 2022 (vol. 15, no. 1, pp. 55 to 71); abstract read | 2022 | Systematic review of 17 studies with 15,235 participants. I read the abstract page only | International | Evidence suggests foot morphology differs among ethnicities and between the sexes; the largest differences were between Asian populations and Australian and Pacific Islander populations | A | Footwear Science 15(1) | St Mary's repository record |
| World Population Review, "Average shoe size by country" (read October 21, 2026) | 2026 | Table of five countries; no data date stated; the only sources listed are Wikipedia and a conversion chart | China, United States, Canada, United Kingdom, Netherlands | The China row reads: women EU 36, UK 3.5, US 3.5; men EU 38.5, UK 5.5, US 6 | D | n/a | World Population Review page |
| UrbanStyle Footwear calculations on this page | 2026 | Arithmetic on figures from the sources above; method stated | Global | Conversions between foot length and shoe sizes, differences and counts on this page | E | n/a | Methodology |
Methodology and limitations
How I built this page. I started with the standards and official records, then peer-reviewed measurement studies, then company reports, and only then articles. For each figure I recorded the source, date, sample and what kind of evidence it is. I read the ISO records for ISO 9407:2019 and ISO 19407:2023 on iso.org, though not the paid standards. I read Wikipedia’s “Shoe size” article for the systems, the country list and the formulas, and I checked the formulas against a brand blog page and an independent PDF. I read the Iran paper and its Table 3 at the publisher, the foot scan study on PubMed Central, the ZOZO report in its original Japanese, a BCN+R news report that gives the same national average, the Road Runner Sports page, and the US Army figures through an NC State summary table. The review on foot shape I read at abstract level. Everything was read on October 21, 2026. Where I calculated something, it’s labelled E and the method is in the dataset.
What I left out. I left out the Malaysian, Chinese and Indian rows in the Iran paper’s Table 3, which come from one study in a forensic science journal. Their men’s figures sit 21 to 40 mm below every other Asian men’s figure I have, and I couldn’t open the study to check why. I left out Brazil and Mexico numeric conversions, because I couldn’t confirm the offsets from a second source. I left out Australian women’s conversions, because charts disagree. I left out the ZOZO width figures, because the text I could read did not let me tell the columns apart. I left out brand-by-brand differences, children’s scales, shoe size history and any claim that sizes are rising, which I cover on the foot size page.
Limitations you should know about
- Conversions are approximate. The formulas are good to about half a size, and ISO itself calls its tables a guideline. Brands differ on top of that.
- The ZOZO data is from 2020. It is a company report on people who chose to be measured, mostly online shoppers, and I found nothing newer.
- Most country rows are second-hand. They come through one table in a 2018 paper. Three have fewer than 150 people per sex, and the originals could not be opened.
- The US Army figures are second-hand and describe soldiers. I could not open the original table.
- Different groups, different methods. Online shoppers, soldiers and students are not comparable, so I show the spread and do not rank countries.
- The directory is a sample. It lists 23 countries Wikipedia names, and the Brazil and Mexico details are incomplete.
- Coverage is uneven. I found no usable measured average for India, Brazil, Mexico, or most of Africa and Latin America.
Data freshness
| Date | Change |
|---|---|
| October 21, 2026 | First publication. ISO records, Wikipedia’s summary of the standards, cross-check formulas, the ZOZO report, the Iran paper and its Table 3, the US Army table, the foot scan study and the systematic review on foot shape. Downloadable dataset, three charts and calculations with stated methods. |
| When a newer standard or measurement report appears | Planned update of the matching figures. |
| January 2027 | Next scheduled full review. |
Last full source review: October 21, 2026. Next scheduled review: January 2027.
Corrections. If you spot an error or have better data, email info@urbanstylefootwear.com with the subject “Data correction”. I’ll check it and note any change in the table above. How I test and review products is explained in our methodology.
For journalists and researchers
You can use the statistics and charts on this page with credit to UrbanStyle Footwear. Wherever you can, please cite the original source printed with each statistic. My own calculations are marked tier E and can be cited to me.
A sentence you can use. “One full shoe size covers about 5 mm of foot in Mondopoint, 6.7 mm in EU sizing and 8.5 mm in UK and US sizing, and no statistics office publishes an average shoe size by country. In a 2020 report on 937,718 people in Japan, the average man’s foot was about 254.5 mm, roughly EU 40.” (Sources: ISO and national standards as summarised by Wikipedia; ZOZO report, 2020; conversion by UrbanStyle Footwear)
Media kit
All figures with value, unit, geography, segment, basis, period, source and evidence tier.
Three charts with source, scope and data type printed on each image. SVG versions are under each chart above.
The 15 citable statistics on one printable PDF.
Every source with year, sample, geography, tier, series ID and link.
Foot length from 220 to 320 mm in 5 mm steps, with EU, UK, US, Japan, China and Korea sizes.
Ready-made citations below. Media and research enquiries go to info@urbanstylefootwear.com.
Cite this page
Suggested citation
UrbanStyle Footwear. “Shoe Size by Country 2026: Sizing Systems and Average Sizes Compared.” Updated October 21, 2026. https://urbanstylefootwear.com/shoe-size-by-country/
APA style
Vahith, A. (2026, October 21). Shoe size by country 2026: sizing systems and average sizes compared. UrbanStyle Footwear. https://urbanstylefootwear.com/shoe-size-by-country/
Link (HTML)
<a href="https://urbanstylefootwear.com/shoe-size-by-country/">Shoe Size by Country 2026 by UrbanStyle Footwear</a>Click any citation, then press Ctrl+C (Cmd+C on Mac) to copy it.
For individual statistics, UrbanStyle recommends citing the original source listed in the source table whenever possible.
Data requests. Data correction or dataset request: info@urbanstylefootwear.com
Frequently asked questions
Which countries use US shoe sizes?
The United States and Canada, according to Wikipedia’s summary of the standards. The US scale counts in barleycorn steps (8.5 mm) like the UK scale but starts one number higher for men, so a US men’s 10 is about a UK 9. See which countries use which system and my US vs UK vs EU guide.
Which countries use EU shoe sizes?
Continental Europe (Austria, France, Germany, Italy and Spain among others), Iran, Hong Kong and, with an offset, Brazil. EU sizes count in Paris points of 2/3 cm, so one EU size is about 6.7 mm of foot length. See the country directory.
What shoe size system do Japan, China and Korea use?
Mondopoint, which labels the shoe with the foot length it fits: usually in cm in Japan and in mm in China and Korea. A 270 mm foot is a 27.0 in Japan and a 270 in China and Korea. See my US to Japan chart and China shoe size to US.
What is Mondopoint?
A metric sizing method that names a shoe by the foot it is meant to fit, in millimetres, optionally with a width (for example 280/110). It is defined in ISO 9407:2019, and lengths step in 5 mm for casual footwear. See how many sizing systems there are.
What is a Paris point?
The unit behind EU shoe sizes: 2/3 of a centimetre, or about 6.67 mm. A full EU size is one Paris point, and a half size is 3.3 mm. It is why EU numbers climb faster than UK or US numbers for the same foot.
Is an Indian shoe size the same as a UK size?
India is listed with the UK-style barleycorn scale, so a UK size and an Indian size are usually the same number on a label, though brands can differ. A new Indian system called Bha, with eight sizes, was proposed but was still a proposal in the April 2024 report I read. See my Indian vs UK shoe size guide.
How do I convert shoe sizes between countries?
Measure the foot in millimetres and convert from that, not from one size to another. The approximate formulas are EU = 1.5 x foot in cm + 2, UK = 3 x foot in inches – 23, and US men’s = UK + 1. My conversion table does the sums every 5 mm, and my calculator does the rest.
What is the average shoe size by country?
There is no official figure. What exists are measured foot lengths for a few countries, which I convert into sizes: the average Japanese man’s foot is about EU 40, UK 7 and US 8, and the average woman’s about EU 37, UK 4.5 and US 7. See the average shoe size section.
What is the average shoe size in the US?
Nobody publishes an official one. The nearest measured evidence is a US Army median foot of 271 mm for men and 244 mm for women, and a most common class of 270 mm and 245 mm in North American foot scans. That is about a US men’s 10 and a US women’s 8 to 8.5. See average men’s shoe size and average women’s shoe size.
Why are US and UK shoe sizes different?
Both count in the same 8.5 mm steps but start from different points. By the standard formulas, the US men’s size is the UK size plus 1 for the same foot, and the standard US women’s size is the UK size plus 2. See UK 8 to US.
Is a women's size men's size plus 1 or plus 1.5?
Both rules are in use. Retailers such as Road Runner Sports say women’s sizes run about 1.5 above men’s for the same foot, while the standard women’s scale in the formulas sits 1 above. Half a size is the difference. See men’s to women’s conversion.
Does the same size mean the same foot length everywhere?
No. A one-size step is 5 mm in Mondopoint, 6.7 mm in EU sizes and 8.5 mm in UK and US sizes, and brands add their own differences on top. Two sizes in the UK system is about 17 mm, but only about 13 mm in the EU system.
How should I choose a size when I buy from another country?
Measure both feet in millimetres, use the larger foot, convert with a table based on foot length, then check the seller’s own chart, because brands differ. See buying across countries and my foot measuring guide.
Can I use these statistics and download the data?
Yes, with credit to UrbanStyle Footwear, and cite the original source for any single statistic where you can. The CSV, XLSX, charts and a printable list of key statistics are in the media kit, with citation formats.