
I went looking for the share of shoes sold online and found that nobody publishes an official one. This page shows what the numbers can and can’t tell you, with every source dated, linked and graded, and the data free to download.
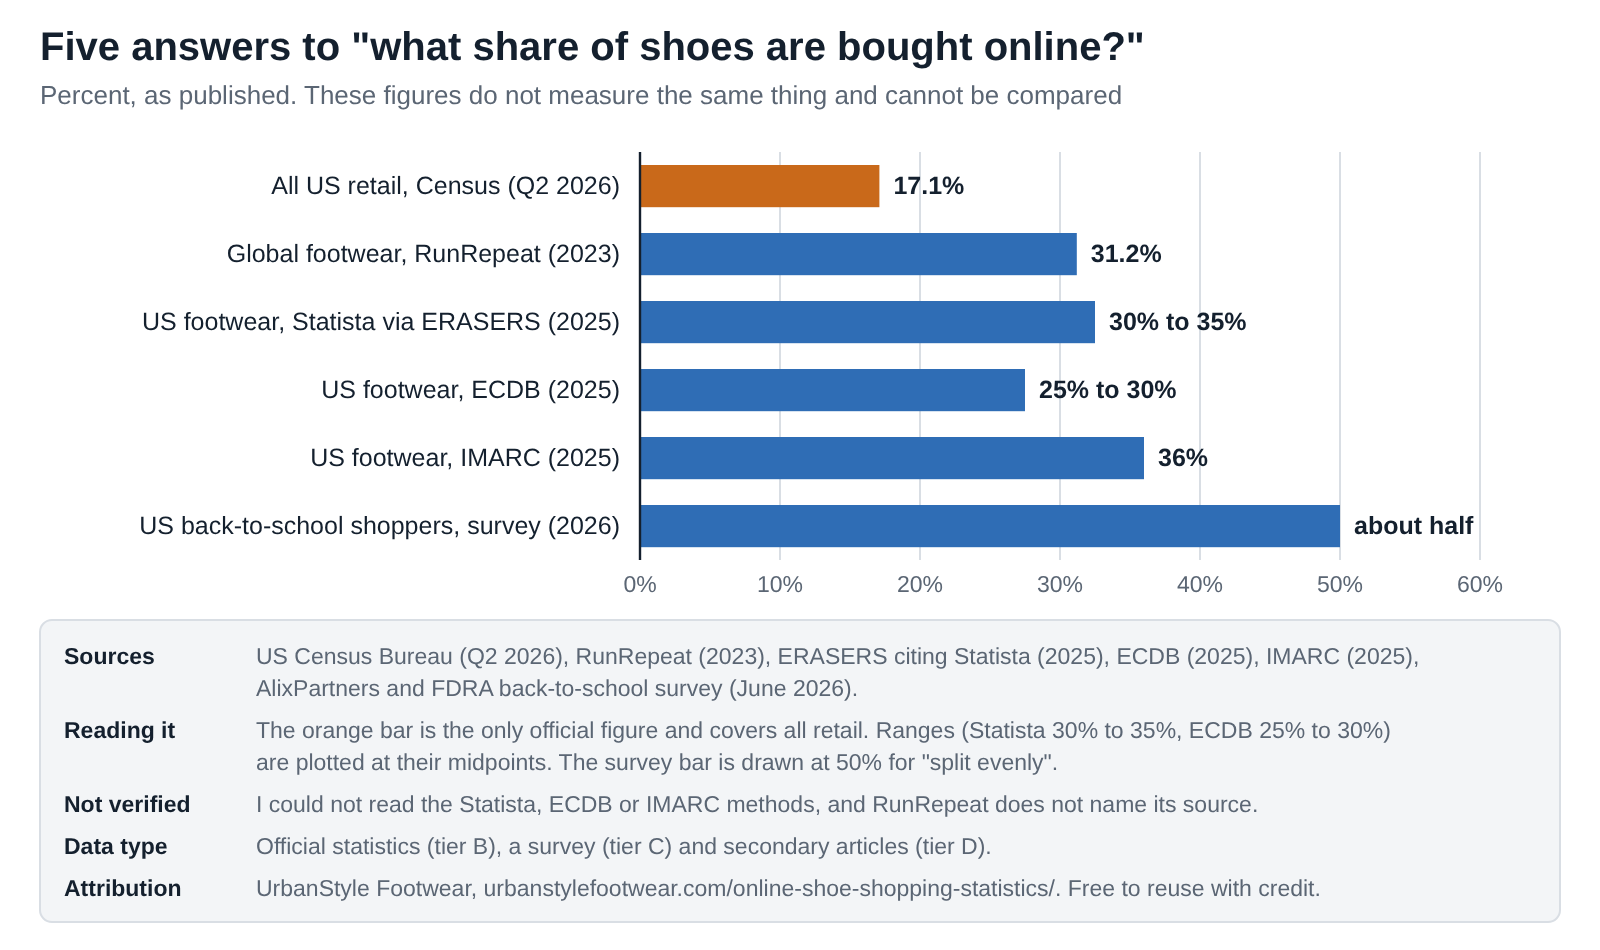
One question, six answers: what share of shoes are bought online? Select a source to see what each figure counts.
Select a source above, for example “IMARC estimate”, to see why the headline numbers disagree.
17.1%The Census Bureau estimated that 17.1% of all US retail sales in the second quarter of 2026 were online (tier B). It is the one official number here, and it covers every product, not shoes.
25% to 30%ECDB, a market-intelligence vendor, puts the online share of US footwear at 25% to 30% for 2025 and $76.9 billion in sales (tier C). Its public page does not show the full method.
30% to 35%A June 2026 guide credits Statista with 30% to 35% and about $74.5 billion for 2025 (tier D). I could not read Statista's forecast, so this is as the article reports it.
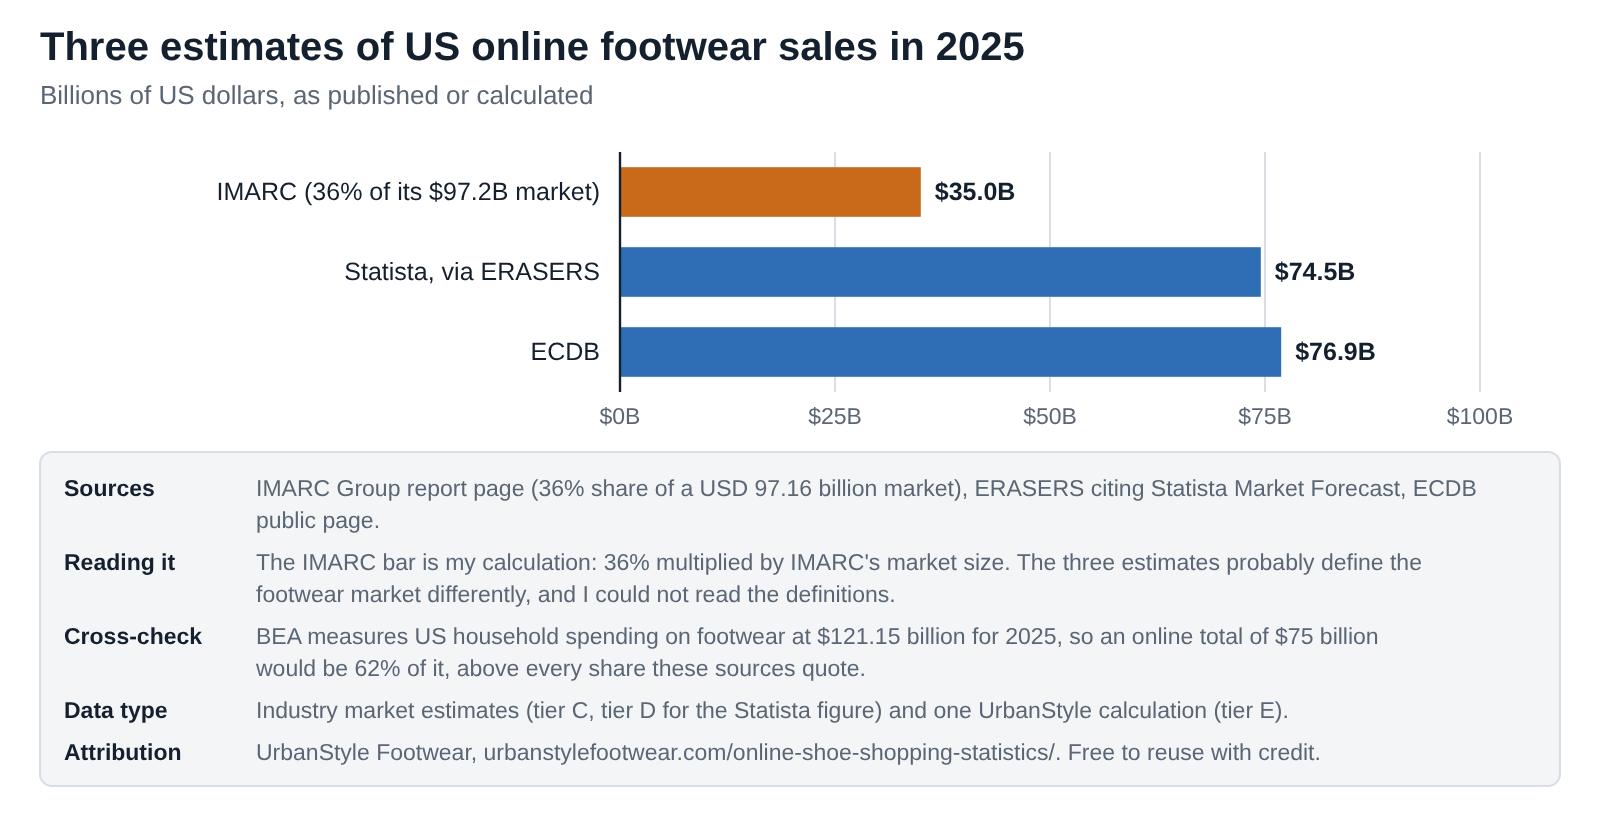
36%IMARC Group says online sales hold 36% of a $97.16 billion US footwear market in 2025 (tier C). That is about $35.0 billion, less than half of the other two dollar figures.
31.2%A 2023 RunRepeat guide gives 31.2% for the global footwear market (tier D). It names no source for the number and it is not a US figure.
Split evenlyAlixPartners and FDRA described June 2026 back-to-school shoe sales as split evenly between online and in store, in a survey of more than 1,000 US consumers (tier C). It covers shoppers' stated plans, not sales records.
None of these is an official US shoe online share. Full comparison: what share of shoes are bought online?
Online shoe shopping at a glance
Quick answer. Nobody publishes an official figure for how many shoes are bought online in the US. The Census Bureau says 17.1% of all retail sales were online in the second quarter of 2026, but that covers everything from groceries to cars. For footwear, three industry sources put the 2025 share anywhere from 25% to 36% (ECDB, Statista and IMARC). None shows its method publicly, and their dollar figures differ by more than double. The best recent survey I found, from AlixPartners and FDRA in June 2026, had back-to-school shoe buying split evenly between online and stores. If you need a number for a sentence, write “industry estimates put it at roughly a third” and name the estimate. Don’t write it as a fact.
I built this page because the numbers on this topic kept contradicting each other. Below you’ll find what I could trace to a real source, what kind of evidence each number is, why the headline figures disagree, and what I left out. If you’re shopping rather than researching, jump to buying shoes online, or read my footwear buying guide. For the other side of online orders, see my shoe return statistics.
Key findings
- There is no official US figure for the share of shoes bought online. The Census Bureau’s closest number covers all retail: 17.1% of sales were online in the second quarter of 2026, or $340.2 billion.
- Three industry sources put the 2025 online share of US footwear at 25% to 30% (ECDB), 30% to 35% (Statista, as cited by ERASERS) and 36% (IMARC). A 2023 guide says 31.2% globally. I couldn’t find a published method for any of them.
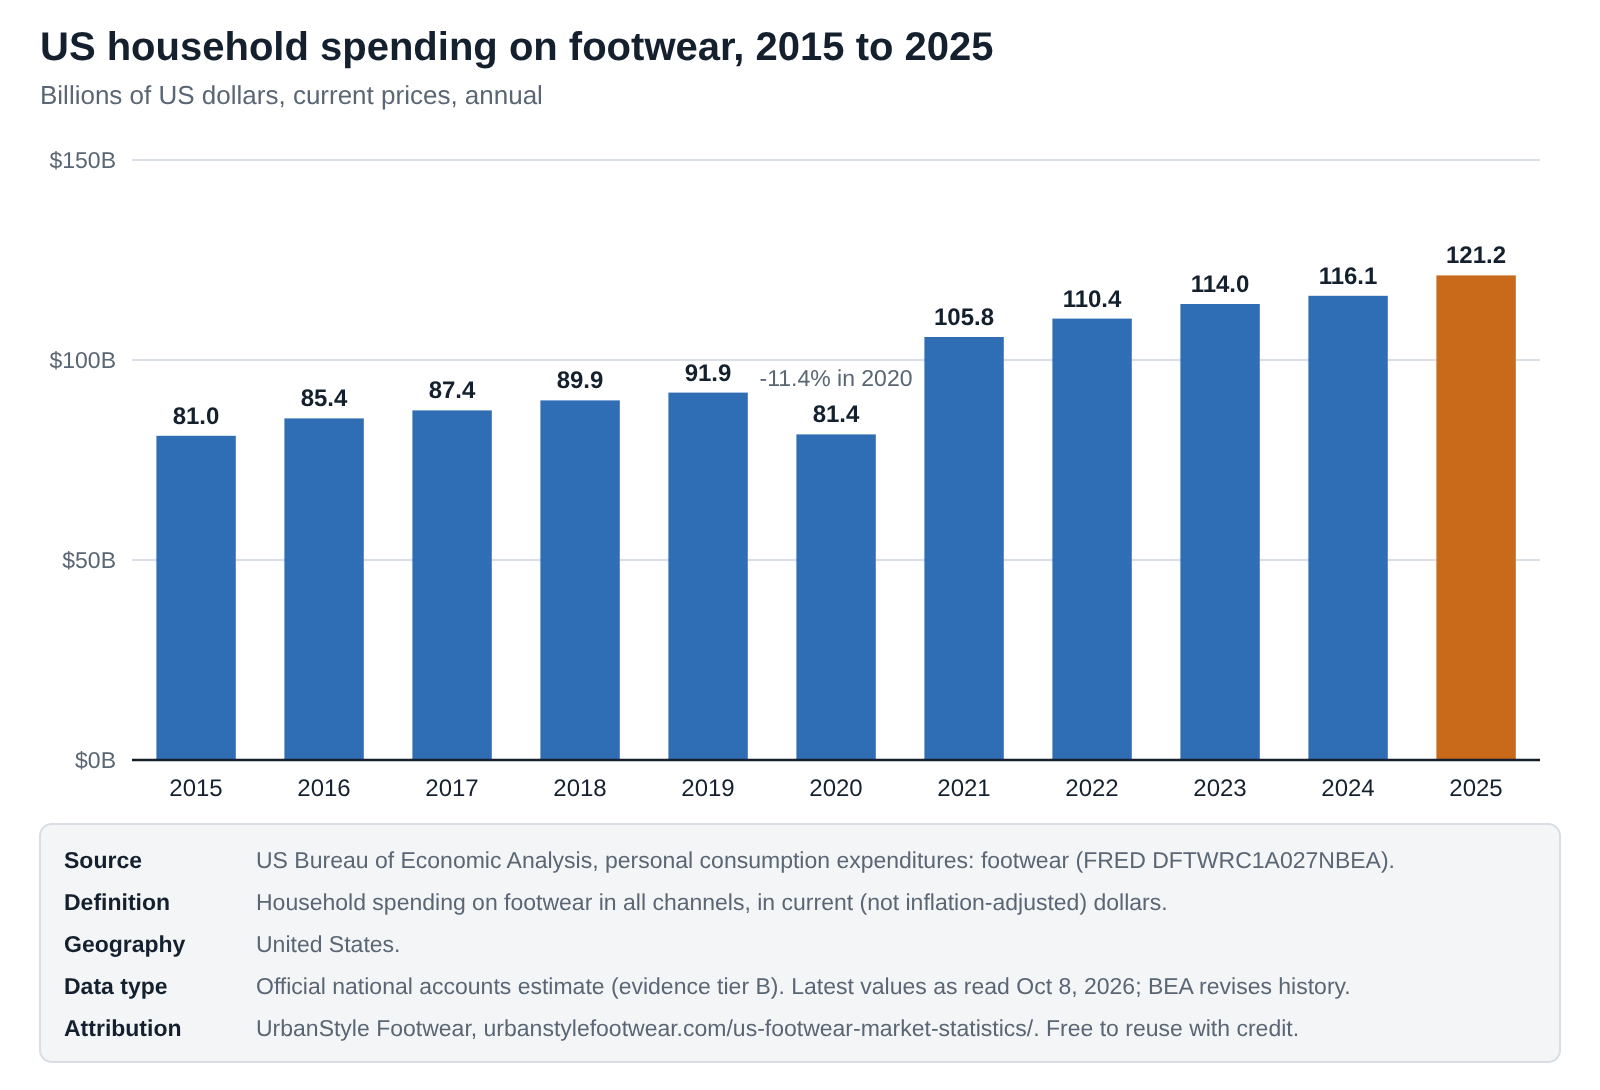
- Their dollar figures disagree by more than double: about $35.0 billion (IMARC’s share of its own market size, my calculation), $74.5 billion (Statista) and $76.9 billion (ECDB). The two larger ones imply a total footwear market of $213 billion to $308 billion, while the Bureau of Economic Analysis measures US household footwear spending at $121.15 billion.
- You can’t back into the answer from Census shoe-store sales. Census said in 2016 that online sales of companies that also run stores are counted in a separate e-commerce industry, and shoe stores made up only about 32% of household footwear spending in 2025 anyway.
- US e-commerce is still growing faster than retail as a whole: up 12.2% in the second quarter of 2026 against 6.7% for all retail, and from 11.2% of sales in late 2019 to 17.1%.
- Brands aren’t all moving the same way. Nike’s own digital sales fell 20% and then 12% in the last two fiscal years while wholesale grew again. Deckers’ direct share slipped from 42.7% to 41.4%. Crocs, On and adidas grew direct or e-commerce sales faster than wholesale.
- Fit is what keeps stores in the picture. In a spring 2026 survey, 70% gave trying shoes on as a reason to shop in a store and 65% gave getting the product immediately. Size being out of stock was a reason for abandoning a purchase for 65%, up 31 points in a year.
- Surveys call the channel split a toss-up. AlixPartners and FDRA found back-to-school buying split evenly, and YouGov found 27% of US adults shop for clothes and shoes mostly online, 34% mostly offline and 34% evenly.
- I couldn’t verify a current ranking of the biggest online shoe retailers, or a shoe-only mobile share. The rankings I found are 2021 data, so I haven’t repeated them.
What we know and what we don’t
Here’s where the public evidence stands as of October 2026.
| Question | Evidence status | Why |
|---|---|---|
| Online share of all US retail | Official statistic | Census: 17.1% in Q2 2026, seasonally adjusted, later revised |
| Online share of US shoe sales | No official figure | Census and BEA don’t split footwear by channel |
| Industry estimates of that share | Can’t be checked | 25% to 36% across ECDB, Statista and IMARC; dollar figures differ by more than double and no method is public |
| What brands sell direct | Read at the source | Company results filings, though each defines “direct” its own way |
| Whether online shoe share is rising | Mixed signals | All-retail e-commerce is up; Nike and Deckers leaned back toward wholesale |
| Why shoppers use stores or abandon carts | Survey evidence | One 2026 survey of 1,006 adults; stated reasons, not behaviour |
| Mobile share of online shoe sales | No verified figure | Adobe’s 56.4% of online transactions is for all retail; the footwear number I found has no named source |
| Amazon’s share of shoe sales | No verified figure | AlixPartners says Amazon’s footwear reach grew, with no numbers in its public release |
| Top online shoe retailers by sales | No current ranking | The lists I found use 2021 data |
15 online shoe shopping statistics you can cite
Each card has one number, one sentence of context and its source. “Copy text” opens a box with the sentence, the source and a link back here. Please cite the original source for any single statistic. Cards marked E are my own calculations, and the method is on the card or in the dataset.
The Census Bureau estimated US retail e-commerce sales at $340.2 billion in the second quarter of 2026, seasonally adjusted. It covers every kind of product, not shoes alone.
Copy text
$340.2B US e-commerce sales, Q2 2026: The Census Bureau estimated US retail e-commerce sales at $340.2 billion in the second quarter of 2026, seasonally adjusted. It covers every kind of product, not shoes alone. Source: US Census Bureau (Release CB26-133). Via UrbanStyle Footwear: https://urbanstylefootwear.com/online-shoe-shopping-statistics/
E-commerce was 17.1% of total US retail sales in Q2 2026, up from 11.2% in Q4 2019 (Census, seasonally adjusted). The figure covers all retail, not footwear.
Copy text
17.1% of US retail sales were online: E-commerce was 17.1% of total US retail sales in Q2 2026, up from 11.2% in Q4 2019 (Census, seasonally adjusted). The figure covers all retail, not footwear. Source: Census via FRED (FRED series ECOMPCTSA and ECOMSA (updated Aug 18, 2026)). Via UrbanStyle Footwear: https://urbanstylefootwear.com/online-shoe-shopping-statistics/
US e-commerce sales were up 12.2% on a year earlier in Q2 2026, against 6.7% for total retail sales (Census, seasonally adjusted). All retail, not footwear.
Copy text
+12.2% e-commerce growth, Q2 2026: US e-commerce sales were up 12.2% on a year earlier in Q2 2026, against 6.7% for total retail sales (Census, seasonally adjusted). All retail, not footwear. Source: US Census Bureau (Release CB26-133). Via UrbanStyle Footwear: https://urbanstylefootwear.com/online-shoe-shopping-statistics/
Adobe found that 56.4% of US online transactions between November 1 and December 31, 2025 took place on a mobile device, up from 54.5% in 2024. All retail, not footwear.
Copy text
56.4% of online holiday transactions on mobile: Adobe found that 56.4% of US online transactions between November 1 and December 31, 2025 took place on a mobile device, up from 54.5% in 2024. All retail, not footwear. Source: Adobe holiday recap. Via UrbanStyle Footwear: https://urbanstylefootwear.com/online-shoe-shopping-statistics/
In a spring 2026 survey of 1,006 US footwear consumers, 70% gave "I like to try on shoes before buying" as a reason to shop in a store (AlixPartners and FDRA).
Copy text
70% like to try shoes on first: In a spring 2026 survey of 1,006 US footwear consumers, 70% gave "I like to try on shoes before buying" as a reason to shop in a store (AlixPartners and FDRA). Source: AlixPartners and FDRA, spring 2026. Via UrbanStyle Footwear: https://urbanstylefootwear.com/online-shoe-shopping-statistics/
In the same survey, 65% cited their size being out of stock as a reason for abandoning a purchase, up 31 percentage points on 2025 (AlixPartners and FDRA).
Copy text
65% size out of stock, a reason to abandon: In the same survey, 65% cited their size being out of stock as a reason for abandoning a purchase, up 31 percentage points on 2025 (AlixPartners and FDRA). Source: AlixPartners and FDRA, spring 2026. Via UrbanStyle Footwear: https://urbanstylefootwear.com/online-shoe-shopping-statistics/
NIKE Direct revenue was $17.7 billion in the year ended May 31, 2026, down 6%, with NIKE Brand Digital down 12%. Wholesale rose 6% to $27.5 billion (Nike).
Copy text
$17.7B NIKE Direct revenue, fiscal 2026: NIKE Direct revenue was $17.7 billion in the year ended May 31, 2026, down 6%, with NIKE Brand Digital down 12%. Wholesale rose 6% to $27.5 billion (Nike). Source: NIKE fiscal 2026 results. Via UrbanStyle Footwear: https://urbanstylefootwear.com/online-shoe-shopping-statistics/
NIKE Direct revenue fell from $21.5 billion in fiscal 2024 to $17.7 billion in fiscal 2026, about 18% (UrbanStyle calculation from Nike's reported figures; the fiscal 2026 figure is rounded).
Copy text
about 18% fall in NIKE Direct, fiscal 2024 to 2026: NIKE Direct revenue fell from $21.5 billion in fiscal 2024 to $17.7 billion in fiscal 2026, about 18% (UrbanStyle calculation from Nike's reported figures; the fiscal 2026 figure is rounded). Source: UrbanStyle calculation. Via UrbanStyle Footwear: https://urbanstylefootwear.com/online-shoe-shopping-statistics/
Direct-to-consumer was 41.4% of Deckers' net sales in the year to March 31, 2026, down from 42.7% (UrbanStyle calculation from company figures). Deckers owns HOKA and UGG.
Copy text
41.4% Deckers direct-to-consumer share, fiscal 2026: Direct-to-consumer was 41.4% of Deckers' net sales in the year to March 31, 2026, down from 42.7% (UrbanStyle calculation from company figures). Deckers owns HOKA and UGG. Source: UrbanStyle calculation. Via UrbanStyle Footwear: https://urbanstylefootwear.com/online-shoe-shopping-statistics/
Direct-to-consumer made up 55.6% of Crocs, Inc. revenue in Q2 2026, against 50.9% a year earlier (UrbanStyle calculation from company figures). It includes company stores, not only e-commerce.
Copy text
55.6% Crocs direct-to-consumer share, Q2 2026: Direct-to-consumer made up 55.6% of Crocs, Inc. revenue in Q2 2026, against 50.9% a year earlier (UrbanStyle calculation from company figures). It includes company stores, not only e-commerce. Source: UrbanStyle calculation. Via UrbanStyle Footwear: https://urbanstylefootwear.com/online-shoe-shopping-statistics/
On Holding reported that direct-to-consumer net sales were 45.7% of net sales in Q2 2026, with DTC up 26.0% against wholesale up 4.8% (in Swiss francs).
Copy text
45.7% On direct-to-consumer share, Q2 2026: On Holding reported that direct-to-consumer net sales were 45.7% of net sales in Q2 2026, with DTC up 26.0% against wholesale up 4.8% (in Swiss francs). Source: On Q2 2026 results (Form 6-K, Exhibit 99.3). Via UrbanStyle Footwear: https://urbanstylefootwear.com/online-shoe-shopping-statistics/
adidas reported currency-neutral e-commerce revenue growth of 27% in Q2 2026, against 23% for own retail and 6% for wholesale. All categories, not shoes alone.
Copy text
+27% adidas e-commerce growth, Q2 2026: adidas reported currency-neutral e-commerce revenue growth of 27% in Q2 2026, against 23% for own retail and 6% for wholesale. All categories, not shoes alone. Source: adidas Q2 2026 release (EQS ad hoc release). Via UrbanStyle Footwear: https://urbanstylefootwear.com/online-shoe-shopping-statistics/
YouGov found that 27% of US adults shop for clothes and shoes mostly or always online, 34% mostly or always offline and 34% about evenly across both (August 2025 to August 2026).
Copy text
27% / 34% mostly online / mostly offline: YouGov found that 27% of US adults shop for clothes and shoes mostly or always online, 34% mostly or always offline and 34% about evenly across both (August 2025 to August 2026). Source: YouGov Profiles. Via UrbanStyle Footwear: https://urbanstylefootwear.com/online-shoe-shopping-statistics/
Published estimates of the online share of US footwear sales in 2025 run from 25% to 36% (ECDB, Statista via ERASERS, IMARC). None shows its method on the public page, and Census publishes no shoe-only figure (UrbanStyle comparison).
Copy text
25% to 36% online share claims for US footwear: Published estimates of the online share of US footwear sales in 2025 run from 25% to 36% (ECDB, Statista via ERASERS, IMARC). None shows its method on the public page, and Census publishes no shoe-only figure (UrbanStyle comparison). Source: UrbanStyle calculation. Via UrbanStyle Footwear: https://urbanstylefootwear.com/online-shoe-shopping-statistics/
NRF and Happy Returns estimated that 19.3% of online sales would be returned in 2025. It covers all online retail, not footwear.
Copy text
19.3% of online retail sales returned: NRF and Happy Returns estimated that 19.3% of online sales would be returned in 2025. It covers all online retail, not footwear. Source: NRF and Happy Returns, 2025. Via UrbanStyle Footwear: https://urbanstylefootwear.com/online-shoe-shopping-statistics/
How big is US e-commerce overall?
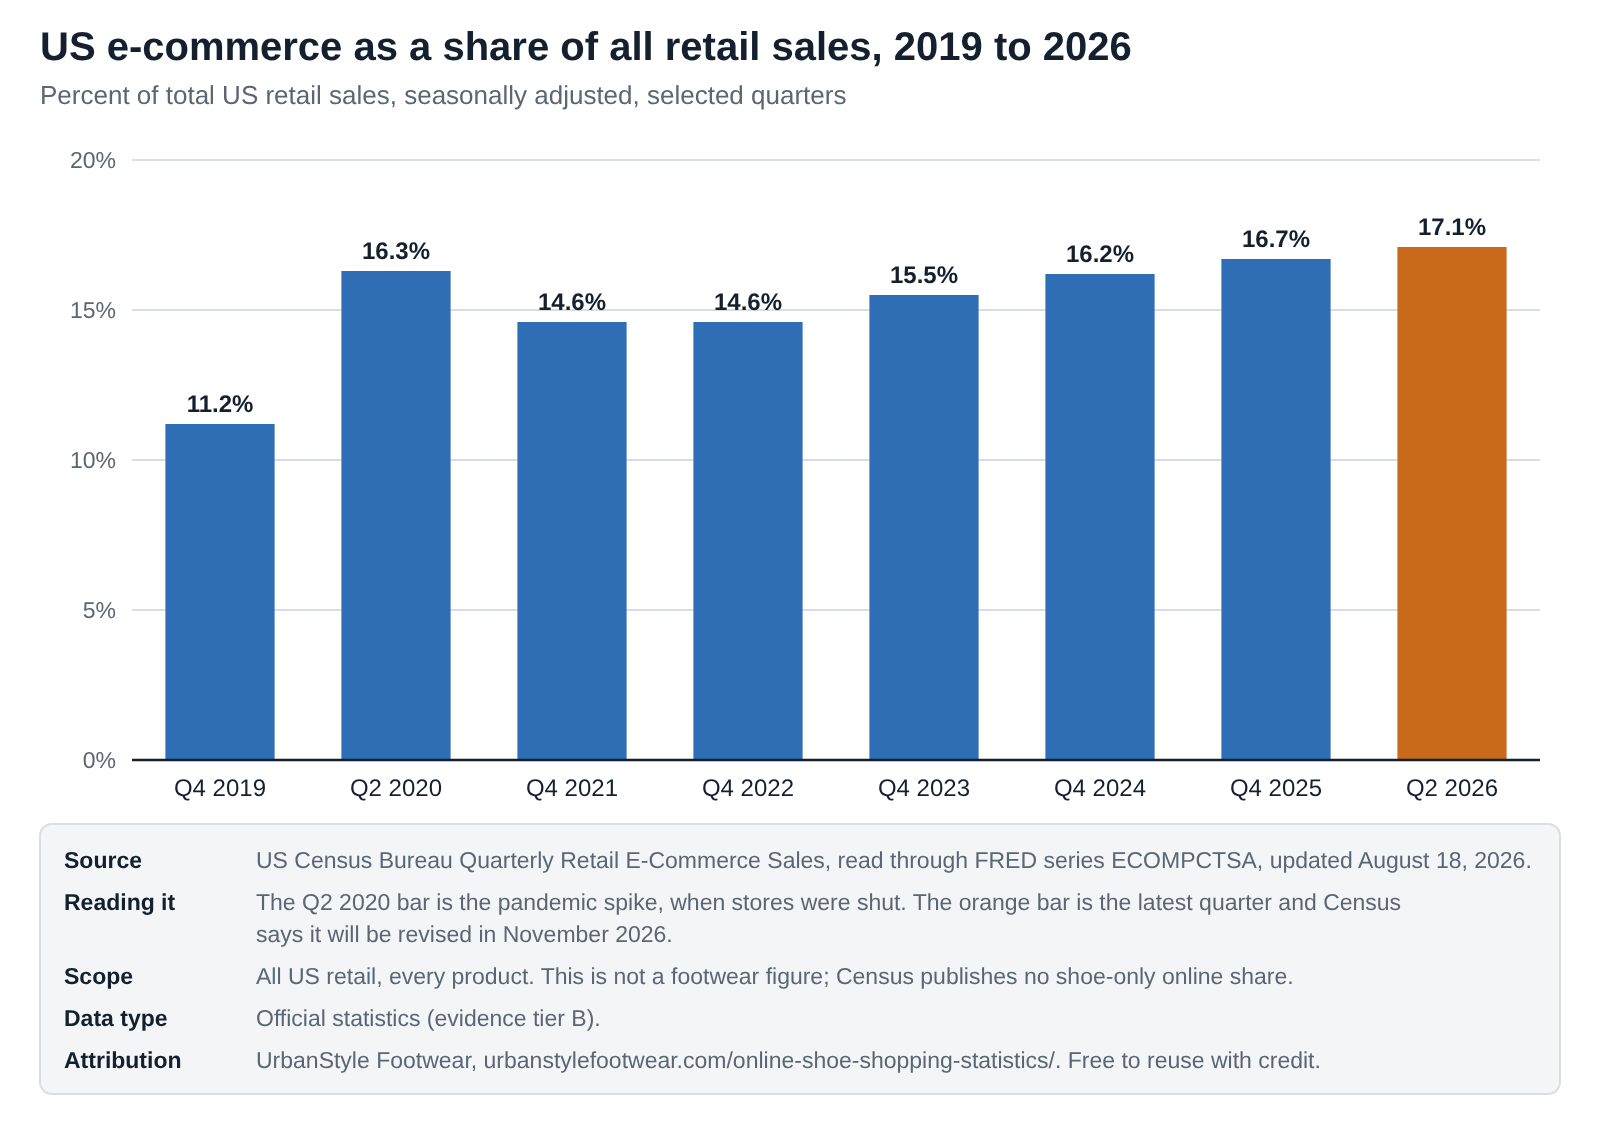
Short answer. The Census Bureau estimated US retail e-commerce at $340.2 billion in the second quarter of 2026, or 17.1% of total retail sales (seasonally adjusted). That’s up from 11.2% in the last quarter of 2019. It covers every product, so it isn’t a shoe number.
It’s still the most solid number in this whole topic, so it’s worth knowing the shape of it. The share jumped to 16.3% in the spring 2020 lockdown, slid back to 14.6% by late 2021 and has climbed steadily since.
Embed this chart
<figure style="margin:0"><a href="https://urbanstylefootwear.com/online-shoe-shopping-statistics/"><img src="https://urbanstylefootwear.com/wp-content/uploads/2026/10/usf-us-ecommerce-share-of-retail-2019-2026.png" alt="Bar chart of US e-commerce as a share of all retail sales: 11.2 percent in Q4 2019, 16.3 percent in Q2 2020, 14.6 percent in Q4 2021, 14.6 percent in Q4 2022, 15.5 percent in Q4 2023, 16.2 percent in Q4 2024, 16.7 percent in Q4 2025 and 17.1 percent in Q2 2026" width="800" style="max-width:100%;height:auto"></a><figcaption>Source: UrbanStyle Footwear, based on US Census Bureau quarterly e-commerce data. <a href="https://urbanstylefootwear.com/online-shoe-shopping-statistics/">Online Shoe Shopping Statistics 2026</a></figcaption></figure>Click the code, press Ctrl+C (Cmd+C on Mac), and paste it into any web page. Please keep the attribution link.
View as table
| Quarter | E-commerce share of US retail sales (%) | Source |
|---|---|---|
| Q4 2019 | 11.2 | Census via FRED (ECOMPCTSA), seasonally adjusted |
| Q2 2020 | 16.3 | Census via FRED (ECOMPCTSA), seasonally adjusted |
| Q4 2021 | 14.6 | Census via FRED (ECOMPCTSA), seasonally adjusted |
| Q4 2022 | 14.6 | Census via FRED (ECOMPCTSA), seasonally adjusted |
| Q4 2023 | 15.5 | Census via FRED (ECOMPCTSA), seasonally adjusted |
| Q4 2024 | 16.2 | Census via FRED (ECOMPCTSA), seasonally adjusted |
| Q4 2025 | 16.7 | Census via FRED (ECOMPCTSA), seasonally adjusted |
| Q2 2026 | 17.1 | Census via FRED (ECOMPCTSA), seasonally adjusted |
- Growth. E-commerce sales were up 12.2% on a year earlier in the second quarter of 2026, while total retail sales were up 6.7%. Since late 2019, e-commerce dollars have grown about 126% ($150.2 billion to $340.2 billion, my calculation, not adjusted for inflation).
- Unadjusted view. Without seasonal adjustment Census reports $329.5 billion, or 16.4% of retail sales, for the same quarter.
- It will change. Census notes that as of September 28, 2026 the Q2 report no longer contains its most up-to-date estimates, and the revised numbers will appear with the next release on November 19, 2026. I’ll update this page then.
- Why it isn’t a shoe figure. It counts retailers’ e-commerce sales across every kind of business. Footwear can sit above or below the average, and no official source says which.
Are brands selling more shoes online?
Short answer. Not across the board. In their latest results Nike and Deckers (HOKA and UGG) leaned back toward retailers, while Crocs, On and adidas grew direct or e-commerce sales faster than wholesale.
Brands are the one group that does publish real channel numbers, so I read the latest results of five footwear companies. Pick one below to see what it reported. None of them splits out e-commerce cleanly, which I’ll come back to.
See what a brand reports
Choose a brand to see its latest channel numbers, exactly as its own results release or filing states them, and how to read them.
Select a brand above.
Nike, Fiscal 2026, year ended May 31, 2026. NIKE Direct revenue was $17.7 billion, down 6%. NIKE Brand Digital fell 12% and NIKE-owned stores fell 4%. Wholesale was $27.5 billion, up 6%. A year earlier NIKE Direct was $18.8 billion (down 13%, with Brand Digital down 20%). How to read it: Direct sales have fallen two years running and wholesale grew again. Nike Brand covers footwear, apparel and equipment, and the release gives no dollar figure for digital.
Deckers (HOKA, UGG), Fiscal 2026, year ended March 31, 2026. Direct-to-consumer net sales were $2.264 billion, up 6.3%, or 41.4% of net sales against 42.7% a year earlier. Wholesale was $3.208 billion, up 12.3%. How to read it: Wholesale grew about twice as fast as direct, so the direct share slipped. The release does not split DTC into e-commerce and stores.
Crocs, Second quarter 2026. Direct-to-consumer revenue was $655.4 million, up 12.0%, or 55.6% of revenue against 50.9% in Q2 2025. Wholesale was $524.1 million, down 7.2%. How to read it: Crocs leans the other way: direct is growing and wholesale shrinking. The release does not report e-commerce on its own, and direct includes company stores.
On, Second quarter 2026. Direct-to-consumer net sales were CHF 388.4 million, up 26.0% (34.3% in constant currency), and 45.7% of net sales. Wholesale was CHF 461.9 million, up 4.8%. How to read it: Direct grew faster than wholesale. The release does not separate online from On's own stores, and On now sells apparel as well as shoes.
adidas, Second quarter 2026, currency-neutral. E-commerce revenue rose 27%, own retail 23% and wholesale 6%. North America rose 17%. How to read it: Online grew faster than anything else, but the release gives no share of sales for e-commerce, and it covers apparel and accessories as well as shoes.
Nike’s pullback in numbers
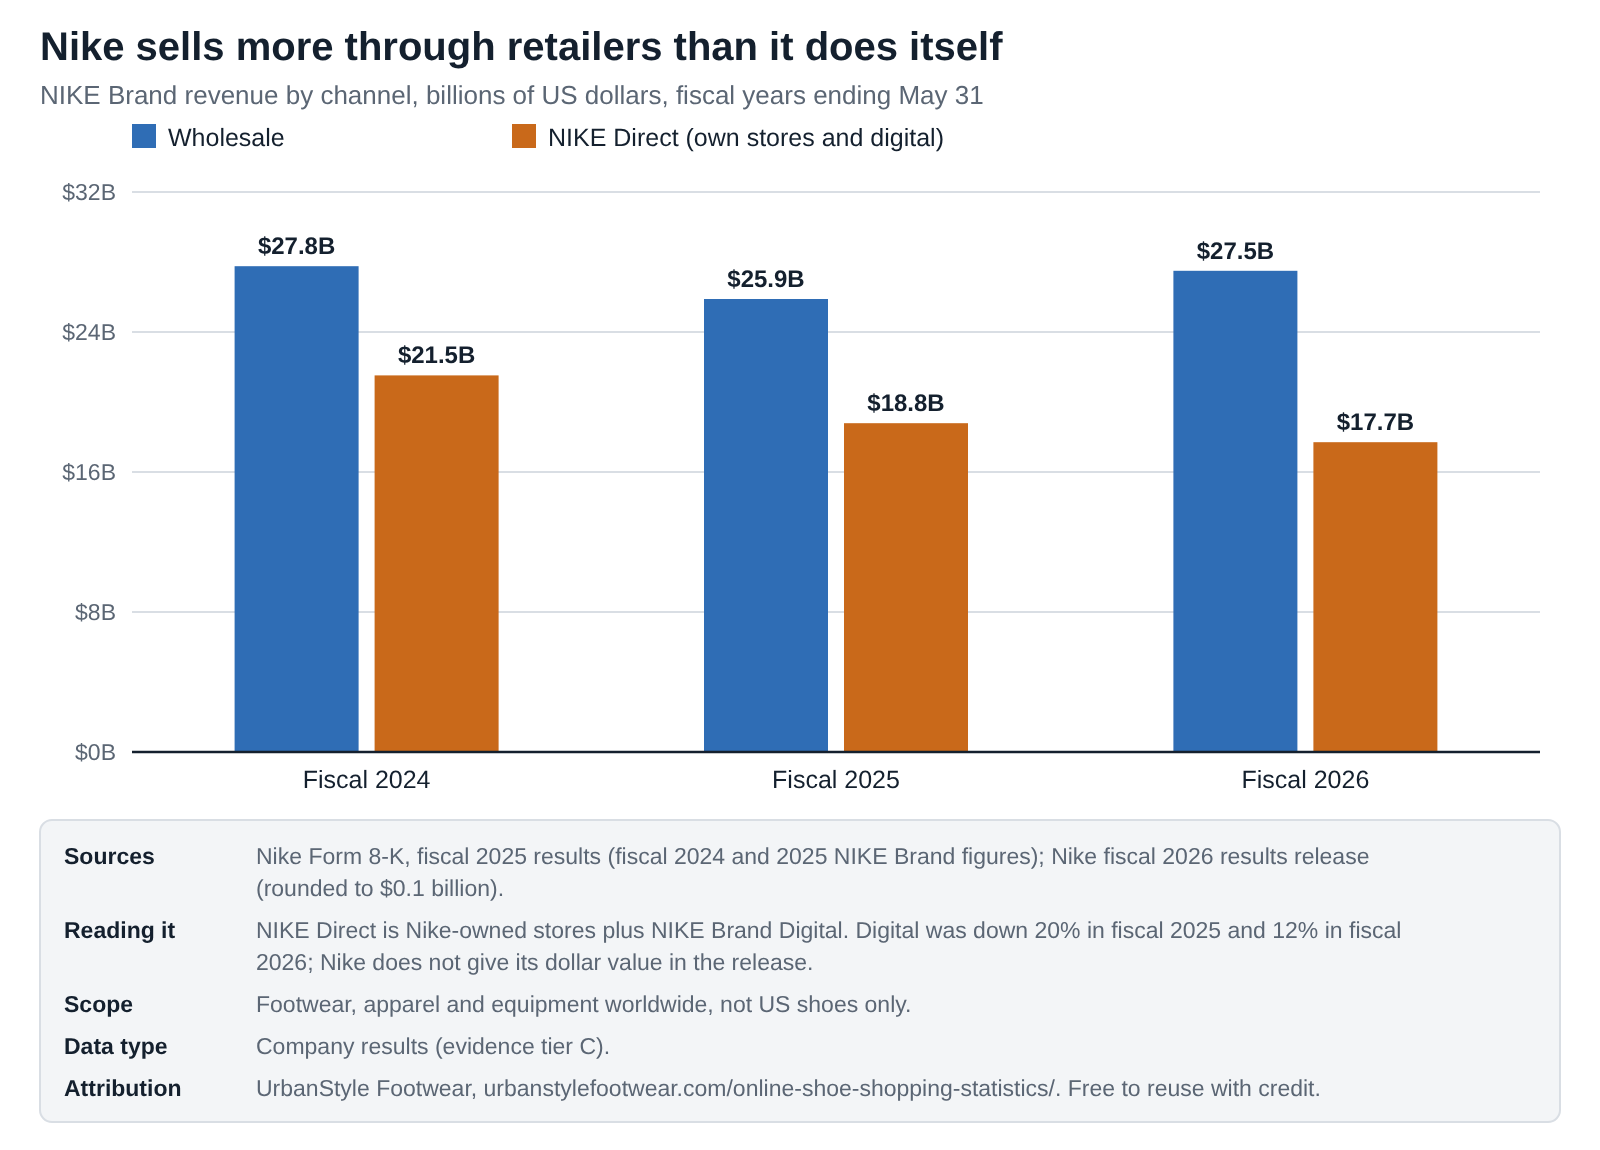
Nike is the clearest case. NIKE Direct, its own stores plus its own digital business, fell from $21.5 billion in fiscal 2024 to $17.7 billion in fiscal 2026, about 18% (my calculation; the 2026 figure is rounded). Nike says its digital business fell 20% in fiscal 2025 and 12% in fiscal 2026. Compounded, that is roughly 30% lower than two years earlier, assuming both figures are on the same basis. Over the same period wholesale went from $27.8 billion to $27.5 billion after dipping to $25.9 billion in between.
Embed this chart
<figure style="margin:0"><a href="https://urbanstylefootwear.com/online-shoe-shopping-statistics/"><img src="https://urbanstylefootwear.com/wp-content/uploads/2026/10/usf-nike-wholesale-vs-direct-fy2024-2026.png" alt="Grouped bar chart of Nike Brand revenue: wholesale 27.8, 25.9 and 27.5 billion dollars and NIKE Direct 21.5, 18.8 and 17.7 billion dollars in fiscal 2024, 2025 and 2026" width="800" style="max-width:100%;height:auto"></a><figcaption>Source: UrbanStyle Footwear, based on Nike filings and results release, fiscal 2024 to 2026. <a href="https://urbanstylefootwear.com/online-shoe-shopping-statistics/">Online Shoe Shopping Statistics 2026</a></figcaption></figure>Click the code, press Ctrl+C (Cmd+C on Mac), and paste it into any web page. Please keep the attribution link.
View as table
| Fiscal year | Wholesale (billion US dollars) | NIKE Direct (billion US dollars) | Source |
|---|---|---|---|
| Fiscal 2024 | 27.758 | 21.519 | Nike filing or release; fiscal 2026 rounded |
| Fiscal 2025 | 25.883 | 18.783 | Nike filing or release; fiscal 2026 rounded |
| Fiscal 2026 | 27.5 | 17.7 | Nike filing or release; fiscal 2026 rounded |
I wouldn’t read this as “people stopped buying Nike shoes online”. A fall in Nike’s own digital sales can mean purchases moved to a retailer’s website, and the release doesn’t say how much did. What it does show is that the brand with the biggest direct operation in footwear is now leaning on retailers again. Nike’s CFO, Matthew Friend, said in the June 30, 2026 release that the company is “investing in marketplace elevation”.
Direct is not the same as online
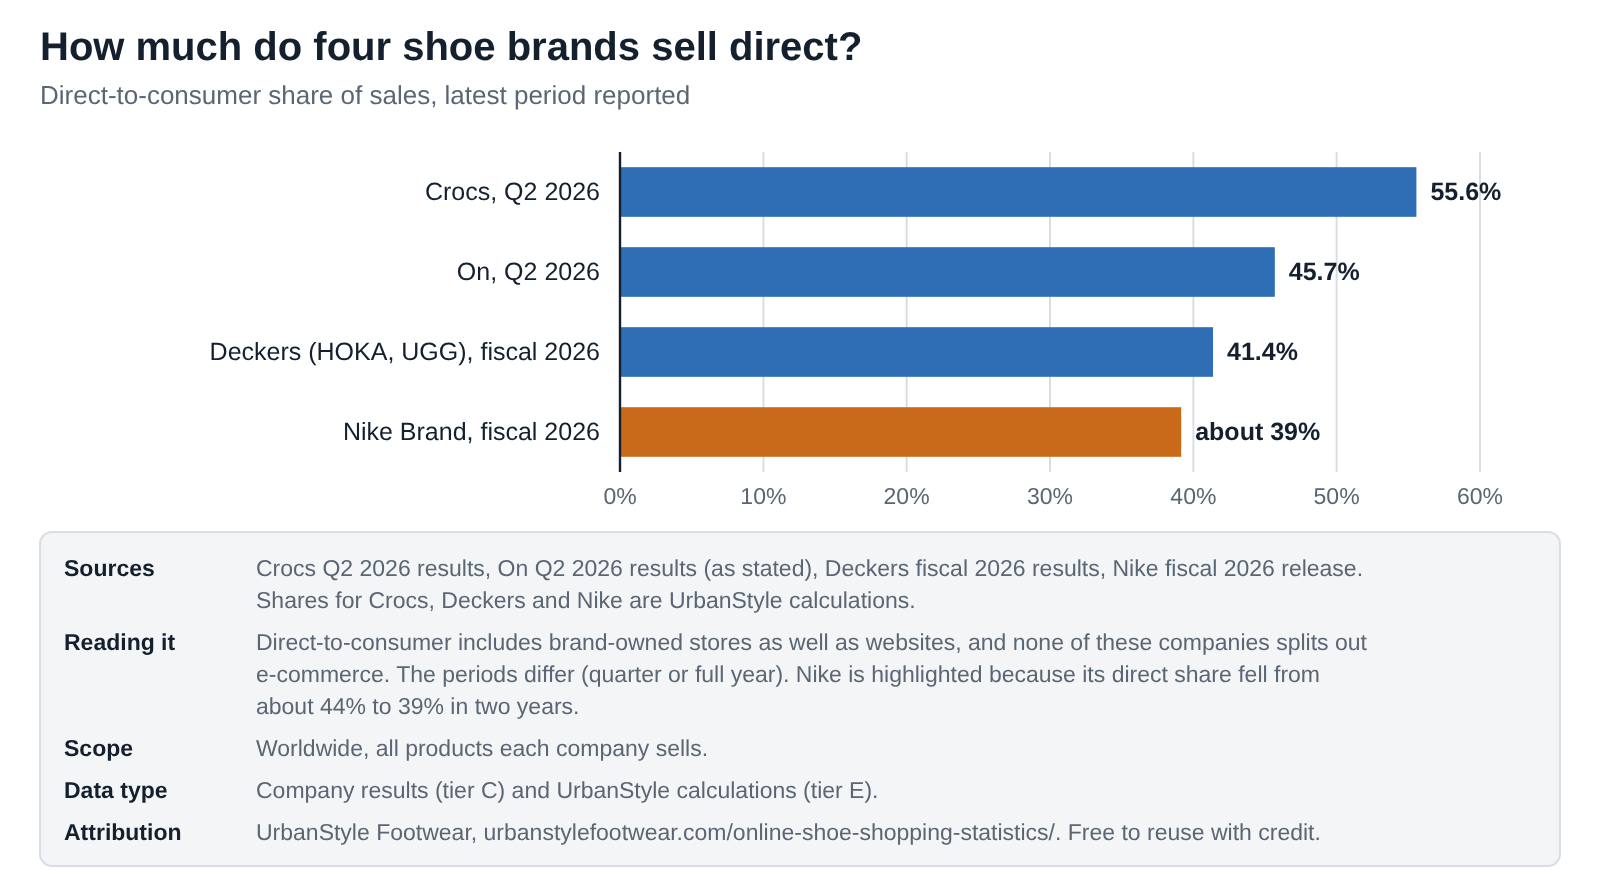
The four brands below report direct-to-consumer, or DTC, sales. That includes their own stores as well as their websites, and none of them says how much is online. So DTC is the most a brand’s own e-commerce could be, not a measure of it. The periods also differ, so don’t rank the brands by this chart alone.
Embed this chart
<figure style="margin:0"><a href="https://urbanstylefootwear.com/online-shoe-shopping-statistics/"><img src="https://urbanstylefootwear.com/wp-content/uploads/2026/10/usf-direct-to-consumer-share-four-shoe-brands-2026.png" alt="Bar chart of direct-to-consumer share of sales: Crocs 55.6 percent, On 45.7 percent, Deckers 41.4 percent and Nike Brand about 39 percent" width="800" style="max-width:100%;height:auto"></a><figcaption>Source: UrbanStyle Footwear, based on company results for Crocs, On, Deckers and Nike. <a href="https://urbanstylefootwear.com/online-shoe-shopping-statistics/">Online Shoe Shopping Statistics 2026</a></figcaption></figure>Click the code, press Ctrl+C (Cmd+C on Mac), and paste it into any web page. Please keep the attribution link.
View as table
| Company and period | Direct-to-consumer share (%) | Method | Source |
|---|---|---|---|
| Crocs, Q2 2026 | 55.6 | DTC revenue divided by total revenue (UrbanStyle calculation) | Crocs 8-K |
| On, Q2 2026 | 45.7 | As stated in the release | On 6-K |
| Deckers, fiscal 2026 | 41.4 | DTC divided by net sales (UrbanStyle calculation) | Deckers 8-K |
| Nike Brand, fiscal 2026 | 39.2 | NIKE Direct divided by wholesale plus NIKE Direct, rounded inputs (UrbanStyle calculation) | Nike release |
| Company | Period | What it reported | Tier |
|---|---|---|---|
| Nike | Fiscal 2026, year ended May 31, 2026 | NIKE Direct revenue was $17.7 billion, down 6%. NIKE Brand Digital fell 12% and NIKE-owned stores fell 4%. Wholesale was $27.5 billion, up 6%. A year earlier NIKE Direct was $18.8 billion (down 13%, with Brand Digital down 20%). | C |
| Deckers (HOKA, UGG) | Fiscal 2026, year ended March 31, 2026 | Direct-to-consumer net sales were $2.264 billion, up 6.3%, or 41.4% of net sales against 42.7% a year earlier. Wholesale was $3.208 billion, up 12.3%. | C |
| Crocs | Second quarter 2026 | Direct-to-consumer revenue was $655.4 million, up 12.0%, or 55.6% of revenue against 50.9% in Q2 2025. Wholesale was $524.1 million, down 7.2%. | C |
| On | Second quarter 2026 | Direct-to-consumer net sales were CHF 388.4 million, up 26.0% (34.3% in constant currency), and 45.7% of net sales. Wholesale was CHF 461.9 million, up 4.8%. | C |
| adidas | Second quarter 2026, currency-neutral | E-commerce revenue rose 27%, own retail 23% and wholesale 6%. North America rose 17%. | C |
Why do people still go to stores for shoes?
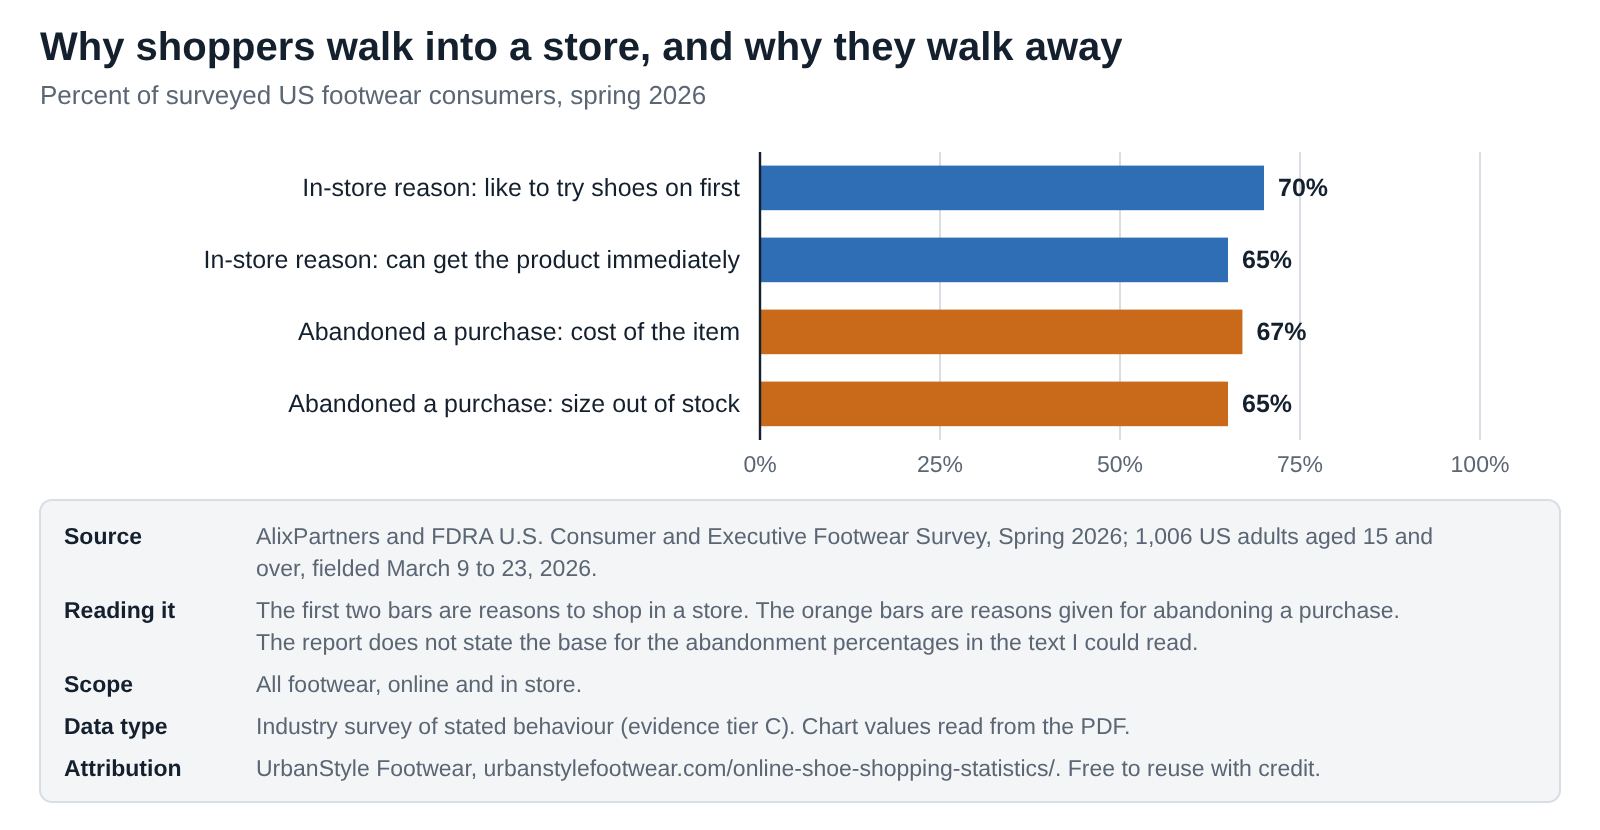
Short answer. To try them on and to have them today. In a spring 2026 survey of 1,006 US footwear consumers, 70% gave trying shoes on before buying as a reason to shop in a store and 65% gave getting the product immediately.
The most useful recent survey I found is the AlixPartners and FDRA footwear study fielded March 9 to 23, 2026. It’s a stated-reasons survey, so it tells you what people say rather than what they did, but the pattern is consistent. Fit is the sticking point, and fit is exactly what a screen can’t settle.
Embed this chart
<figure style="margin:0"><a href="https://urbanstylefootwear.com/online-shoe-shopping-statistics/"><img src="https://urbanstylefootwear.com/wp-content/uploads/2026/10/usf-why-shoppers-choose-stores-and-abandon-2026.png" alt="Bar chart of survey results: 70 percent like to try shoes on first, 65 percent want the product immediately, 67 percent cite item cost and 65 percent cite size out of stock as reasons to abandon a purchase" width="800" style="max-width:100%;height:auto"></a><figcaption>Source: UrbanStyle Footwear, based on AlixPartners and FDRA Spring 2026 footwear survey. <a href="https://urbanstylefootwear.com/online-shoe-shopping-statistics/">Online Shoe Shopping Statistics 2026</a></figcaption></figure>Click the code, press Ctrl+C (Cmd+C on Mac), and paste it into any web page. Please keep the attribution link.
View as table
| Reason | Share of respondents (%) | Source |
|---|---|---|
| In-store reason: like to try shoes on first | 70 | AlixPartners and FDRA, Spring 2026 |
| In-store reason: can get the product immediately | 65 | AlixPartners and FDRA, Spring 2026 |
| Abandoned a purchase: cost of the item | 67 | AlixPartners and FDRA, Spring 2026 |
| Abandoned a purchase: size out of stock | 65 | AlixPartners and FDRA, Spring 2026 |
- Stock matters. 65% cited their size being out of stock as a reason for abandoning a purchase, up 31 percentage points on the 2025 survey. Cost of the item was cited by 67%, down 11 points.
- Shoppers trust the old tools most. In the report’s ranking of fit tools, brand size charts scored highest (4.1) and AI-powered fit tools lowest (2.9). The report describes buying several sizes to return the extras as the least popular strategy.
- Stores are being used for home delivery. The report says more consumers want to order in a store and have it delivered, which is a hybrid that standard online-versus-store tallies miss.
- Preferences are split. YouGov Profiles data (August 2025 to August 2026) found 27% of US adults shop for clothes and shoes mostly or always online, 34% mostly or always offline and 34% about evenly. That is clothes and shoes together, and YouGov doesn’t report the sample size.
- Back-to-school. AlixPartners and FDRA’s June 2026 survey of more than 1,000 consumers described footwear sales as split evenly between online and in store, with athletic and athleisure spending expected to rise 11%.
Where do phones, Amazon and store pickup fit?
Short answer. I can only verify these for all of retail, not shoes. Adobe found 56.4% of US online holiday transactions in 2025 happened on a mobile device, up from 54.5%.
- Mobile. Adobe’s holiday recap covers November 1 to December 31, 2025, when US shoppers spent $257.8 billion online, up 6.8%. Adobe says 56.4% of online transactions took place on a mobile device, and it doesn’t say whether that includes tablets. An older guide gives 58.8% for global footwear in 2023 but doesn’t name its source, so I haven’t used it.
- Amazon. AlixPartners’ June 2026 release says Amazon grew its footwear reach but with lower spending per unit, and its spring report describes online-only retailers like Amazon as shoppers’ go-to place for buying shoes online. Neither gives Amazon’s share of footwear sales, and I haven’t found a verified one.
- Store pickup and ship-from-store. The channel is clearly growing in importance, but I didn’t find a shoe-specific figure I trust, so I’m not quoting one.
- Retailer rankings. The top-10 online shoe retailer lists I found use 2021 data. A ranking that old says little about 2026, so I’ve left it out.
What happens when online shoe orders come back?
Short answer. For all online retail, NRF and Happy Returns estimated that 19.3% of 2025 sales would be returned. There is no verified US figure for shoes alone.
Fit uncertainty is the common thread: it’s why shoppers want to try shoes on, why a missing size ends a sale, and why returns are a bigger deal online. I’ve put every published return rate I could find, with what each one actually measures, on a separate page: shoe return statistics. It also compares the return policies of six brands.
Who measures what
Online shoe sales can be counted in five different ways, and each source below does one of them. That’s the main reason the numbers don’t line up. Select a step to see what is counted and how I use it.
1Government retail statisticsUS Census Bureau quarterly e-commerce estimates; monthly retail trade
Counts online sales by retail firms across every product. Census does not split footwear, and its shoe-store series leaves out the online sales of companies that also run stores. It is the most reliable number on this page, and the least specific.
2National spending accountsBureau of Economic Analysis personal consumption expenditures on footwear
Measures what households spent on footwear in total, from all kinds of sellers. There is no channel split, so I use it as the yardstick for sanity-checking other figures.
3Company resultsNike, Deckers, Crocs, On and adidas filings and releases
Each brand reports its own sales by channel. Useful for direction, but “direct-to-consumer” includes stores, definitions differ, and no company covers the whole market.
4Market-research estimatesStatista, IMARC Group and ECDB
Modelled estimates of the online share and online sales. Their public pages give the headline numbers but not the full method, so I can’t verify them and they disagree by more than double in dollars.
5Consumer surveysAlixPartners and FDRA, YouGov
Ask people where and why they shop. People report intentions and recall, and a survey of back-to-school shoppers is not a count of sales.
What I’m watching next
I don’t forecast. These are the releases that would change this page, and what I’ll do when they land.
- Census, November 19, 2026. The third-quarter e-commerce release, which will carry revised numbers for earlier quarters. I’ll update the charts and every figure that depends on them.
- Nike’s next results. Nike reports its fiscal second quarter in December, usually. I want to see whether digital keeps falling and wholesale keeps growing.
- NRF’s 2026 returns report. Last year’s came out on October 15, 2025. It would update the 19.3% online return figure I mention above.
- Holiday data. Adobe and others publish online holiday figures early in the new year.
- A real footwear number. A shoe-only online share from sales records, with a stated method, would settle most of this page. If you publish or know of one, email me.
Every change goes in the freshness log.
Where other online shoe statistics articles go wrong
I read several of the pages that rank for this topic before writing. They’re a useful starting point, and they share some habits I tried to avoid.
- Problem 1They quote an online share without saying what it measures, or credit a paywalled forecast nobody can open.
- Problem 2They sometimes mix global and US figures without saying which is which.
- Problem 3They lean on old numbers. The only retailer ranking I found is 2021 data.
- Problem 4They don’t date the figures, so you can’t tell whether you’re reading 2021 or 2026.
- Problem 5They use the all-retail e-commerce share as if it described shoes.
- Problem 6They treat a brand’s direct-to-consumer sales as its online sales.
- Problem 7They quote survey intentions as if they were sales.
- Problem 8They give false precision, such as 31.2%, for a number that’s really “somewhere around a third”.
- Problem 9They read a fall in one brand’s own digital sales as a fall in online shoe buying.
If you’re buying shoes online
This is practical advice, separate from the research above. The survey reasons point to the same thing: the risk with online shoes is fit, so spend your effort there.
- Measure first. My foot measuring guide takes a few minutes, and the size conversion calculator helps if you’re moving between brands or countries. My shoe size statistics explain why sizes differ.
- Use the brand’s own size chart. In the spring 2026 survey, brand size charts ranked highest among fit tools. That matches what I’d tell a friend.
- Check the return policy before you pay. Windows run from 30 to 90 days across the six brands I checked, and wear rules differ. The return statistics page has a side-by-side.
- Try them on indoors. If the policy says unworn, test on a clean floor and keep the packaging.
- Buy in a store if you can. If your size is in stock locally, you skip the shipping and the return. If it isn’t, ordering in the store and having it delivered is a real option.
- Compare before you buy. See New Balance vs Brooks vs Hoka, the best running shoes under $100 and Prime Day shoe deals. For price context, see my US footwear market statistics.
Sources and evidence tiers
Evidence hierarchy
- APeer-reviewed research. Original data in a peer-reviewed journal. I found none on the online share of shoe sales and none is cited here.
- BOfficial statistics. Census Bureau and Bureau of Economic Analysis data. The strongest evidence on this page, though none of it is shoe-specific online data.
- CIndustry research, surveys and company statements. Company results, AlixPartners and FDRA, YouGov, Adobe and NRF. Useful, but the publisher may have a commercial interest.
- DSecondary reporting. Articles that cite a forecast or report I couldn’t open myself, such as the Statista figure.
- EEstimates and calculations. My own arithmetic and comparisons, with the method stated.
Primary versus secondary data
Primary source: the organisation that collected or published the data, or a company reporting its own results. Secondary source: an article summarising someone else’s data. Where I could only read a secondary source, the table says so.
Source table
| Source | Year | Sample | Geography | Finding used | Tier | Series ID | Primary source |
|---|---|---|---|---|---|---|---|
| US Census Bureau, Quarterly Retail E-Commerce Sales, 2nd Quarter 2026 (release CB26-133, August 18, 2026; page notes later revisions) | 2026 | Monthly and quarterly retail sales survey of employer firms in retail, all products | United States | E-commerce sales of $340.2 billion in Q2 2026, 17.1% of total retail (seasonally adjusted), up 12.2% on Q2 2025 against 6.7% for total retail | B | Release CB26-133 | Census e-commerce page |
| US Census Bureau, E-Commerce Retail Sales as a Percent of Total Sales and E-Commerce Retail Sales, read through FRED | 2026 | Quarterly series, seasonally adjusted, all retail | United States | E-commerce share of retail: 11.2% (Q4 2019), 16.3% (Q2 2020), 16.7% (Q4 2025), 17.0% (Q1 2026), 17.1% (Q2 2026); e-commerce sales of $150.2 billion in Q4 2019 and $340.2 billion in Q2 2026 | B | FRED series ECOMPCTSA and ECOMSA (updated Aug 18, 2026) | FRED series page |
| US Census Bureau statement on how it categorizes e-commerce sales in its retail sales data sets (2016) | 2016 | Agency explanation of classification rules | United States | Online sales by the e-commerce division of a company with stores are tabulated in electronic shopping and mail-order houses (NAICS 4541), not in the kind of store | B | Statement CB16-RTQ03 | Census statement |
| US Bureau of Economic Analysis, Personal consumption expenditures: Footwear (NIPA Table 2.5.5), read through FRED | 2025 | National accounts estimate, annual, current dollars | United States | Household spending on footwear: $121.150 billion in 2025 | B | FRED series DFTWRC1A027NBEA (updated Sept 30, 2026) | FRED series page |
| US Census Bureau, Monthly Retail Trade: Shoe stores (NAICS 4482), read through FRED | 2026 | Monthly retail sales of shoe-store establishments, not seasonally adjusted | United States | Shoe-store sales summed to $38.72 billion for 2025 (UrbanStyle sum of 12 months) | B | FRED series MRTSSM4482USN (updated Sept 16, 2026) | FRED series page |
| AlixPartners and FDRA, U.S. Consumer and Executive Footwear Survey, Spring 2026 (report PDF) | 2026 | Online consumer survey of 1,006 US adult footwear consumers aged 15 and over, March 9 to 23, 2026, described as nationally representative; plus an FDRA executive survey of nearly 100 people | United States | 70% like to try shoes on before buying and 65% want the product immediately (reasons to buy in store); size out of stock (65%) and item cost (67%) as reasons for abandoning a purchase; brand size charts rank first among fit tools and AI fit tools last | C | n/a | Spring 2026 report (PDF) |
| AlixPartners and FDRA, 2026 back-to-school footwear survey, press release | 2026 | Online survey of more than 1,000 US consumers aged 15 and over who intend to shop for back-to-school footwear, fielded June 2026 | United States | Back-to-school footwear sales split evenly between in-store and online; Amazon grew its reach with lower spend per unit; athletic and athleisure spending expected up 11% | C | n/a | AlixPartners press release |
| YouGov, "Online or in store? How fashion shopping habits vary across US states" (September 30, 2026), data from YouGov Profiles | 2026 | US adults in YouGov Profiles, August 2025 to August 2026; sample size not reported; clothes and shoes combined | United States | 27% shop for clothes and shoes mostly or always online, 34% mostly or always offline, 34% about evenly across both | C | n/a | YouGov article |
| Adobe, 2025 Holiday Shopping Recap (online spending, November 1 to December 31, 2025) | 2025 | Adobe Analytics data on online transactions at US retail sites, all products | United States | Online holiday spend of $257.8 billion, up 6.8%; 56.4% of online transactions on a mobile device, up from 54.5% | C | n/a | Adobe recap (PDF) |
| NIKE, Inc., "NIKE, Inc. Reports Fiscal 2026 Fourth Quarter and Full Year Results" (June 30, 2026) | 2026 | Company results release, year ended May 31, 2026; footwear, apparel and equipment | Global | NIKE Direct revenue of $17.7 billion, down 6%, with NIKE Brand Digital down 12% and NIKE-owned stores down 4%; wholesale $27.5 billion, up 6% | C | n/a | Nike release |
| NIKE, Inc., Form 8-K, fiscal 2025 fourth quarter and full year results (Exhibit 99.1, June 2025) | 2025 | Company results filing, year ended May 31, 2025, with supplemental NIKE Brand revenue table | Global | NIKE Brand revenue by channel: wholesale $25,883M and NIKE Direct $18,783M in fiscal 2025 against $27,758M and $21,519M in fiscal 2024; NIKE Brand Digital down 20% in fiscal 2025 | C | Form 8-K, Exhibit 99.1 | Nike 8-K |
| Deckers Brands, "Reports Fourth Quarter and Full Fiscal Year 2026 Financial Results" (May 21, 2026, Form 8-K Exhibit 99.1) | 2026 | Company results filing, year ended March 31, 2026; HOKA, UGG and other brands | Global | Wholesale $3.208 billion (up 12.3%), direct-to-consumer $2.264 billion (up 6.3%), total net sales $5.472 billion; DTC not split into e-commerce and stores | C | Form 8-K, Exhibit 99.1 | Deckers 8-K |
| Crocs, Inc., second quarter 2026 results press release (Form 8-K) | 2026 | Company results filing, quarter ended June 30, 2026; Crocs and HEYDUDE brands | Global | Direct-to-consumer revenue of $655.4 million (up 12.0%) against wholesale of $524.1 million (down 7.2%) on total revenue of $1,179.5 million | C | Form 8-K, press release | Crocs 8-K |
| On Holding AG, results for the second quarter and six-month period ended June 30, 2026 (Form 6-K, Exhibit 99.3) | 2026 | Company results filing, quarter ended June 30, 2026; footwear, apparel and accessories | Global | DTC net sales of CHF 388.4 million (up 26.0%, 34.3% constant currency), 45.7% of net sales of CHF 850.3 million; wholesale CHF 461.9 million (up 4.8%) | C | Form 6-K, Exhibit 99.3 | On 6-K |
| adidas AG, ad hoc release "adidas grows top line 14% and achieves record sales in Q2" (July 30, 2026), as published through EQS | 2026 | Company ad hoc announcement, second quarter 2026; footwear, apparel and accessories | Global | Currency-neutral e-commerce revenue up 27%, own retail up 23%, wholesale up 6% in Q2 2026; North America up 17% | C | EQS ad hoc release | adidas release (EQS copy) |
| National Retail Federation and Happy Returns (a UPS company), "Consumers Expected to Return Nearly $850 Billion in Merchandise in 2025" (press release, Oct 15, 2025) | 2025 | Retailer survey of 358 e-commerce professionals at US merchants with over $500 million in revenue; consumer survey of 2,006 people | United States | Retailers estimated that 19.3% of online sales would be returned in 2025 (all retail, not footwear) | C | n/a | NRF press release |
| RunRepeat, "Online Shoe Sales Statistics" (published Aug 23, 2023, updated Sep 14, 2023) | 2023 | Statistics article; sources listed in a general section but not tied to individual figures | Global | Online share of the 2023 footwear market of 31.2% (35% in 2021) with global online sales of $113.04 billion; mobile 58.8% of online footwear sales | D | n/a | RunRepeat article |
| ERASERS, "Footwear Industry Statistics and Data to Know in 2026" (article dated June 19, 2026) | 2026 | Statistics article citing Statista Market Forecast for online share and revenue | United States | US footwear e-commerce share of 30% to 35% and about $74.5 billion in 2025, attributed to Statista | D | n/a | ERASERS article |
| IMARC Group, "United States Footwear Market" (public report page, last updated September 29, 2026) | 2026 | Market research report page; the public page does not describe its estimation method | United States | US footwear market of USD 97.16 billion in 2025, with online sales the largest channel at a 36% share (other channels shown without shares) | C | n/a | IMARC report page |
| ECDB, "Shoes Industry in the US" (public sample-data page, copyright 2026, data through September 2026) | 2026 | E-commerce market intelligence vendor; the public page gives a short definition of online share but not a full method | United States | US footwear e-commerce revenue of USD 76.885 billion in 2025 and an online share of 25% to 30% | C | n/a | ECDB page |
| UrbanStyle Footwear calculations from the sources above | 2026 | Arithmetic on published figures; method stated beside each | United States | Derived changes, shares and ranges | E | n/a | Methodology |
Methodology and limitations
How I built this page. I started with official statistics, then company filings, then survey publishers’ own reports, and only then articles. For each figure I recorded the source, date, sample and what kind of evidence it is, and I opened the original wherever it was open to me. Where I calculated something, such as a share, a sum or a change, it’s labelled E and the method is in the dataset. I read the Census, FRED, SEC and company pages on October 9, 2026.
What I left out. I didn’t use a top-10 online shoe retailer ranking (2021 data), a global mobile share with no named source, any online share I couldn’t tie to a named source, or figures from a July 2026 AlixPartners data pack that carries a note asking not to be quoted outside internal use. I relied on the firm’s public press release and its spring report instead.
Limitations you should know about
- There is no official shoe-only online share. Everything about shoes specifically comes from companies, surveys and forecasts.
- I couldn’t read the Statista, ECDB or IMARC methods. I read IMARC’s and ECDB’s public pages, which give the figures but not how they were produced. The Statista figure is as cited by an article, because its forecast is behind a paywall.
- Census figures are first estimates. Census notes that its Q2 report no longer has the most up-to-date estimates as of September 28, 2026. The Q2 2026 numbers here are as first released on August 18.
- Company figures aren’t comparable. Periods differ, currencies differ (On reports in Swiss francs), each company defines direct-to-consumer its own way, and all of them also sell apparel or accessories.
- Calculated shares use rounded inputs. Nike’s fiscal 2026 figures are rounded to $0.1 billion in the release, so its direct share of about 39% is approximate.
- The survey percentages come from stated answers. The AlixPartners and FDRA chart values were read from a PDF, and the report doesn’t state the base for the abandonment percentages in the text I could read.
- The YouGov figure combines clothes and shoes and doesn’t report its sample size.
Data freshness
| Date | Change |
|---|---|
| October 9, 2026 | First publication. Data read from the Census Bureau, BEA, five company results releases and filings, AlixPartners and FDRA, YouGov, Adobe and NRF, public pages from IMARC and ECDB, and two articles with the shares they quote. Downloadable dataset, charts and calculations with stated methods. |
| November 19, 2026 | Planned update when Census publishes its third-quarter 2026 e-commerce release and revisions. |
| January 2027 | Next scheduled full review. |
Last full source review: October 9, 2026. Next scheduled review: January 2027.
Corrections. If you spot an error or have better data, email info@urbanstylefootwear.com with the subject “Data correction”. I’ll check it and note any change in the table above. How I test and review products is explained in our methodology.
For journalists and researchers
You can use the statistics and charts on this page with credit to UrbanStyle Footwear. Wherever you can, please cite the original source printed with each statistic. My own calculations are marked tier E and can be cited to me.
A sentence you can use. “The US Census Bureau does not publish a shoe-specific online share; it estimated that 17.1% of all US retail sales were online in the second quarter of 2026. Industry estimates put footwear at roughly 25% to 36%, but the methods are not public.” (Source: Census Bureau; UrbanStyle Footwear)
Media kit
All figures with value, unit, geography, segment, basis, period, source and evidence tier.
Six charts with source, scope and data type printed on each image. SVG versions are under each chart above.
The 15 citable statistics on one printable PDF.
Every source with year, sample, geography, tier, series ID and link.
Ready-made citations below. Media and research enquiries go to info@urbanstylefootwear.com.
Cite this page
Suggested citation
UrbanStyle Footwear. “Online Shoe Shopping Statistics 2026: How Much Footwear Is Really Bought Online?.” Updated October 9, 2026. https://urbanstylefootwear.com/online-shoe-shopping-statistics/
APA style
Vahith, A. (2026, October 9). Online shoe shopping statistics 2026: How much footwear is really bought online? UrbanStyle Footwear. https://urbanstylefootwear.com/online-shoe-shopping-statistics/
Link (HTML)
<a href="https://urbanstylefootwear.com/online-shoe-shopping-statistics/">Online Shoe Shopping Statistics 2026 by UrbanStyle Footwear</a>Click any citation, then press Ctrl+C (Cmd+C on Mac) to copy it.
For individual statistics, UrbanStyle recommends citing the original source listed in the source table whenever possible.
Data requests. Data correction or dataset request: info@urbanstylefootwear.com
Frequently asked questions
What percentage of shoes are bought online?
There is no official US figure. The Census Bureau says 17.1% of all US retail sales were online in the second quarter of 2026. Industry sources put footwear at 25% to 36% for 2025 (ECDB, Statista and IMARC), but none shows its method on the public page. A June 2026 AlixPartners survey found back-to-school shoe sales split evenly between online and in store. If you need one phrase, “roughly a third, by industry estimates” is fair.
How big is online shoe shopping in the US?
Nobody publishes an official dollar figure. Three industry estimates for 2025 disagree by more than double: about $35.0 billion (IMARC’s 36% share of its $97.16 billion market, my calculation), $74.5 billion (Statista, as cited by ERASERS) and $76.9 billion (ECDB). They define the market differently, and the larger two imply a total footwear market of well over $200 billion against the $121.15 billion the Bureau of Economic Analysis measures. See the comparison.
Is online shoe shopping growing?
US e-commerce overall is growing faster than retail as a whole (up 12.2% against 6.7% in the second quarter of 2026). For shoes specifically the brand data points both ways: Nike’s direct sales fell for a second year while adidas e-commerce rose 27% in the second quarter. See what brands report.
Do people prefer buying shoes online or in store?
It depends on who you ask and how. In a spring 2026 survey, 70% said they like to try shoes on before buying, a reason to shop in a store. YouGov found 27% of US adults shop for clothes and shoes mostly online and 34% mostly offline, with 34% splitting evenly. See why people still go to stores.
What share of online shoe shopping happens on a phone?
There is no shoe-specific US figure that I could verify. Across all US retail, Adobe found that 56.4% of online transactions in the 2025 holiday season took place on a mobile device, up from 54.5% in 2024. An older guide gives 58.8% for footwear in 2023 without naming a source.
Why do shoppers abandon online shoe purchases?
In AlixPartners and FDRA’s spring 2026 survey, 67% cited the cost of the item and 65% said their size was out of stock, up 31 percentage points on 2025. The report does not make the base of those percentages clear in the text I could read, so treat them as directional.
How much of online shoe shopping ends in a return?
There is no verified US shoe-only rate. For all online retail, NRF and Happy Returns estimated 19.3% for 2025. My shoe return statistics page compares every published figure I could find.
Why do different websites give different online shoe shopping statistics?
They measure different things in different years: all retail or shoes, the US or the world, sales or survey intentions, a market or one company. Some figures also come from paywalled forecasts that cannot be checked. My comparison table shows what each number covers.
Are Nike and other brands selling more shoes online?
Not uniformly. In its 2026 fiscal year Nike’s direct revenue fell 6% with its digital business down 12%, while wholesale grew 6%. Crocs, On and adidas grew their direct or e-commerce sales faster than wholesale in the second quarter of 2026. Companies define direct sales differently, so I show them side by side rather than adding them up.
Is the Census Bureau figure for e-commerce about shoes?
No. It covers all retail e-commerce, from electronics to groceries. Census does publish monthly sales of shoe stores, but in 2016 it said the online sales of companies that also run stores are tabulated in a separate e-commerce industry, so that series cannot be used to work out an online share.
Which online shoe retailers are the biggest?
I could not find a current, verifiable ranking. The rankings that circulate come from 2021 Statista data, so I have not repeated them. If you need one, look for a dated source and check whether it is global or US.
Where do you get these numbers?
From the Census Bureau and BEA, company results filings, survey publishers’ own reports and press releases, and a handful of articles I flag as secondary. Every statistic has its source, year and an evidence tier in the source table.
What is the difference between direct-to-consumer and online sales?
Direct-to-consumer, or DTC, means a brand sells to shoppers itself, through its own website and apps but also usually through its own stores. Online sales are sales made on a website or app, whether it belongs to the brand or a retailer such as Amazon. Most company reports give DTC and do not split it, so DTC is a ceiling for a brand’s own e-commerce, not a measure of it.
How often is this page updated?
I last checked every source on October 9, 2026, and I plan to review the page again in January 2027, or sooner when the Census Bureau publishes its next quarterly e-commerce release on November 19, 2026. Changes are listed in the freshness log.
Can I use this data in my article?
Yes, with credit to UrbanStyle Footwear, and cite the original source for any single statistic where you can. The dataset, charts and a printable list of key statistics are in the media kit, with citation formats.