
A sourced, evidence-graded look at what is actually known about foot size, shoe size and fit, with the data free to download and cite.
The measured picture in one ruler. Select a marker to see which group it describes.
Select a marker above, for example 270, to see which group it describes.
235 mm class (232.5 to 237.5 mm). Most common foot-length class for women in Asia (10,733 women scanned). Source: Jurca et al., 2019. This is foot length, not shoe size.
245 mm class (242.5 to 247.5 mm). Most common foot-length class for women in North America (610,675 scanned) and Europe (31,470 scanned). Source: Jurca et al., 2019. This is foot length, not shoe size.
255 mm class (252.5 to 257.5 mm). Most common foot-length class for men in Asia (10,072 men scanned). Source: Jurca et al., 2019. This is foot length, not shoe size.
270 mm class (267.5 to 272.5 mm). Most common foot-length class for men in North America (494,833 scanned) and Europe (43,064 scanned). Source: Jurca et al., 2019. This is foot length, not shoe size.
Find your foot-length class
Measure your longer foot in millimetres and round to the nearest 5 mm. Classes with a yellow edge are the most common class for a group in the study.
Data: Jurca et al., Scientific Reports, 2019. Classes are 5 mm wide. A foot-length class is not a shoe size. How to measure your foot at home or try the conversion calculator.
Shoe size research at a glance
Quick answer. No government agency measures the average US shoe size, so every “average shoe size” you see online is either an industry convention or an estimate. The most repeated figures are about US 10 to 10.5 for men and about US 8.5 for women. The best measured evidence we found, a study of 1.2 million 3D foot scans, reports foot lengths rather than shoe sizes: the most common adult foot-length class among North American shoppers was 270 mm for men and 245 mm for women. Our own estimate (explained below, and not a study result) is that these may correspond to roughly men’s US 10 and women’s US 8.5.
This page collects the shoe size and foot size data we could trace to a real source, says what kind of evidence each number is, and leaves out the figures we could not trace. If you only need your own size, skip to what this means for shoppers or use our shoe size conversion calculator.
Key findings
- There is no official US national dataset of average shoe size.
- The strongest large-scale measured evidence comes from 1.2 million 3D foot scans, and it measures foot length, not shoe size.
- Foot length and shoe size are not interchangeable. Sizing system, brand last, style and width all sit between them.
- Foot width varies substantially even among people with the same foot length: a 15.8 mm span for the middle 90% of men at 270 mm.
- A large share of participants in published studies (63% to 72%) wore shoes that did not fit their feet. Study definitions of fit vary.
- Shoe labels do not consistently match the same foot dimensions. In one analysis only 60% of US 9 medium women’s running styles fitted as labelled.
- Country-level “average shoe size” tables are weaker than regional measured data, and the popular ones contradict each other.
What we know and what we do not know
Research integrity starts with saying where the evidence stops. This is the state of the public evidence as of October 2026.
| Question | Evidence status | Why |
|---|---|---|
| Average US foot length | Strong measured evidence | Large scan study, but shoppers in stores with scanners, not a random sample |
| Foot width variation | Strong measured evidence | Same study, width reported within each length class |
| Percentage wearing incorrectly fitted shoes | Strong review, definitions vary | 18 studies used different definitions of a good fit |
| US sizing in 2026: size availability | Industry survey | One nationally representative online survey, commissioned by industry |
| Average US shoe size | No official dataset | No federal survey records shoe size |
| Most common US shoe size | Insufficient public data | No published sales dataset |
| Average shoe size by country | Limited and inconsistent | Online tables disagree and name no dataset |
| Historical change in shoe size | Weak and inconsistent | Claims trace back to media or museum articles, not datasets |
| Shoe returns caused specifically by size | Insufficient independent data | Only return rates by channel, not reasons |
15 shoe size statistics you can cite
Each card gives a number, a one-sentence explanation and its source. “Copy” puts the sentence, the source and a link back to this page on your clipboard. For any single statistic, please cite the original source listed on the card.
The largest published foot-scan study analysed 1,200,847 barefoot 3D scans from 712 shoe stores in North America, Europe and Asia.
Copy text
1,200,847 foot scans: The largest published foot-scan study analysed 1,200,847 barefoot 3D scans from 712 shoe stores in North America, Europe and Asia. Source: Jurca et al., 2019 (DOI 10.1038/s41598-019-55432-z | PMID 31844106). Via UrbanStyle Footwear: https://urbanstylefootwear.com/shoe-size-statistics/
The most common adult male foot-length class among scanned North American shoppers was 270 mm. This is foot length, not shoe size.
Copy text
270 mm men, North America: The most common adult male foot-length class among scanned North American shoppers was 270 mm. This is foot length, not shoe size. Source: Jurca et al., 2019 (DOI 10.1038/s41598-019-55432-z | PMID 31844106). Via UrbanStyle Footwear: https://urbanstylefootwear.com/shoe-size-statistics/
The most common adult female foot-length class among scanned North American shoppers was 245 mm.
Copy text
245 mm women, North America: The most common adult female foot-length class among scanned North American shoppers was 245 mm. Source: Jurca et al., 2019 (DOI 10.1038/s41598-019-55432-z | PMID 31844106). Via UrbanStyle Footwear: https://urbanstylefootwear.com/shoe-size-statistics/
In the Asian scans the most common length classes were 255 mm for men and 235 mm for women.
Copy text
255 mm and 235 mm men and women, Asia: In the Asian scans the most common length classes were 255 mm for men and 235 mm for women. Source: Jurca et al., 2019 (DOI 10.1038/s41598-019-55432-z | PMID 31844106). Via UrbanStyle Footwear: https://urbanstylefootwear.com/shoe-size-statistics/
The middle 90% of North American men with a 270 mm foot differed by 15.8 mm in foot width.
Copy text
15.8 mm width span: The middle 90% of North American men with a 270 mm foot differed by 15.8 mm in foot width. Source: Jurca et al., 2019 (DOI 10.1038/s41598-019-55432-z | PMID 31844106). Via UrbanStyle Footwear: https://urbanstylefootwear.com/shoe-size-statistics/
No single shoe width fitted more than 40.1% of North American men in the 270 mm length class.
Copy text
40.1% one width: No single shoe width fitted more than 40.1% of North American men in the 270 mm length class. Source: Jurca et al., 2019 (DOI 10.1038/s41598-019-55432-z | PMID 31844106). Via UrbanStyle Footwear: https://urbanstylefootwear.com/shoe-size-statistics/
The authors state that one shoe width increment in the US sizing system is 4.76 mm.
Copy text
4.76 mm US width step: The authors state that one shoe width increment in the US sizing system is 4.76 mm. Source: Jurca et al., 2019 (DOI 10.1038/s41598-019-55432-z | PMID 31844106). Via UrbanStyle Footwear: https://urbanstylefootwear.com/shoe-size-statistics/
At least three shoe widths per length size were needed to fit 90% of customers in that group.
Copy text
3 widths minimum: At least three shoe widths per length size were needed to fit 90% of customers in that group. Source: Jurca et al., 2019 (DOI 10.1038/s41598-019-55432-z | PMID 31844106). Via UrbanStyle Footwear: https://urbanstylefootwear.com/shoe-size-statistics/
Across 18 studies (3,205 participants), 63% to 72% wore shoes that did not accommodate the length or width of their feet.
Copy text
63% to 72% wore ill-fitting shoes: Across 18 studies (3,205 participants), 63% to 72% wore shoes that did not accommodate the length or width of their feet. Source: Buldt and Menz, 2018 (DOI 10.1186/s13047-018-0284-z). Via UrbanStyle Footwear: https://urbanstylefootwear.com/shoe-size-statistics/
In a 1993 survey of 356 women, 88% wore shoes smaller than their feet, by 1.2 cm on average.
Copy text
88% women, 1993: In a 1993 survey of 356 women, 88% wore shoes smaller than their feet, by 1.2 cm on average. Source: Frey et al., 1993 (PMID 8454237). Via UrbanStyle Footwear: https://urbanstylefootwear.com/shoe-size-statistics/
Of 841 women's running styles labelled US 9 medium, 60% fitted as a true US 9 medium.
Copy text
60% true to label: Of 841 women's running styles labelled US 9 medium, 60% fitted as a true US 9 medium. Source: Jurca and Dzeroski, 2021 (DOI 10.15221/21.51). Via UrbanStyle Footwear: https://urbanstylefootwear.com/shoe-size-statistics/
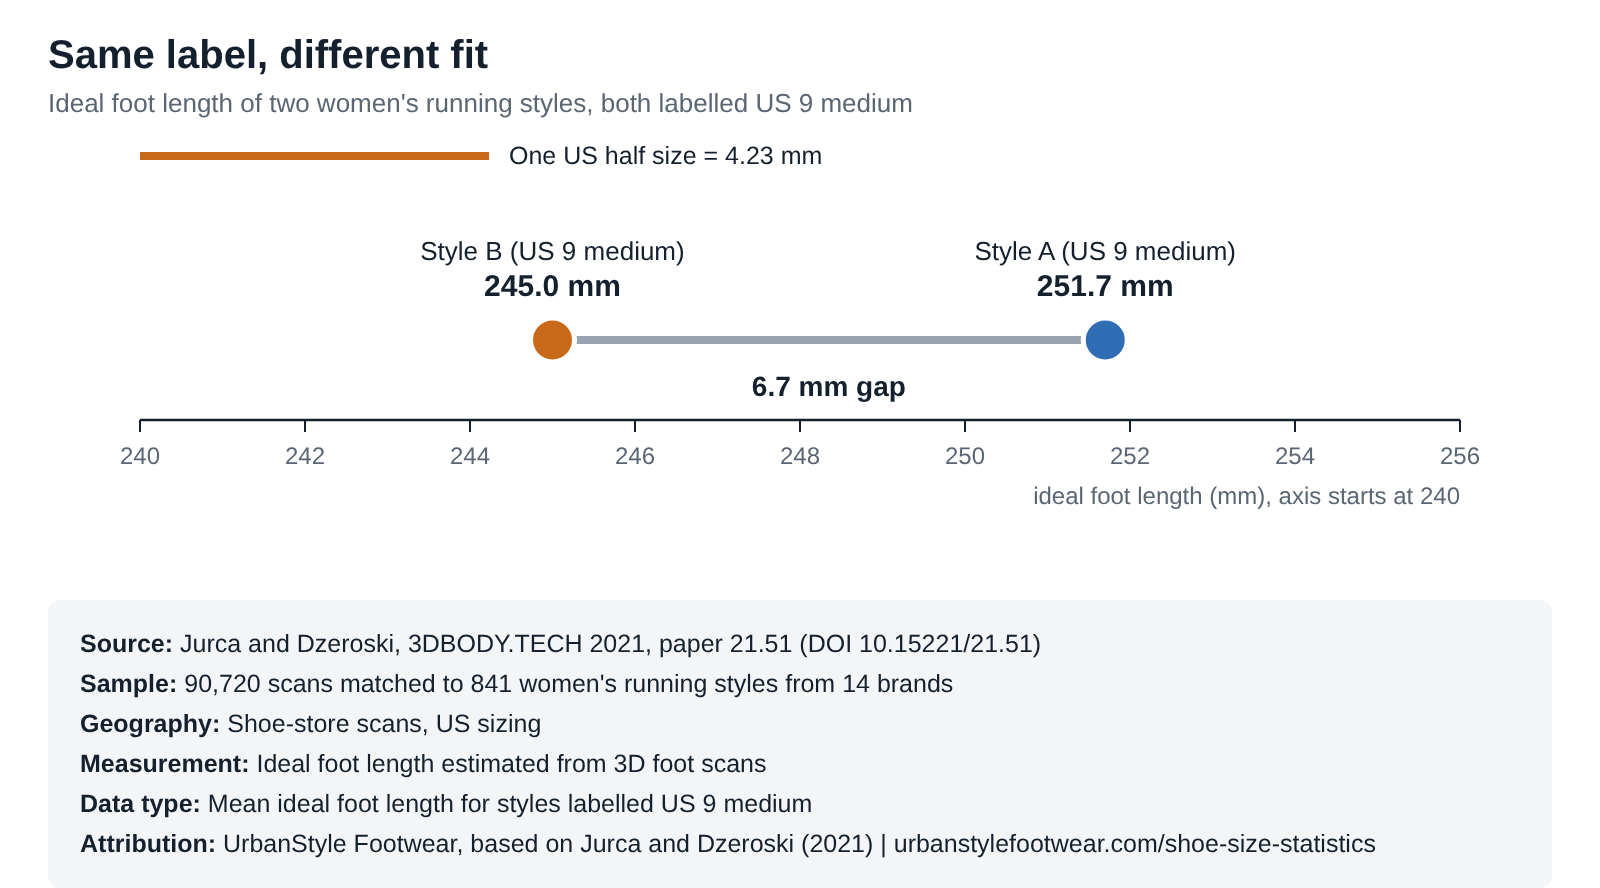
Two women's running styles with the same US 9 medium label had ideal foot lengths 6.7 mm apart (251.7 mm vs 245.0 mm).
Copy text
6.7 mm same label: Two women's running styles with the same US 9 medium label had ideal foot lengths 6.7 mm apart (251.7 mm vs 245.0 mm). Source: Jurca and Dzeroski, 2021 (DOI 10.15221/21.51). Via UrbanStyle Footwear: https://urbanstylefootwear.com/shoe-size-statistics/
Foot length increased by 2 mm to 10 mm on average in 49 women between early pregnancy and about 19 weeks postpartum.
Copy text
2 to 10 mm pregnancy: Foot length increased by 2 mm to 10 mm on average in 49 women between early pregnancy and about 19 weeks postpartum. Source: Segal et al., 2013 (DOI 10.1097/PHM.0b013e31827443a9 | PMID 23117270). Via UrbanStyle Footwear: https://urbanstylefootwear.com/shoe-size-statistics/
A British Footwear Association member survey found a 19% median online footwear return rate, against 5% in store.
Copy text
19% online returns: A British Footwear Association member survey found a 19% median online footwear return rate, against 5% in store. Source: British Footwear Association (Trade survey). Via UrbanStyle Footwear: https://urbanstylefootwear.com/shoe-size-statistics/
In a Spring 2026 US survey, 65% of footwear consumers said they abandoned a purchase because their size was out of stock.
Copy text
65% size out of stock: In a Spring 2026 US survey, 65% of footwear consumers said they abandoned a purchase because their size was out of stock. Source: AlixPartners/FDRA, 2026 (Industry survey). Via UrbanStyle Footwear: https://urbanstylefootwear.com/shoe-size-statistics/
What is the average shoe size in the US?
There is no official answer. The US government publishes height and weight data, but no federal survey we could find records shoe size or foot length for the general population. That is why the “average” differs from site to site.
Three terms get mixed up, and they give different answers:
- Mean (average): add every size and divide by the number of people.
- Median: the middle size when everyone is lined up from smallest to largest.
- Most common (mode): the size more people wear than any other.
Most web pages do not say which one they mean, and most do not name a dataset.
Three popular sources, three different US averages
We checked how widely read pages describe the US average as of October 2026:
| Page | US men | US women | What we noticed |
|---|---|---|---|
| Kizik, “average shoe size for men” | 10.5 | not given | Cites “several studies” without naming one |
| World Population Review, country table | 8.5 (table) | 7 (table) | Its own text on the same page says men are believed to be 10 to 11 and women roughly 9 |
| The Average Body, country chart | 9 (chart) | 7 (chart) | Its own text says the US men’s average is 10.5 |
What the measured data says
The strongest public evidence is a 2019 Scientific Reports study by Jurca, Zabkar and Dzeroski. It analysed 1,200,847 barefoot 3D scans taken in 712 shoe stores between November 2017 and August 2018. About 92% of the scans (1,105,508) came from North America. In that group the most frequent foot-length class was 270 mm for men and 245 mm for women. A
That is a foot length, not a shoe size, and it is a “most common” value rather than a mean. The next sections explain how to read it.
UrbanStyle size-equivalent estimate: what those foot lengths may correspond to
Important: the original study did not report these foot lengths as US shoe sizes. What follows is an UrbanStyle estimate based on a separate footwear-fit dataset and common sizing conventions. Please do not read “270 mm = US 10” as an established equivalence.
To translate foot length into US sizes we used a second dataset from the same research group. In a 2021 analysis of 90,720 scans matched to 841 women’s running shoe styles sold as US 9 medium, the average ideal foot length for a US 9 medium was 249.1 mm. A US half size is 4.23 mm in length, so a full size is about 8.5 mm.
- Women: a 245 mm foot is about 4 mm shorter than the 249.1 mm that fits a US 9. That is about one half size down, so roughly women’s US 8.5. The 245 mm class covers 242.5 mm to 247.5 mm, so the plausible range is about US 8 to 9 once brand differences are included.
- Men: a 270 mm foot is about 21 mm longer than the 249.1 mm that fits a women’s US 9. That is about 2.5 full sizes, so about women’s 11.5. Using the common retail convention that men’s sizes run 1.5 below women’s, that is roughly men’s US 10, and plausibly 9.5 to 10.5.
This is our own arithmetic, built on women’s running shoes, one scanner vendor and a retail convention. It is a sanity check, not a published result. It shows that the commonly repeated figures (men about 10 to 10.5, women about 8.5) are plausible. It does not prove them. E
What we suggest you quote
“Commonly cited averages are about US 10 to 10.5 for men and about 8.5 for women, but no official US measurement exists. The most common foot lengths among scanned North American shoppers were 270 mm for men and 245 mm for women (Jurca et al., 2019).”
Click the quote, then press Ctrl+C (Cmd+C on Mac) to copy it. Please link back to this page.For our shorter pages on the same questions, see average men’s shoe size and average women’s shoe size.
Foot length is not shoe size
Foot length is not shoe size
This is the central misconception behind most “average shoe size” claims. A foot is measured in millimetres. A shoe size is a label that a brand applies to a shoe built on its own foot form. Between the two sit many choices:
- Sizing system
- Last
- Brand
- Shoe style
- Intended fit
- Toe box
- Width
- Manufacturing tolerance
- Footwear construction
ISO 19407:2023 sets out conversion tables between sizing systems and bases them on foot length. Its own scope note says the tables are a guideline for consumers, because the systems developed separately over many years without being formalised. It replaces ISO/TS 19407:2015. We use the standard to explain how sizing systems relate, not as evidence for any average size.
Walk through it
Select a step to see what happens there, using a 270 mm foot as the example.
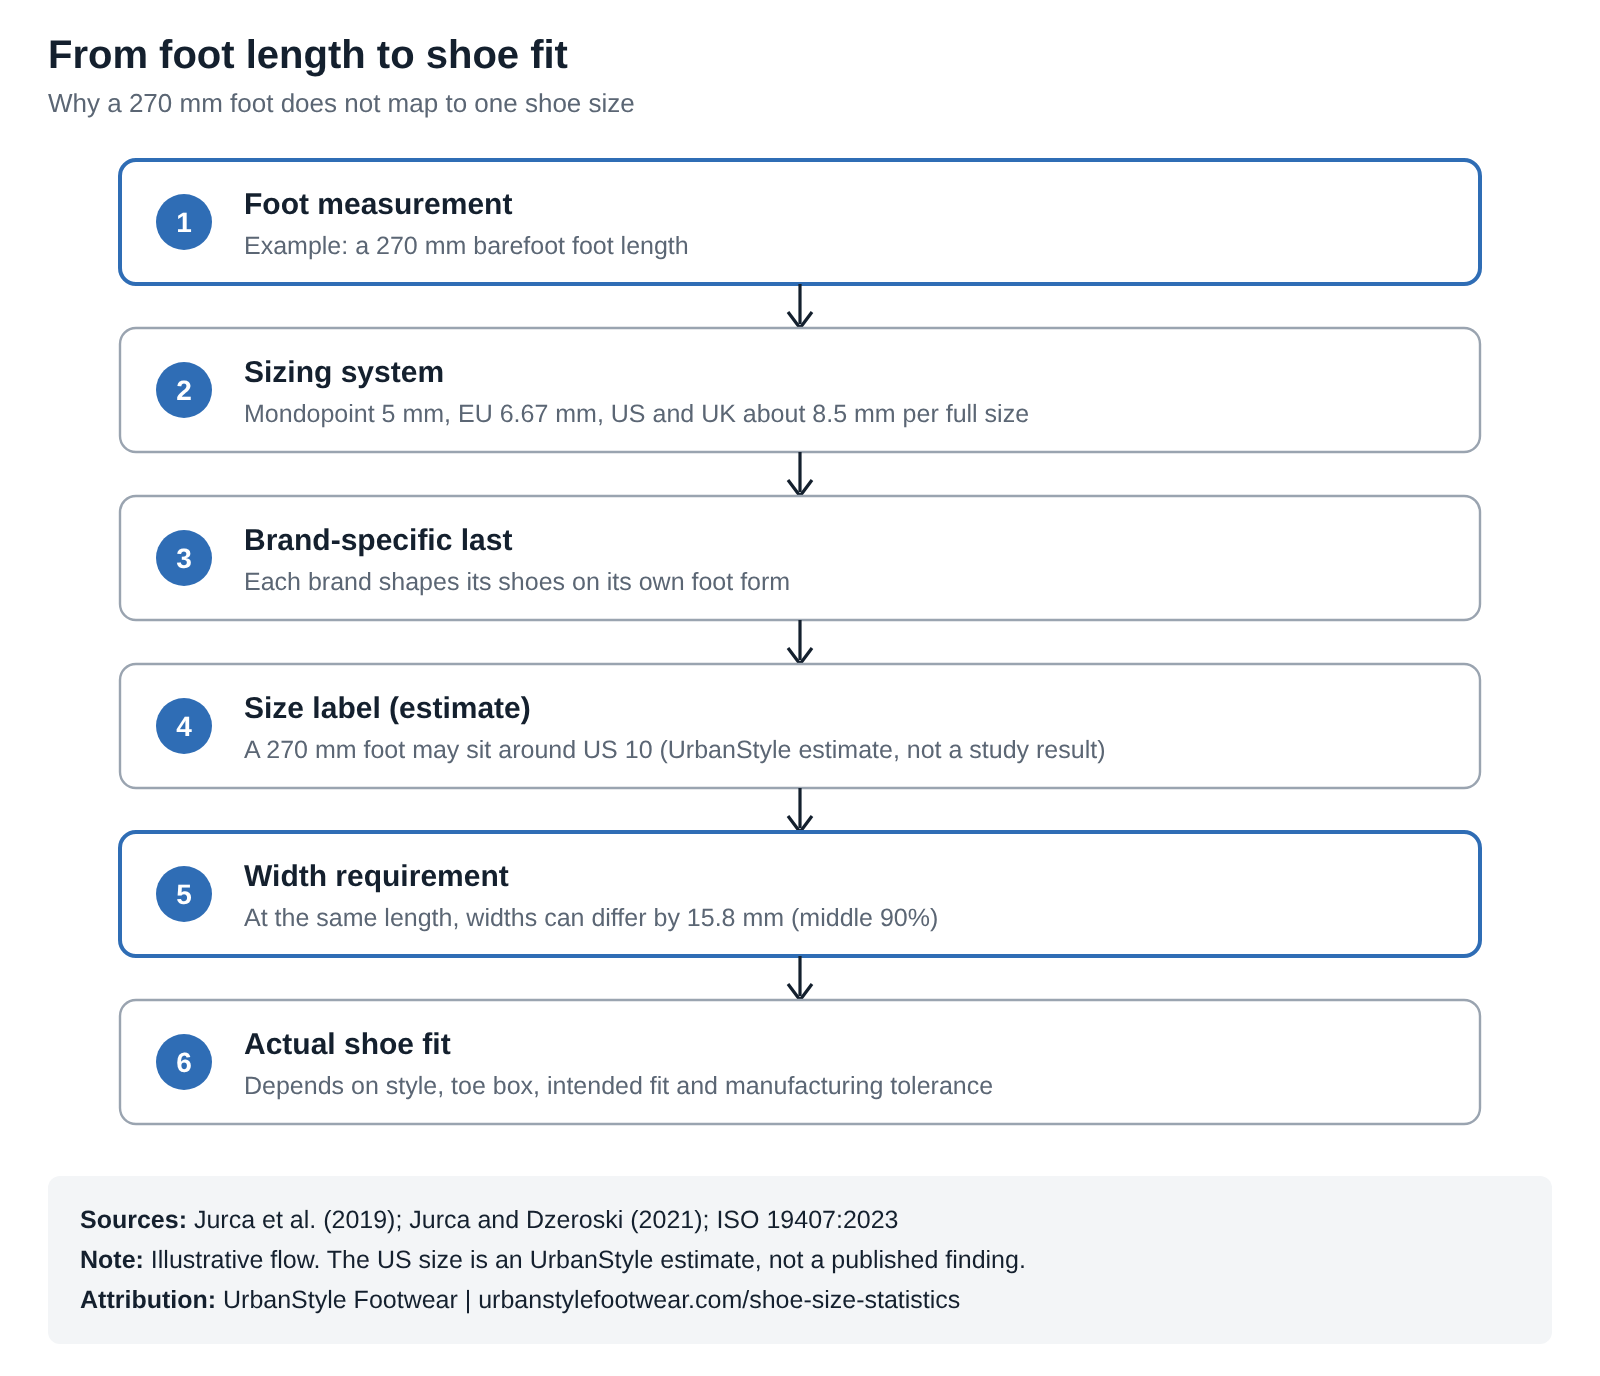
1Foot measurementExample: a 270 mm barefoot length
The only step here that is a physical measurement. In the scan study the foot was measured barefoot and grouped into 5 mm length classes.
2Sizing systemMondopoint, EU, UK, US and others
Each system turns length into a number with a different step: 5 mm for Mondopoint, 6.67 mm for EU, about 8.5 mm for US and UK. ISO 19407 provides a guideline for converting between them.
3Brand-specific lastThe foot form a brand builds its shoes on
No standard defines the gap between foot length and shoe length, and brands interpret it differently. This is where most of the variation enters.
4Size label (estimate)A 270 mm foot may sit around US 10
This is the UrbanStyle estimate explained above, not a study result. In one analysis only 60% of women’s running styles labelled US 9 medium fitted as a true US 9 medium.
5Width requirementThe same length can need different widths
Among North American men with a 270 mm foot, the middle 90% spanned 15.8 mm in width. One US width step is 4.76 mm, so more than three widths were needed.
6Actual shoe fitWhat you feel when you wear it
Style, toe box shape, intended fit (snug or roomy) and manufacturing tolerance all change the result. This is why trying on, or using the brand’s own chart, beats any generic conversion.
Foot Length to Shoe Size to Width. A reusable graphic of the six steps above, with sources printed on the image.
Embed this chart
<figure style="margin:0"><a href="https://urbanstylefootwear.com/shoe-size-statistics/"><img src="https://urbanstylefootwear.com/wp-content/uploads/2026/10/usf-foot-length-to-shoe-fit.png" alt="Six-step flow from a 270 mm foot measurement to sizing system, brand last, size label estimate, width requirement and actual shoe fit" width="800" style="max-width:100%;height:auto"></a><figcaption>Source: UrbanStyle Footwear, based on Jurca et al. (2019), Jurca and Dzeroski (2021) and ISO 19407:2023. <a href="https://urbanstylefootwear.com/shoe-size-statistics/">Shoe Size Statistics 2026</a></figcaption></figure>Click the code, press Ctrl+C (Cmd+C on Mac), and paste it into any web page. Please keep the attribution link.
View as table
| Step | What happens |
|---|---|
| Foot measurement | Example: a 270 mm barefoot foot length |
| Sizing system | Mondopoint 5 mm, EU 6.67 mm, US and UK about 8.5 mm per full size |
| Brand-specific last | Each brand shapes its shoes on its own foot form |
| Size label (estimate) | A 270 mm foot may sit around US 10 (UrbanStyle estimate, not a study result) |
| Width requirement | At the same length, widths can differ by 15.8 mm (middle 90%) |
| Actual shoe fit | Depends on style, toe box, intended fit and manufacturing tolerance |
For converting between systems, use our shoe size conversion calculator. Brand-specific sizing can differ, so check the maker’s own chart, for example Nike, Adidas or New Balance.
How shoe sizes are calculated
Shoe sizes are not one universal scale. The main systems use different step sizes and different starting points. The chain is always the same: foot length, then a sizing system, then the manufacturer’s last, then the final label.
| System | Step between full sizes | What it is based on |
|---|---|---|
| Mondopoint | 5 mm | Foot length in millimetres |
| EU (Paris point) | 6.67 mm (2/3 cm) | A length step, with its own starting point |
| UK | About 8.5 mm (half size is 4.23 mm) | A length step, with its own starting point |
| US | About 8.5 mm, same step as UK | Different starting point, with separate men’s and women’s scales |
| US width | 4.76 mm between width letters | Stated by Jurca et al. (2019) |
| Japan | Listed in ISO 19407 | Japanese sizes are commonly printed as foot length in centimetres, so check the brand’s chart |
This is why a 270 mm foot does not universally equal one shoe size. To compare systems, see our international shoe size chart, the US vs UK vs EU guide, our men’s shoe size to cm and women’s shoe size to cm tables, and the Indian vs US and Indian vs UK guides.
The label on the box is not a measurement
- In a 2021 analysis of 841 women’s running styles all sold as US 9 medium, only 60% fitted as a true US 9 medium. For men’s running shoes, an earlier study by the same authors found 37% did not fit as labelled.
- Two women’s styles with the same US 9 medium label had ideal foot lengths of 251.7 mm and 245.0 mm, a gap of 6.7 mm, which is more than a full US half size.
- The authors note it is not clear whether shoe size standards refer to foot length or shoe length, and the ideal gap between the two is not defined. Almost every brand interprets it differently.
Embed this chart
<figure style="margin:0"><a href="https://urbanstylefootwear.com/shoe-size-statistics/"><img src="https://urbanstylefootwear.com/wp-content/uploads/2026/10/usf-same-label-different-fit.png" alt="Dot plot of two women's running styles both labelled US 9 medium, with ideal foot lengths of 245.0 mm and 251.7 mm, a 6.7 mm gap" width="800" style="max-width:100%;height:auto"></a><figcaption>Source: UrbanStyle Footwear, based on Jurca and Dzeroski (2021). <a href="https://urbanstylefootwear.com/shoe-size-statistics/">Shoe Size Statistics 2026</a></figcaption></figure>Click the code, press Ctrl+C (Cmd+C on Mac), and paste it into any web page. Please keep the attribution link.
View as table
| Style (both labelled US 9 medium) | Ideal foot length (mm) | Source |
|---|---|---|
| Style A | 251.7 | Jurca and Dzeroski, 2021 |
| Style B | 245.0 | Jurca and Dzeroski, 2021 |
| Gap | 6.7 | Jurca and Dzeroski, 2021 |
| One US half size | 4.23 | Jurca and Dzeroski, 2021 |
Average foot length and width (measured data)
Where the data comes from
| Group | Men | Women | Total |
|---|---|---|---|
| North America | 494,833 | 610,675 | 1,105,508 |
| Europe | 43,064 | 31,470 | 74,534 |
| Asia | 10,072 | 10,733 | 20,805 |
| All regions | 547,969 | 652,878 | 1,200,847 |
The scans were taken in stores that use Volumental scanners, so everyone scanned was already shopping for shoes. The only personal detail recorded was sex. Europe included 22 countries and Asia included China, Japan, Korea, Malaysia, Singapore, Taiwan and Thailand. India was not included.
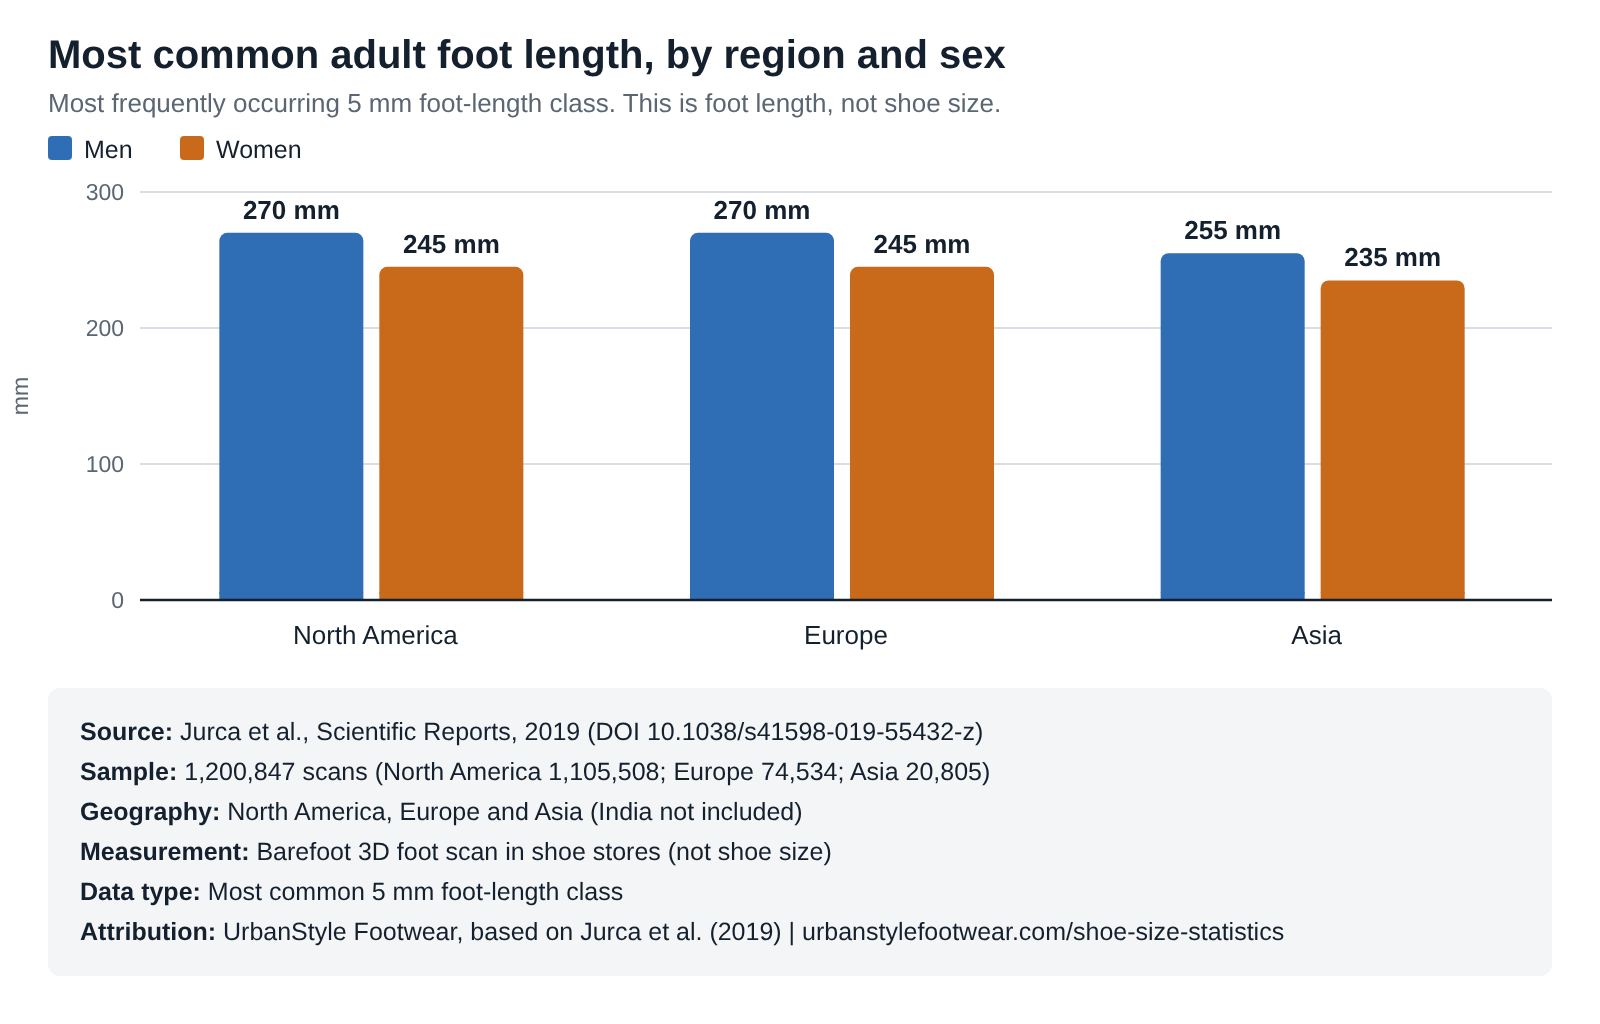
Most common foot length by region and sex
Embed this chart
<figure style="margin:0"><a href="https://urbanstylefootwear.com/shoe-size-statistics/"><img src="https://urbanstylefootwear.com/wp-content/uploads/2026/10/usf-foot-length-by-region.png" alt="Bar chart of the most common adult foot length by region and sex: North America 270 mm men and 245 mm women, Europe 270 and 245, Asia 255 and 235" width="800" style="max-width:100%;height:auto"></a><figcaption>Source: UrbanStyle Footwear, based on Jurca et al. (2019). <a href="https://urbanstylefootwear.com/shoe-size-statistics/">Shoe Size Statistics 2026</a></figcaption></figure>Click the code, press Ctrl+C (Cmd+C on Mac), and paste it into any web page. Please keep the attribution link.
View as table
| Region | Sex | Most common foot-length class (mm) | Source | Sample |
|---|---|---|---|---|
| North America | Men | 270 | Jurca et al., 2019 | 494,833 men |
| North America | Women | 245 | Jurca et al., 2019 | 610,675 women |
| Europe | Men | 270 | Jurca et al., 2019 | 43,064 men |
| Europe | Women | 245 | Jurca et al., 2019 | 31,470 women |
| Asia | Men | 255 | Jurca et al., 2019 | 10,072 men |
| Asia | Women | 235 | Jurca et al., 2019 | 10,733 women |
Asian shoppers in the dataset had shorter feet than North American and European shoppers, for both sexes. North American and European length distributions were very similar.
Foot width varies far more than most people expect
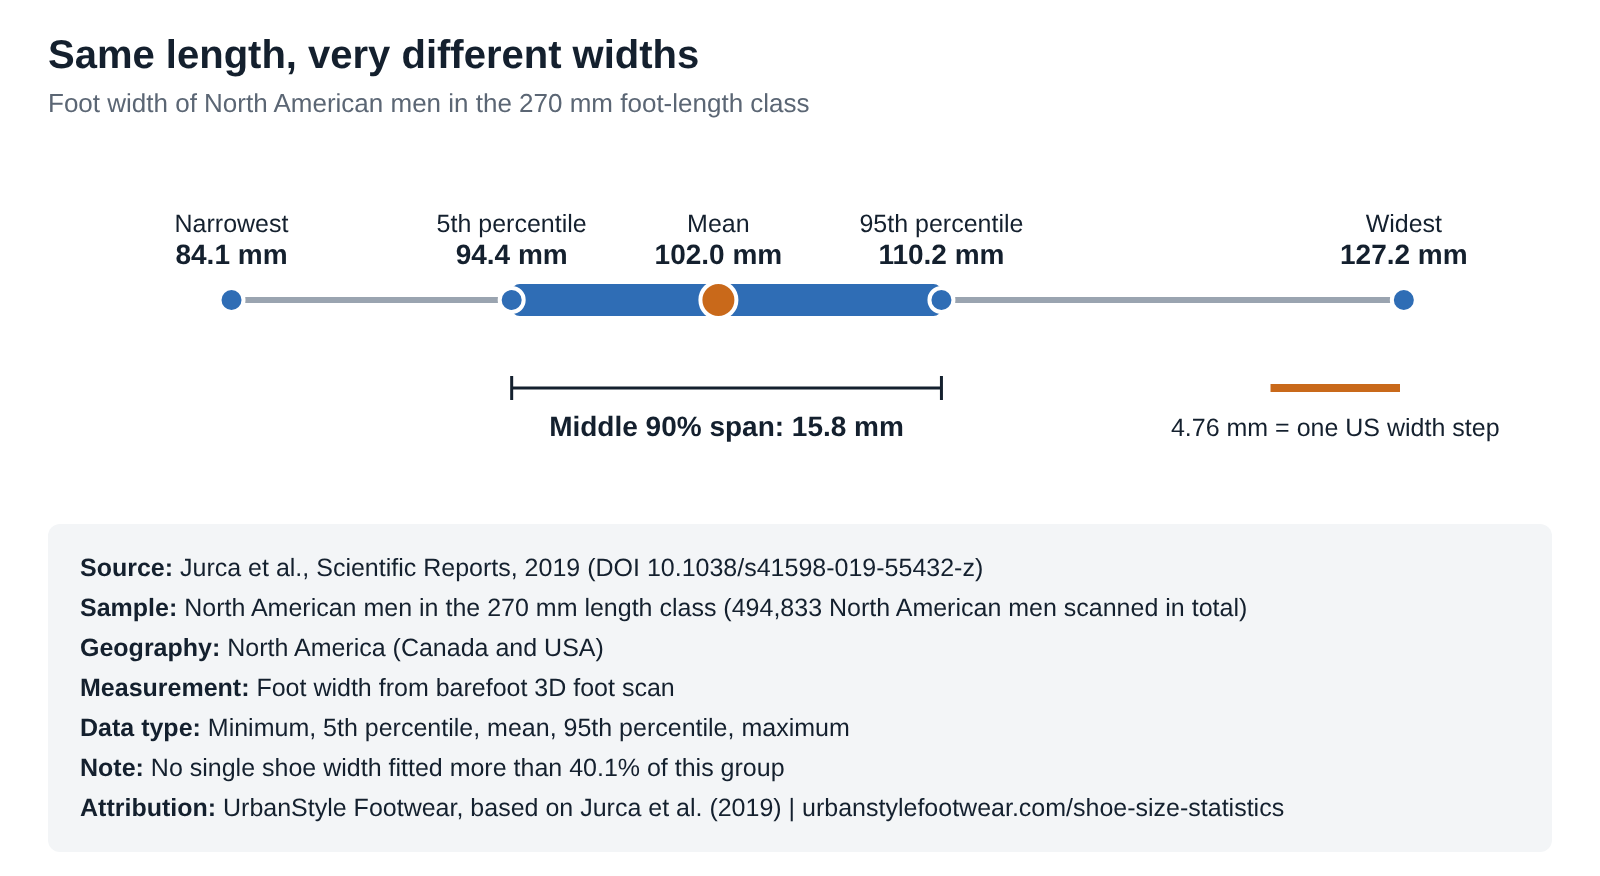
The study sorted feet into 5 mm length classes and measured width within each class. For North American men in the 270 mm class, the narrowest foot was 84.1 mm wide, the widest 127.2 mm, and the mean 102.0 mm.
Embed this chart
<figure style="margin:0"><a href="https://urbanstylefootwear.com/shoe-size-statistics/"><img src="https://urbanstylefootwear.com/wp-content/uploads/2026/10/usf-foot-width-spread-270mm.png" alt="Range chart of foot width for North American men with a 270 mm foot, from 84.1 mm narrowest to 127.2 mm widest, with the middle 90 percent spanning 15.8 mm" width="800" style="max-width:100%;height:auto"></a><figcaption>Source: UrbanStyle Footwear, based on Jurca et al. (2019). <a href="https://urbanstylefootwear.com/shoe-size-statistics/">Shoe Size Statistics 2026</a></figcaption></figure>Click the code, press Ctrl+C (Cmd+C on Mac), and paste it into any web page. Please keep the attribution link.
View as table
| Measure | Foot width (mm) | Source |
|---|---|---|
| Narrowest | 84.1 | Jurca et al., 2019 |
| 5th percentile | 94.4 | Jurca et al., 2019 |
| Mean | 102.0 | Jurca et al., 2019 |
| 95th percentile | 110.2 | Jurca et al., 2019 |
| Widest | 127.2 | Jurca et al., 2019 |
| Middle 90% span | 15.8 | Jurca et al., 2019 |
| US width step | 4.76 | Jurca et al., 2019 |
The middle 90% of these men span 15.8 mm in width. One US width step is 4.76 mm (stated by the authors), so more than three widths are needed to cover them. Even the single most common width fits at most 40.1% of the group. The study concluded that at least three widths per length size are needed to fit 90% of customers, and found the same wide spread in instep height (about 16 mm between the 5th and 95th percentile) and heel width.
How far apart are the published widths?
Choose a point to compare it with the group mean, measured in US width steps (one step is 4.76 mm).
Select a point above.
Narrowest: 84.1 mm. That is about 3.8 US width steps narrower than the group mean of 102.0 mm. The narrowest foot in the class.
5th percentile: 94.4 mm. That is about 1.6 US width steps narrower than the group mean of 102.0 mm. Fewer than 5 in 100 of these men are narrower.
Mean: 102.0 mm. That is the group mean. This is the group mean.
95th percentile: 110.2 mm. That is about 1.7 US width steps wider than the group mean of 102.0 mm. Fewer than 5 in 100 of these men are wider.
Widest: 127.2 mm. That is about 5.3 US width steps wider than the group mean of 102.0 mm. The widest foot in the class.
In plain terms: two men who both wear a US 10 can have feet that differ by more than 15 mm in width. Most shoes are sold in one width, which is a big reason fit problems are so common. See our guides to men’s shoe widths and women’s shoe widths, and the wide men’s and wide women’s size charts.
Men vs women: how feet differ
Women’s feet are not simply smaller copies of men’s feet. In the 1.2 million scan study:
- Length: women’s feet were shorter than men’s in every region.
- Width and instep at the same length: for foot lengths of roughly 245 mm to 280 mm, men’s feet were significantly wider and higher in the instep than women’s feet of the same length (North America and Europe).
- Shorter lengths: in the 220 mm to 240 mm classes the pattern reversed in North America, but the authors think this is because boys’ feet, which are still growing, are included in the male data. Age was not recorded, so they could not remove them.
- Heel width: differences were statistically significant in places but practically negligible.
The authors’ practical conclusion is that shoes made for men’s feet will fit some women with wide, high-instep feet, and the reverse, but that shoes need to be developed separately for each sex and region to fit the average foot well. If you are converting between sexes, our men’s to women’s size conversion chart explains the usual 1.5 size gap.
Average shoe size by country and region
We are not publishing a country-by-country table of “average shoe size” on this page. We found no standardised global dataset, and the country tables available online are estimates that do not agree with each other (see the three-source comparison above). A neat table would look more certain than the evidence allows.
What we can offer is measured regional data:
| Region | Most common male foot length | Most common female foot length | Notes |
|---|---|---|---|
| North America (Canada, USA) | 270 mm | 245 mm | 1,105,508 scans |
| Europe (22 countries) | 270 mm | 245 mm | 74,534 scans. Higher average instep than North America |
| Asia (7 countries and territories) | 255 mm | 235 mm | 20,805 scans. Feet were on average wider at the same length |
Two more findings matter for anyone comparing regions. Asian shoppers in the study had significantly wider feet than North American and European shoppers at the same length, for both sexes. European shoppers had higher insteps than North American ones. A shoe designed around one region’s average foot will not fit another region’s average foot well.
We did not find a comparable published national measurement study for India while preparing this page, so we do not give an Indian average here. For converting sizes, see our Indian vs US size guide.
Are feet getting bigger?
You will often read that the average woman’s shoe size has grown by two or three sizes since the 1940s or 1970s. Here is what we could trace:
| Claim | Where it comes from | What we could verify | Evidence |
|---|---|---|---|
| Average US woman’s shoe size rose from 5.5 in the 1940s to 8.5 today | A museum curator’s article (Charleston Museum) | A curator’s statement attributing the change to diet. No dataset is cited | Tier E |
| The average British foot is two sizes bigger than in the 1970s | A College of Podiatry survey of about 2,000 people, as reported by BBC Learning English (2014) | A media report. We did not find the underlying survey, and the report gives no starting or ending sizes | Tier D |
| 41% of women have increased their shoe size in adult life | A shoe brand’s blog | Not traceable | Tier E |
Research conclusion: there is insufficient evidence for a precise historical US shoe-size trend.
Our view: it is very likely that average feet have grown, because average height and weight have grown and taller people tend to have longer feet. The museum piece also points out that old shoes often look smaller partly because they were narrower, and that modern shoes are mostly sold in a single width, so people with wide feet tend to size up in length. But the exact historical numbers are not backed by a published dataset we could find, so we do not give a precise “then vs now” figure. If you have a historical foot measurement dataset, please contact us and we will review it.
How feet change over a lifetime and over a day
- Pregnancy: in a University of Iowa study of 49 women measured in the first trimester and about 19 weeks postpartum, foot length increased by 2 mm to 10 mm on average and arch height dropped. The changes were largest after a first pregnancy. The sample is small, so treat it as a strong signal, not a precise figure. (Segal et al., 2013, DOI 10.1097/PHM.0b013e31827443a9, PMID 23117270. Tier A.)
- Adulthood: in the 1993 American Orthopaedic Foot and Ankle Society survey of 356 women, the majority reported that their shoe size had increased since age 20. (Frey et al., 1993, PMID 8454237. Tier A, older and self-reported.)
- During the day: studies of healthy hospital workers have documented leg volume increasing over a working shift, with larger increases in the morning shift than the afternoon shift. These studies measured leg volume, not shoe size. You will often read that feet swell by “half a size” by evening, but we did not find a peer-reviewed figure for that, so we do not state one. (Belczak et al., 2009, PMID 19155337. Tier A, leg volume only.)
- Children: growth is fast and uneven. See kids’ shoe size by age and how fast kids’ feet grow.
The practical takeaway does not depend on a precise swelling figure: measure at the end of the day and re-measure every year or two.
How many people wear the wrong size?
| Study | Finding | Tier |
|---|---|---|
| Buldt and Menz, 2018, review of 18 studies (3,205 participants). DOI 10.1186/s13047-018-0284-z | Between 63% and 72% of participants wore shoes that did not accommodate either the width or the length of their feet. Some groups, such as older adults and people with diabetes, were more likely to wear shoes that were too narrow (46% to 81%) | A |
| Frey et al., 1993, survey of 356 women. PMID 8454237 | 88% wore shoes smaller than their feet, by 1.2 cm on average. Most had not had their feet measured for years | A |
Two cautions. The review’s studies defined “incorrectly fitted” differently (for example, one counted shoes at least half a size off), and the participants were not a random sample of the population. The 1993 survey is old and included only women. Still, the direction is consistent across decades: a large share of people wear shoes that do not match their feet, and narrow shoes are the most common problem.
The review links incorrectly fitted shoes with foot pain and conditions such as corns, calluses and lesser toe deformity. This research shows associations, not proof that incorrectly fitted shoes cause every condition discussed. It is not medical advice. If shoes are hurting your feet, see our foot pain guide and speak to a podiatrist or doctor.
Shoe size availability and consumer behaviour in 2026
The anthropometric research above does not change from year to year. What does change is how people buy shoes. One current US survey gives a consumer-side view of sizing.
This comes from the AlixPartners and FDRA Spring 2026 Footwear Survey (press release dated April 23, 2026; full report). In the same survey, brand size charts were the most trusted sizing tool, and AI-powered fit tools ranked last. C
Two cautions: the survey was run by a consulting firm with the footwear industry’s trade association, so it is industry research, and it measures what consumers say they did. It tells us about size availability, not about how well sizes fit.
Online returns
- A British Footwear Association member survey found online footwear return rates ranging from 2% to 31%, with a 19% median, compared with a 5% median for in-store sales. It is a survey of UK members, and the page does not state a sample size or date. C
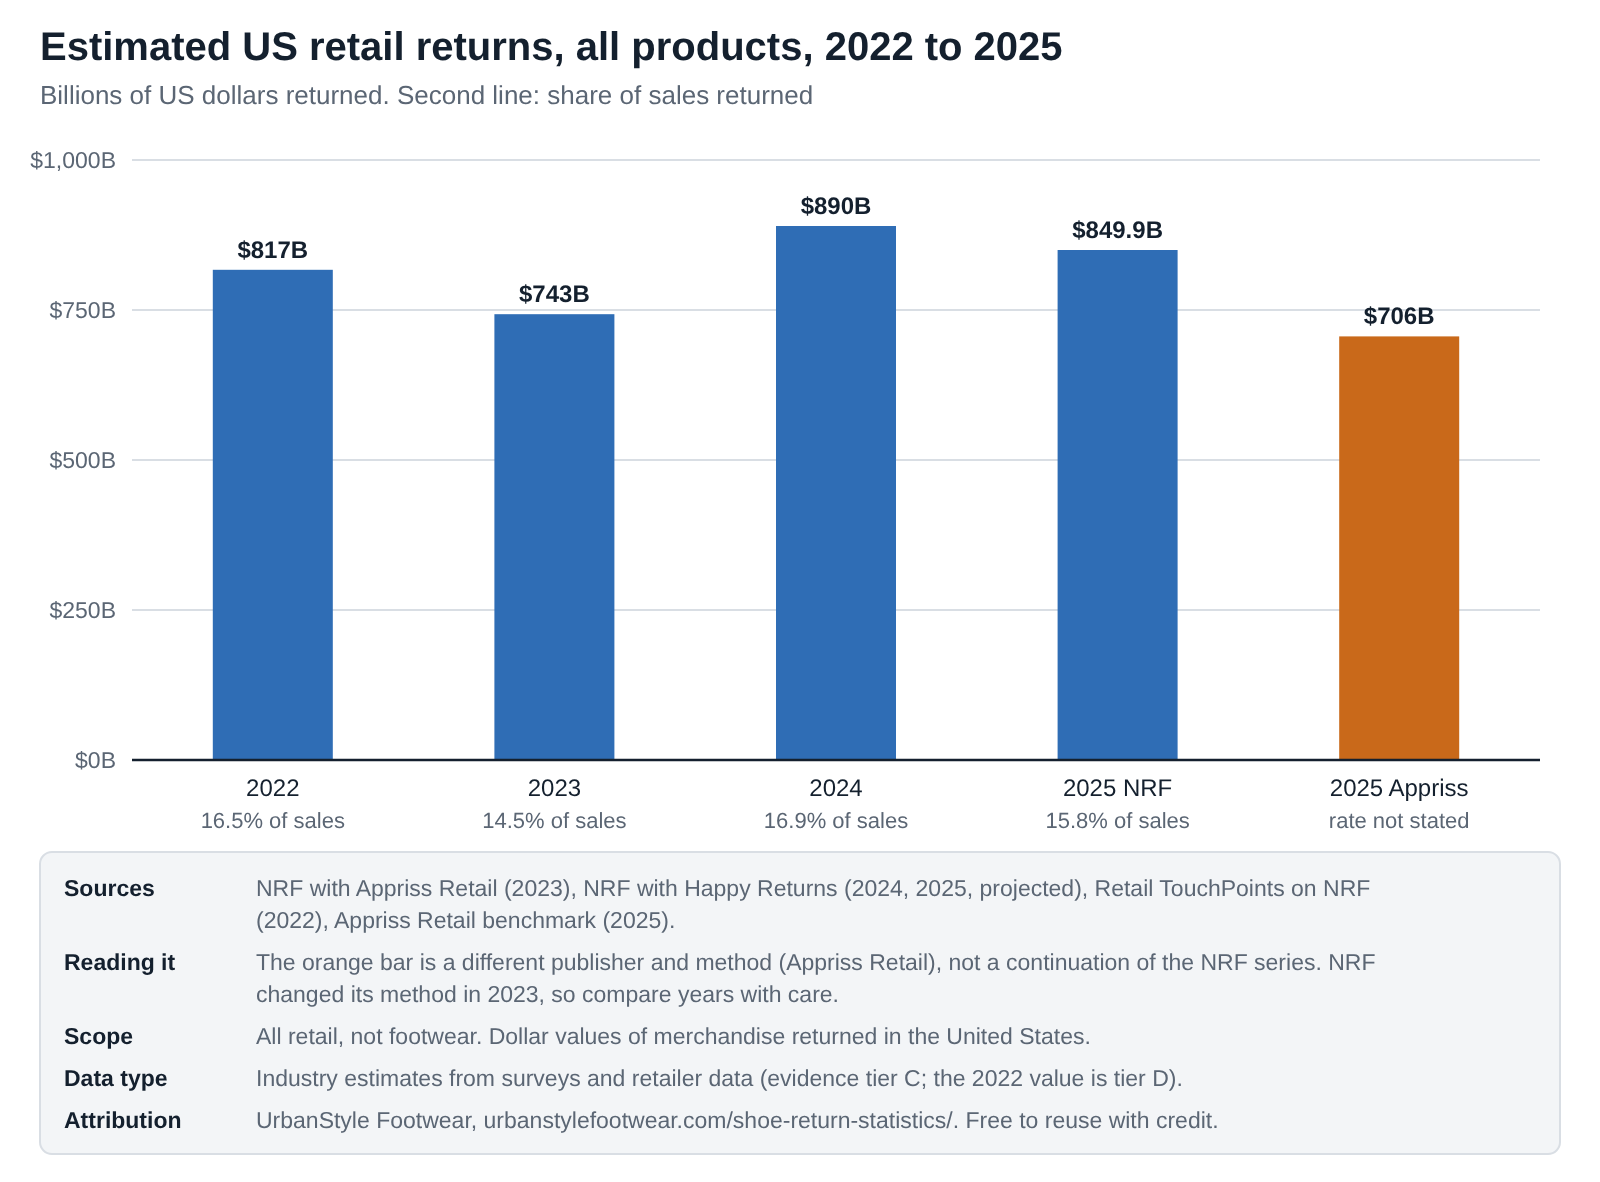
- The National Retail Federation and Happy Returns estimated that 19.3% of online retail sales would be returned in 2025. That figure covers all online retail, not footwear alone. C
We have not found a clean, independent figure for what share of shoe returns are specifically size-related, so we do not state one. We plan a dedicated page on shoe returns and will publish original survey data there when we have it.
What changed on this page in 2026
The anthropometric research is from 2019 and 2021, and that is why most figures carry those dates. The 2026 update did four things:
- Re-checked every figure against its original source and added a DOI or PMID where one exists.
- Added current 2026 consumer data (above) so “fit data” is not only historical.
- Corrected or removed unsupported claims that circulate online, and said so on the page.
- Added downloadable data, charts and citation formats. We did not identify a newer published dataset of comparable size at the time of review. If you know of one, please tell us.
What existing shoe size articles get wrong
Most “average shoe size” content shares the same weaknesses. This page is built to avoid each one.
- Problem 1They confuse foot length with shoe size.
- Problem 2They repeat unattributed “average size” claims.
- Problem 3They mix mean, median and mode.
- Problem 4They present estimates as measurements.
- Problem 5They do not distinguish countries.
- Problem 6They do not report sample sizes.
- Problem 7They do not report measurement methodology.
- Problem 8They ignore width.
- Problem 9They do not distinguish shoe size from foot dimensions.
What these findings mean for shoppers
The data explains why a single chart can fail you. These steps work better. They are practical advice, separate from the research above.
- Measure both feet, later in the day. One foot is often larger than the other, so fit the larger one. Our guides cover measuring at home, men’s feet, women’s feet and kids’ feet.
- Measure width as well as length. Width varies by 15.8 mm at the same length, so a shoe that is “your size” in length can still pinch. See the men’s and women’s width guides.
- Use the brand’s own chart. Only 60% of one set of US 9 medium running shoes fitted as labelled. Start with the maker’s chart, for example Brooks or ASICS, then cross-check with our conversion calculator.
- Leave toe room. A common rule of thumb is about 1 cm (3/8 to 1/2 inch) between your longest toe and the end of the shoe. Stand up when you test the fit.
- Re-measure. Pregnancy, weight change and age can change your size. If shoes you used to wear now feel tight, measure again. If a shoe is slightly tight, stretching is a last resort.
Prefer a quick lookup? Try our men’s, women’s and kids’ shoe size charts, or the men’s and women’s half size guides.
Sources and evidence tiers
Evidence hierarchy
- APrimary peer-reviewed research. Original data in a peer-reviewed journal.
- BOfficial standards or government data. For example ISO 19407:2023. Authoritative for how systems work, not proof of an average size.
- CIndustry research and surveys. Includes industry-authored conference papers and trade surveys. Useful, but the funder or author has a commercial interest.
- DSecondary reporting. A publication summarising someone else’s data.
- EEstimates and conventions. No traceable dataset. Our own calculations are also labelled E.
Primary versus secondary data
Primary source: the organisation that collected or published the original data. Secondary source: a publication summarising or reporting someone else’s data. When both are available, UrbanStyle cites the primary source and links to it. Where we could only read a secondary summary, the table says so.
Source table
| Source | Year | Sample | Geography | Finding used | Tier | DOI / PMID | Primary source |
|---|---|---|---|---|---|---|---|
| Jurca, Zabkar and Dzeroski. Analysis of 1.2 million foot scans from North America, Europe and Asia. Scientific Reports 9:19155 | 2019 | 1,200,847 scans in 712 stores (Nov 2017 to Aug 2018) | North America, Europe, Asia | Most common foot-length classes, width spread, 4.76 mm US width increment, men vs women, regional differences | A | DOI 10.1038/s41598-019-55432-z | PMID 31844106 | Open-access full text |
| Jurca and Dzeroski. Estimating Footwear Fit by Using 3D Foot Scans of Shoe Shoppers. 3DBODY.TECH 2021, paper 21.51 | 2021 | 90,720 scans matched to 841 women's running styles (14 brands) | Shoe-store scans, US sizing | Ideal foot length for a US 9 medium, 60% true-to-label, 6.7 mm gap between two styles | C | DOI 10.15221/21.51 | Paper (PDF) |
| Buldt and Menz. Incorrectly fitted footwear, foot pain and foot disorders: a systematic search and narrative review. Journal of Foot and Ankle Research 11:43 | 2018 | 18 studies, 3,205 participants | Multiple countries (review) | 63% to 72% wore shoes that did not fit length or width; fit definitions vary | A | DOI 10.1186/s13047-018-0284-z | Full text |
| Frey, Thompson, Smith, Sanders and Horstman. American Orthopaedic Foot and Ankle Society Women's Shoe Survey. Foot & Ankle 14(2):78-81 | 1993 | 356 women | USA (not confirmed from abstract) | 88% wore shoes smaller than their feet, by 1.2 cm on average | A | PMID 8454237 | Record (abstract only) |
| Segal, Boyer, Teran-Yengle, Glass, Hillstrom and Yack. Pregnancy leads to lasting changes in foot structure. American Journal of Physical Medicine & Rehabilitation 92(3):232-240 | 2013 | 49 women | USA (University of Iowa) | Foot length increased 2 mm to 10 mm on average between early pregnancy and about 19 weeks postpartum | A | DOI 10.1097/PHM.0b013e31827443a9 | PMID 23117270 | University record |
| Belczak et al. Rate of occupational leg swelling is greater in the morning than in the afternoon. Phlebology 24(1):21-25 | 2009 | Hospital workers (leg volume) | Brazil | Leg volume rises over a work shift (leg volume, not shoe size) | A | PMID 19155337 | Abstract |
| ISO 19407:2023 Footwear – Sizing – Conversion of sizing systems | 2023 | International standard | International | Conversion tables based on foot length for Mondopoint, EU, UK, China, Japan, Korea and US; tables are a guideline | B | Replaces ISO/TS 19407:2015 | Standard listing |
| AlixPartners and FDRA. Spring 2026 Footwear Survey (press release, April 23, 2026) | 2026 | 1,006 US footwear consumers, online, March 9 to 23, 2026 | USA | 65% said they abandoned a purchase because their size was out of stock (a 91% increase year over year) | C | Industry survey | Press release |
| National Retail Federation and Happy Returns. 2025 Retail Returns Landscape (October 15, 2025) | 2025 | All online retail (estimate) | USA | 19.3% of online sales estimated to be returned in 2025 (all categories, not footwear only) | C | Industry projection | Report page |
| British Footwear Association. Footwear Return Rates: BFA Member Survey | n/a | Member survey, sample size and date not stated on page | United Kingdom | Online footwear return rates 2% to 31%, median 19%; in-store median 5% | C | Trade survey | Survey page |
| BBC Learning English (2014), reporting a College of Podiatry survey, as hosted by China Daily | 2014 | About 2,000 people (as reported; survey not found) | United Kingdom | Average British foot said to be two sizes bigger than in the 1970s | D | Secondary report | Media copy |
| Charleston Museum. America's Growing Feet | n/a | No dataset cited | USA | Claim that average US woman's size rose from 5.5 (1940s) to 8.5; no dataset cited | E | Curator article | Article |
| Kizik; World Population Review; The Average Body (country and US average pages, retrieved October 2026) | 2026 | No named dataset | USA / global | Contradictory US averages (men 8.5 to 10.5), used only as examples of untraceable figures | E | Web pages | Kizik example |
Methodology and limitations
How we built this page. Every statistic was traced to its original source and read there (full text or abstract) wherever possible. We recorded the source, publication date, data year, sample or population, and what kind of evidence it is. Anything we could not trace to a dataset is either labelled tier E or left out.
What we left out. We did not use commonly repeated figures we could not trace, such as percentage distributions of US shoe sizes (“X% of men wear size 10”), retail “most sold size” claims, and average shoe size by country tables. If you see one of these elsewhere, check whether it names a dataset.
Limitations you should know about
- Scan data is not a population sample. The 1.2 million scans came from shoppers in stores that use Volumental scanners, mostly North American (92%). Asia is only 1.7% of scans, and India is not included.
- Foot length is not shoe size. The study measured barefoot length. The size someone buys depends on the brand, the style and personal preference.
- Vendor connection. The first author of the scan studies reports a financial interest in Volumental, the scanner company. The authors state the results do not depend on the scanner technology, and the 2019 paper was peer-reviewed in Scientific Reports, but you should know about the connection.
- Boys’ feet are included in the male data for shorter lengths, because age was not recorded.
- The 2021 fit analysis covers running shoes from 14 brands, and women’s US 9 medium specifically, so it should not be read as proof for every shoe type.
- Industry surveys (AlixPartners and FDRA, BFA, NRF) report what respondents said, and the BFA page gives no sample size or date.
- Older surveys. The 1993 women’s shoe survey is more than 30 years old and included only women aged 20 to 60.
- Small samples. The pregnancy study followed 49 women.
- Our US size estimate is our own arithmetic, explained above, and is approximate.
- We could not access the public ANSUR II US Army anthropometric dataset during preparation, and in any case it is a military sample, so we did not use it.
Data freshness
| Date | Change |
|---|---|
| October 7, 2026 | First publication. Full source review. Added 2026 AlixPartners and FDRA consumer data, DOI and PMID details, downloadable dataset and charts, and the size-equivalent estimate with its limits. |
| January 2027 | Next scheduled review. |
Last full source review: October 7, 2026. Next scheduled review: January 2027. We review this page quarterly for newly published anthropometric studies, updated industry data and corrections to existing sources.
Corrections. If you find an error or have better data, email info@urbanstylefootwear.com with the subject “Data correction”. We will review it and note any change in the table above. How we test and review products is explained in our methodology.
For journalists and researchers
Looking for shoe-size or foot-dimension data for an article, report or research project? You can use the statistics and charts on this page with attribution to UrbanStyle Footwear. Whenever possible, please cite the original study listed alongside each statistic.
Media kit
Media kit
Four charts with source, sample and method printed on each image. SVG versions are under each chart above.
The 15 citable statistics on one printable PDF page.
Every source with year, sample, geography, tier, DOI or PMID and link.
Ready-made citations below. Media and research enquiries go to info@urbanstylefootwear.com.
Cite this page
Suggested citation
UrbanStyle Footwear. “Shoe Size Statistics 2026: Average Shoe Size, Foot Length and Fit Data.” Updated October 7, 2026. https://urbanstylefootwear.com/shoe-size-statistics/
APA style
Vahith, A. (2026, October 7). Shoe size statistics 2026: Average shoe size, foot length and fit data. UrbanStyle Footwear. https://urbanstylefootwear.com/shoe-size-statistics/
Link (HTML)
<a href="https://urbanstylefootwear.com/shoe-size-statistics/">Shoe Size Statistics 2026 by UrbanStyle Footwear</a>Click any citation, then press Ctrl+C (Cmd+C on Mac) to copy it.
For individual statistics, UrbanStyle recommends citing the original study listed in the source table whenever possible.
Data requests. Data correction or dataset request: info@urbanstylefootwear.com
Frequently asked questions
What is the average men’s shoe size?
There is no official measurement. The commonly cited figure is about US 10 to 10.5. The most common foot length among scanned North American men was 270 mm, which our estimate suggests is roughly a US 10. See average men’s shoe size.
What is the average women’s shoe size?
The commonly cited figure is about US 8.5. The most common foot length among scanned North American women was 245 mm, roughly a US 8.5 on our estimate. See average women’s shoe size.
What is the most common men’s shoe size?
We cannot give a reliable “most sold” size because we found no published sales dataset. The most common measured foot length for North American men was 270 mm.
What is the most common women’s shoe size?
Same limit: no published sales dataset. The most common measured foot length for North American women was 245 mm.
What is the most common shoe size in America?
No official or sales-based answer exists. Commonly cited averages are about US 10 to 10.5 for men and about 8.5 for women, and the measured foot-length classes above are consistent with that.
What is the average foot length?
Among scanned North American shoppers the most common length classes were 270 mm for men and 245 mm for women. These are “most common” values, not exact means.
What is the average foot width?
The study reports width within each length class rather than one overall average. For North American men in the 270 mm class, the mean was 102.0 mm and the middle 90% ranged from 94.4 mm to 110.2 mm.
What is the average shoe size by country?
No standardised global dataset exists and online country tables contradict each other, so we do not publish one. We give measured regional data for North America, Europe and Asia instead. For converting sizes between countries use our international shoe size chart.
Does shoe size change with age?
It can. A 1993 survey of 356 women found most reported a larger shoe size than at age 20, and a 2013 study found foot length increased by 2 mm to 10 mm after pregnancy. Children’s feet change quickly, see kids’ shoe size by age.
Do feet get bigger as you age?
Some do, but we did not find a peer-reviewed figure for steady growth through adult life. The evidence we found is self-reported (the 1993 survey) or tied to events such as pregnancy.
Why do shoes of the same size fit differently?
Brands interpret sizing systems differently, and no standard defines the gap between foot length and shoe length. In one analysis of 841 women’s running styles labelled US 9 medium, only 60% fitted as a true US 9 medium.
Is foot length the same as shoe size?
No. Foot length is a measurement. Shoe size is a label that depends on the sizing system, the brand’s last, the style and the intended fit. See foot length is not shoe size.
How accurate are shoe size charts?
They are guidelines. ISO 19407:2023 says its own conversion tables are a guideline, and the 60% true-to-label finding shows labels vary. A brand’s own chart is usually the most reliable, for example Nike or New Balance.
How much does foot width vary?
A lot. Among North American men with a 270 mm foot, the middle 90% spanned 15.8 mm in width, and no single width fitted more than 40.1% of them. See men’s shoe width guide.
What percentage of people wear the wrong shoe size?
A review of 18 studies found 63% to 72% of participants wore shoes that did not accommodate their foot’s width or length. Definitions varied between studies, so treat it as a range, not a national figure.
What is the average shoe size in India or the UK?
We did not find a published national measurement study for India or the UK, so we do not give one. See our Indian vs US and Indian vs UK guides for conversions.
Can I cite this page or reuse the charts?
Yes. Use the citation formats above, and link to this page when you reuse a chart. For any single statistic please also cite the original source.