
I wanted a straight answer to “what is the average foot size?” and found that most pages answer with shoe sizes, salespeople’s impressions or one country’s data. The measured numbers do exist, but they are scattered across scan studies, army surveys and journals, and they measure different people in different ways. This page puts the ones I could trace to a source in one place, for men and women, in millimetres, with the data free to download.
Six headline foot size numbers. Select one to see what it counts and where it comes from.
Select a topic above, for example “Men”, to see what the number counts.
270 mmIn 1.2 million foot scans, 270 mm was the most common foot-length class for men in North America and Europe (tier A). The US Army survey median was 271 mm (tier D). It is a foot length, not a shoe size.
245 mmIn the same scans, 245 mm was the most common class for women in North America and Europe (tier A). The US Army survey median was 244 mm (tier D).
255 / 235 mmAsian scans were shifted shorter: 255 mm for men and 235 mm for women were the most common classes (tier A). Only about 2% of the scans came from Asia.
102 vs 93 mmThe US Army survey median foot breadth was about 102 mm for men and 93 mm for women (tier D, my conversion from inches). It is a military sample.
4.3 mmIn a study of 2,321 Chinese adults, women's feet were about 4.3 mm narrower than men's at the same foot length (tier A).
19%A SATRA trade article says as many as 19% of people in the UK, and at least 24% in China, have feet that differ in length by more than 4 mm (tier C). It gives no sample size.
Each number names its source and evidence tier. All fifteen of my citable statistics are further down this page.
Foot size statistics at a glance
Quick answer. There is no official average foot size, but the best measured evidence says an adult man’s foot is about 270 mm long and a woman’s about 245 mm in North America and Europe, and about 255 mm and 235 mm in Asia. Feet are about 100 to 102 mm wide for men and 89 to 93 mm for women. Those are foot lengths, not shoe sizes, and the spread is wide: the middle 90% of men’s feet in one survey ran from 250 to 293 mm. Anything more exact than that, such as a national average for most countries, is not something I could verify.
This is the numbers page. To convert a foot length into a shoe size, use my shoe size conversion calculator, and for shoe size figures see my shoe size statistics. The wider picture is in the footwear statistics hub.
Key findings
- The largest study I found scanned 1,200,847 pairs of feet in stores in North America, Europe and Asia. The most common foot-length class was 270 mm for men and 245 mm for women in North America and Europe, and 255 mm and 235 mm in Asia. That is a most common class, not a mean.
- Other sources land close by. The US Army’s median was 271 mm for men and 244 mm for women, and 580 Iranian students averaged 270.0 mm and 234.4 mm. These are three kinds of average from three kinds of people, so I treat them as agreement within about 10 mm and not as one number.
- The spread is large. In the US Army survey, the middle 90% of men’s feet spanned 250 to 293 mm, about 43 mm, and women’s spanned 226 to 268 mm. The two ranges overlap by about 18 mm (my calculation).
- Median foot width in the same survey was about 102 mm for men and 93 mm for women. The Iranian students averaged 100.4 mm and 89.2 mm. The scan study gives width by length class, and for men at 270 mm the mean was 102.0 mm.
- Asian feet were shorter and, in most length classes, wider than North American and European feet in the scan study. Only about 2% of those scans were from Asia, from seven countries, so I would not generalise to the whole continent.
- India’s own survey of 101,880 people reportedly found that Indian feet tend to be wider than Western feet. I could not find the survey itself or any length and width figures, so I cannot give an Indian average.
- Men’s feet are longer by about 27 mm at the median in the US Army survey, and by about 36 mm in the Iranian study. At the same foot length, women’s feet were about 4.3 mm narrower in a study of Chinese adults.
- Your feet are probably not the same length. A footwear research body says as many as 19% of people in the UK and at least 24% in China have feet differing by more than 4 mm, though it gives no sample size.
- Pregnancy can change feet. In 49 women, arch height fell and foot length rose between the first trimester and 19 weeks after birth, and the first pregnancy may matter most.
- I could not verify two popular claims: that average feet have grown over the decades, and any firm age at which feet stop growing. I explain what I found on each.
What I noticed while putting this together
I started by looking for an official number, because that’s the cleanest thing to cite. I couldn’t find one. No statistics office I checked publishes foot length, and that shaped everything else on this page.
The search results were the second surprise. Most of what comes up for “average foot size” is the same few paragraphs copied across unrelated websites, usually in shoe sizes. The one real page I read in full was careful about calling its numbers anecdotal, which I respect, but it still gave sizes where I wanted millimetres.
The best data was in places a shopper would never look: a paper on 1.2 million store scans, a table from an army survey, a few university studies. I opened each one rather than quote it second-hand wherever I could. For some, like the army table and the India survey, I could only get a secondary version, and I’ve said so next to every number.
I also did the arithmetic myself and kept it honest. The army table is in inches, so I converted everything at 25.4 mm per inch and re-ran the sums more than once. Where I’d added or subtracted rounded figures I checked them against the unrounded ones. In one Chinese study the published gap for the 240 mm class is 4.4 mm even though the two rounded means subtract to 4.5, so I kept the paper’s figure and noted the rounding in the dataset.
One more thing I took out. The Iran paper has a handy table comparing other countries. I couldn’t open the original studies behind it, so I left it out and only used what I could trace myself.
What we know about foot size and what we don’t
Here’s where the public evidence stands as of October 2026. No government statistics office publishes foot length that I could find, so everything rests on research, surveys and trade reports.
| Question | Evidence status | Why |
|---|---|---|
| Average foot length, men and women | Good estimate | About 270 and 245 mm in North America and Europe from 1.2 million scans, backed by an army survey |
| Average foot width | Estimate | Army medians and one student study; the scan study reports width by length class only |
| Official national average foot size | None found | No statistics office I checked publishes it |
| Average foot length for most countries | No verified figure | Usable data for North America, Europe and Asia as regions, and a few single studies |
| Men’s feet longer than women’s | Well supported | Every dataset I read shows it, by about 27 to 36 mm |
| Women’s feet narrower at the same length | One main study | Chinese adults; the scan study also found men wider in most length classes |
| Left and right feet differ | Trade article | No sample size or method given |
| Age at which feet stop growing | No verified figure | Only an India report of when the average peaks, with no measurements |
| Pregnancy and foot size | Small study | 49 women followed for about five months after birth |
| Feet getting bigger over time | Could not verify | The claims I found name no measured study |
15 foot size statistics you can cite
Each card has one number, one sentence of context and its source. “Copy text” opens a box with the sentence, the source and a link back here. Please cite the original source for any single statistic. Cards marked E are my own calculations, and the method is on the card or in the dataset.
In 1.2 million foot scans, the most frequent foot-length class in North America was 270 mm for men and 245 mm for women. Europe was the same. These are foot lengths, not shoe sizes (Jurca et al., 2019).
Copy text
270 mm / 245 mm most common foot length, North America: In 1.2 million foot scans, the most frequent foot-length class in North America was 270 mm for men and 245 mm for women. Europe was the same. These are foot lengths, not shoe sizes (Jurca et al., 2019). Source: Jurca et al., 2019 (DOI 10.1038/s41598-019-55432-z). Via UrbanStyle Footwear: https://urbanstylefootwear.com/foot-size-statistics/
In the same scans, the most frequent classes in Asia were 255 mm for men and 235 mm for women, about 15 mm and 10 mm shorter than in North America (Jurca et al., 2019; difference is my calculation).
Copy text
255 mm / 235 mm most common foot length, Asia: In the same scans, the most frequent classes in Asia were 255 mm for men and 235 mm for women, about 15 mm and 10 mm shorter than in North America (Jurca et al., 2019; difference is my calculation). Source: Jurca et al., 2019 (DOI 10.1038/s41598-019-55432-z). Via UrbanStyle Footwear: https://urbanstylefootwear.com/foot-size-statistics/
Only 20,805 of the 1,200,847 scans in the largest foot-scan study came from Asia, against 1,105,508 from North America (UrbanStyle calculation from Jurca et al., 2019).
Copy text
1.7% of the scans were from Asia: Only 20,805 of the 1,200,847 scans in the largest foot-scan study came from Asia, against 1,105,508 from North America (UrbanStyle calculation from Jurca et al., 2019). Source: UrbanStyle calculation. Via UrbanStyle Footwear: https://urbanstylefootwear.com/foot-size-statistics/
In the 2012 US Army survey, median foot length was 10.67 inches (271 mm) for men and 9.59 inches (244 mm) for women. It is a military sample, read through a summary table.
Copy text
271 mm / 244 mm median foot length, US Army survey: In the 2012 US Army survey, median foot length was 10.67 inches (271 mm) for men and 9.59 inches (244 mm) for women. It is a military sample, read through a summary table. Source: US Army survey (via NC State table) (Table row 30 and 31 (inches)). Via UrbanStyle Footwear: https://urbanstylefootwear.com/foot-size-statistics/
In the same survey, median foot breadth was 4.02 inches (102 mm) for men and 3.66 inches (93 mm) for women (my conversion from inches).
Copy text
102 mm / 93 mm median foot breadth, US Army survey: In the same survey, median foot breadth was 4.02 inches (102 mm) for men and 3.66 inches (93 mm) for women (my conversion from inches). Source: US Army survey (via NC State table) (Table row 30 and 31 (inches)). Via UrbanStyle Footwear: https://urbanstylefootwear.com/foot-size-statistics/
The US Army survey puts the 5th to 95th percentile of men's foot length at 9.84 to 11.54 inches, which is 250 to 293 mm. For women it is 226 to 268 mm (my conversion).
Copy text
250 to 293 mm middle 90% of men's foot lengths: The US Army survey puts the 5th to 95th percentile of men's foot length at 9.84 to 11.54 inches, which is 250 to 293 mm. For women it is 226 to 268 mm (my conversion). Source: US Army survey (via NC State table) (Table row 30 and 31 (inches)). Via UrbanStyle Footwear: https://urbanstylefootwear.com/foot-size-statistics/
In the US Army survey, the median man's foot was about 27 mm longer than the median woman's, and 9 mm wider (UrbanStyle calculation from the published medians).
Copy text
27 mm men's median foot is longer than women's: In the US Army survey, the median man's foot was about 27 mm longer than the median woman's, and 9 mm wider (UrbanStyle calculation from the published medians). Source: UrbanStyle calculation. Via UrbanStyle Footwear: https://urbanstylefootwear.com/foot-size-statistics/
In 580 students in Urmia, Iran, mean foot length was 270.03 mm for men and 234.35 mm for women (Hajaghazadeh et al., 2018). It is one city, not a national average.
Copy text
270.0 / 234.4 mm mean foot length, Iranian students: In 580 students in Urmia, Iran, mean foot length was 270.03 mm for men and 234.35 mm for women (Hajaghazadeh et al., 2018). It is one city, not a national average. Source: Hajaghazadeh et al., 2018 (Health Scope 7(3), e14063). Via UrbanStyle Footwear: https://urbanstylefootwear.com/foot-size-statistics/
In the same study, mean foot width was 100.44 mm for men and 89.17 mm for women, so men's feet were about 11 mm wider (difference is my calculation).
Copy text
100.4 / 89.2 mm mean foot width, Iranian students: In the same study, mean foot width was 100.44 mm for men and 89.17 mm for women, so men's feet were about 11 mm wider (difference is my calculation). Source: Hajaghazadeh et al., 2018 (Health Scope 7(3), e14063). Via UrbanStyle Footwear: https://urbanstylefootwear.com/foot-size-statistics/
Among 2,321 Chinese adults, women's feet were about 4.3 mm narrower than men's at foot lengths of 235, 240 and 245 mm (Hong et al., 2011).
Copy text
4.3 mm women's feet narrower at the same length: Among 2,321 Chinese adults, women's feet were about 4.3 mm narrower than men's at foot lengths of 235, 240 and 245 mm (Hong et al., 2011). Source: Hong et al., 2011 (DOI 10.1080/14763141.2011.569567). Via UrbanStyle Footwear: https://urbanstylefootwear.com/foot-size-statistics/
CSIR-CLRI scanned 101,880 people at 79 locations in five zones between December 2021 and March 2022, according to Business Today. It reports that Indian feet tend to be wider than Western feet.
Copy text
101,880 people scanned in India's foot survey: CSIR-CLRI scanned 101,880 people at 79 locations in five zones between December 2021 and March 2022, according to Business Today. It reports that Indian feet tend to be wider than Western feet. Source: CSIR-CLRI survey (via Business Today). Via UrbanStyle Footwear: https://urbanstylefootwear.com/foot-size-statistics/
The same report says average foot size peaks around age 11 for Indian women and age 15 or 16 for Indian men. It gives no lengths or widths.
Copy text
11 and 15 to 16 age when average foot size peaks in India: The same report says average foot size peaks around age 11 for Indian women and age 15 or 16 for Indian men. It gives no lengths or widths. Source: CSIR-CLRI survey (via Business Today). Via UrbanStyle Footwear: https://urbanstylefootwear.com/foot-size-statistics/
A SATRA Bulletin article says as many as 19% of people in the UK, and at least 24% in China, have feet that differ in length by more than 4 mm. It states no sample size.
Copy text
up to 19% UK people with feet 4 mm or more apart: A SATRA Bulletin article says as many as 19% of people in the UK, and at least 24% in China, have feet that differ in length by more than 4 mm. It states no sample size. Source: SATRA Bulletin, 2018. Via UrbanStyle Footwear: https://urbanstylefootwear.com/foot-size-statistics/
The same SATRA article says only about 1% of people worldwide have the same foot length on both feet, to the nearest 0.1 mm. It states no sample size.
Copy text
about 1% have identical foot lengths: The same SATRA article says only about 1% of people worldwide have the same foot length on both feet, to the nearest 0.1 mm. It states no sample size. Source: SATRA Bulletin, 2018. Via UrbanStyle Footwear: https://urbanstylefootwear.com/foot-size-statistics/
In 49 women measured in the first trimester and 19 weeks after birth, arch height fell and foot length rose, and the authors say the first pregnancy may be the most significant (Segal et al., 2013).
Copy text
49 women in the pregnancy foot study: In 49 women measured in the first trimester and 19 weeks after birth, arch height fell and foot length rose, and the authors say the first pregnancy may be the most significant (Segal et al., 2013). Source: Segal et al., 2013 (DOI 10.1097/PHM.0b013e31827443a9). Via UrbanStyle Footwear: https://urbanstylefootwear.com/foot-size-statistics/
What is the average foot length for adults?
Short answer. About 270 mm for men and 245 mm for women in North America and Europe, and about 255 mm and 235 mm in Asia. That is roughly 10.6 inches and 9.6 inches in the West. These are foot lengths, not shoe sizes.
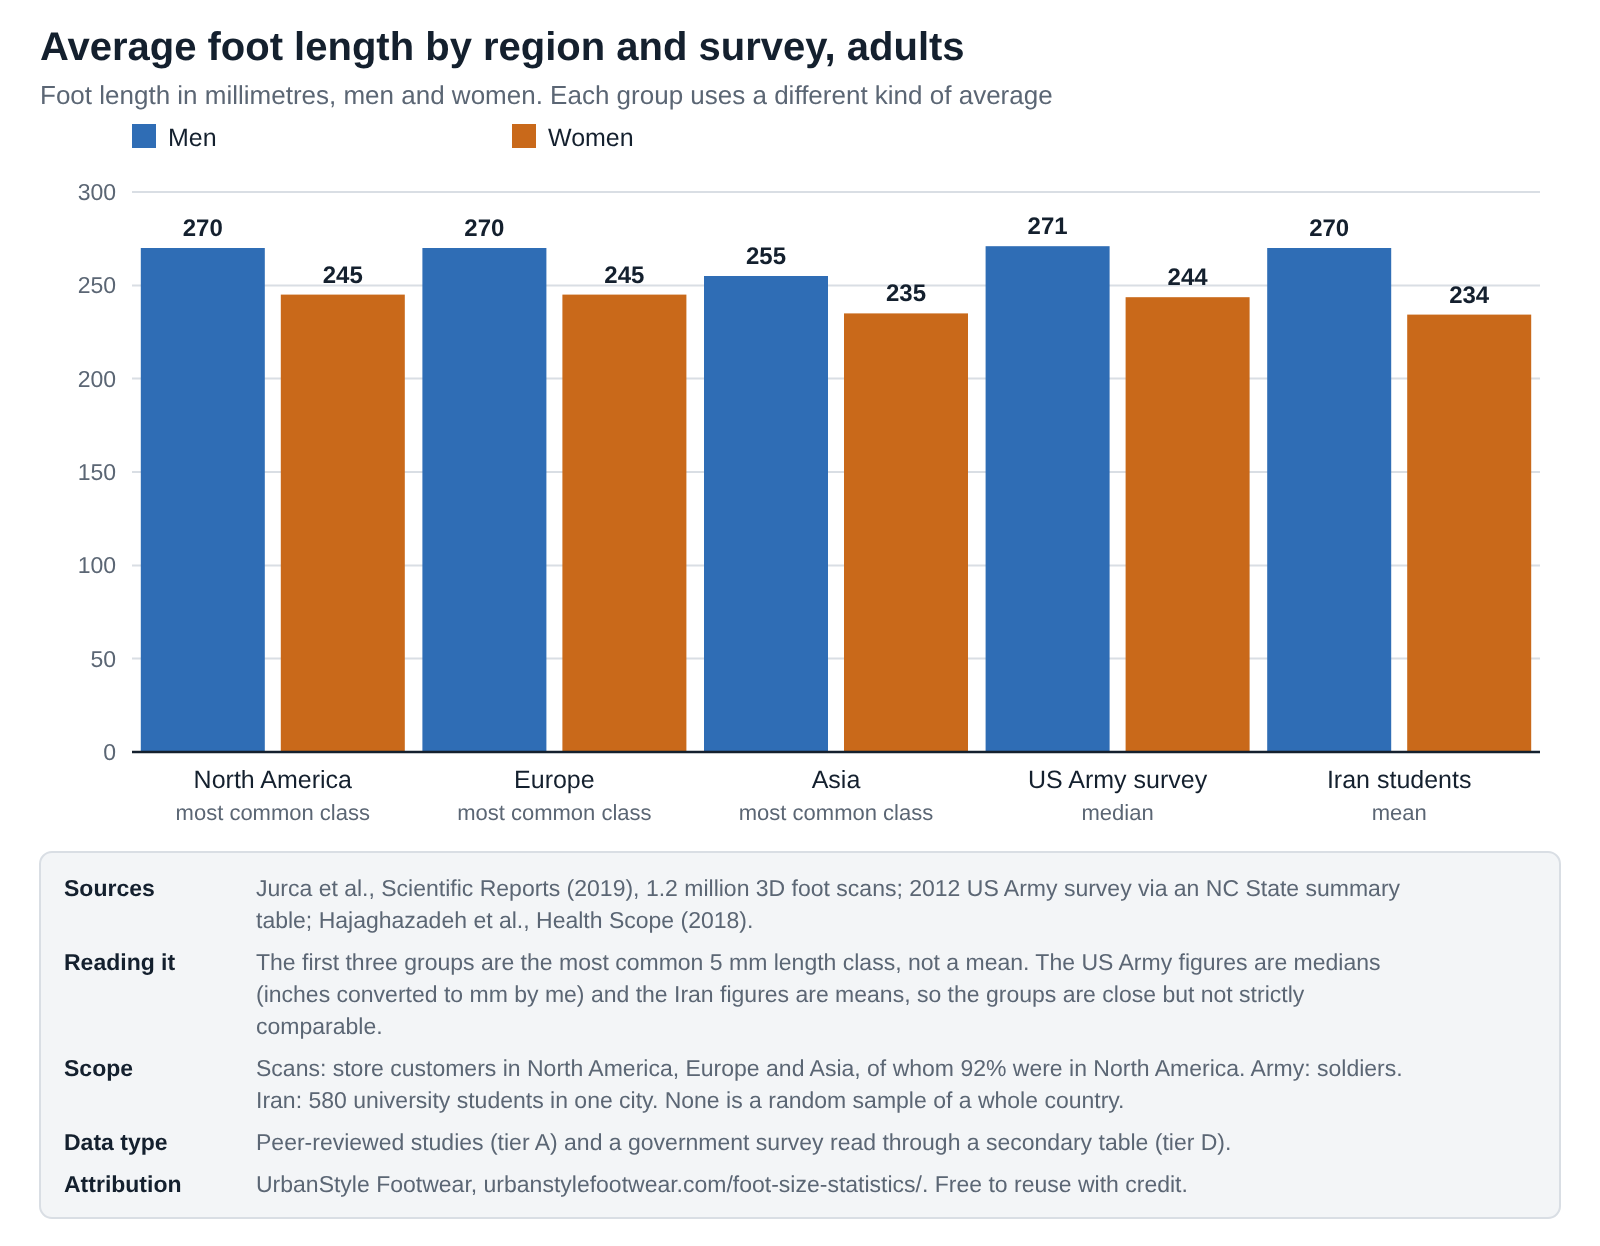
I looked for an official figure first and there isn’t one. The best measured source is a 2019 study in Scientific Reports that analysed 1,200,847 barefoot 3D scans of customers at 712 stores between November 2017 and August 2018. The chart below sets it beside the two other sources that report men’s and women’s length separately.
Embed this chart
<figure style="margin:0"><a href="https://urbanstylefootwear.com/foot-size-statistics/"><img src="https://urbanstylefootwear.com/wp-content/uploads/2026/10/usf-average-foot-length-by-region-men-women.png" alt="Chart of adult foot length: men about 270 mm and women 245 mm in North America and Europe, shorter in Asia" width="800" style="max-width:100%;height:auto"></a><figcaption>Source: UrbanStyle Footwear, based on Jurca et al. (2019), a 2012 US Army survey table and Hajaghazadeh et al. (2018). <a href="https://urbanstylefootwear.com/foot-size-statistics/">Foot Size Statistics 2026</a></figcaption></figure>Click the code, press Ctrl+C (Cmd+C on Mac), and paste it into any web page. Please keep the attribution link.
View as table
| Group | Men, mm | Women, mm | What the number is | Source |
|---|---|---|---|---|
| North America | 270 | 245 | most common class | Jurca et al., 2019 |
| Europe | 270 | 245 | most common class | Jurca et al., 2019 |
| Asia | 255 | 235 | most common class | Jurca et al., 2019 |
| US Army survey | 271 | 243.6 | median | US Army survey via NC State table (my conversion from inches) |
| Iran students | 270.03 | 234.35 | mean | Hajaghazadeh et al., 2018 |
A few things to know before you quote any of this. The first three pairs of bars aren’t averages. The scan study reports the most common foot-length class in 5 mm steps, so “270 mm” just means the biggest group of men fell in that class. It’s a good pointer to the middle, but it isn’t a mean. The scans also came from store customers, 92% of them in North America, with no ages recorded, and the authors say the long tail of short men’s lengths may include boys’ feet.
The US Army numbers are medians from a survey of soldiers, who are fitter and younger than the rest of us. I only found them as a table in inches, so I converted at 25.4 mm per inch myself. The Iran numbers are means from 580 university students in one city. That makes them a handy cross-check and nothing more.
What I noticed once they were side by side is how close they land. Men come out at 270 or 271 mm in all four of the Western and Iranian groups. Women are at 244 to 245 mm in North America, Europe and the army survey, and around 235 mm in Asia and Iran.
How wide is the spread?
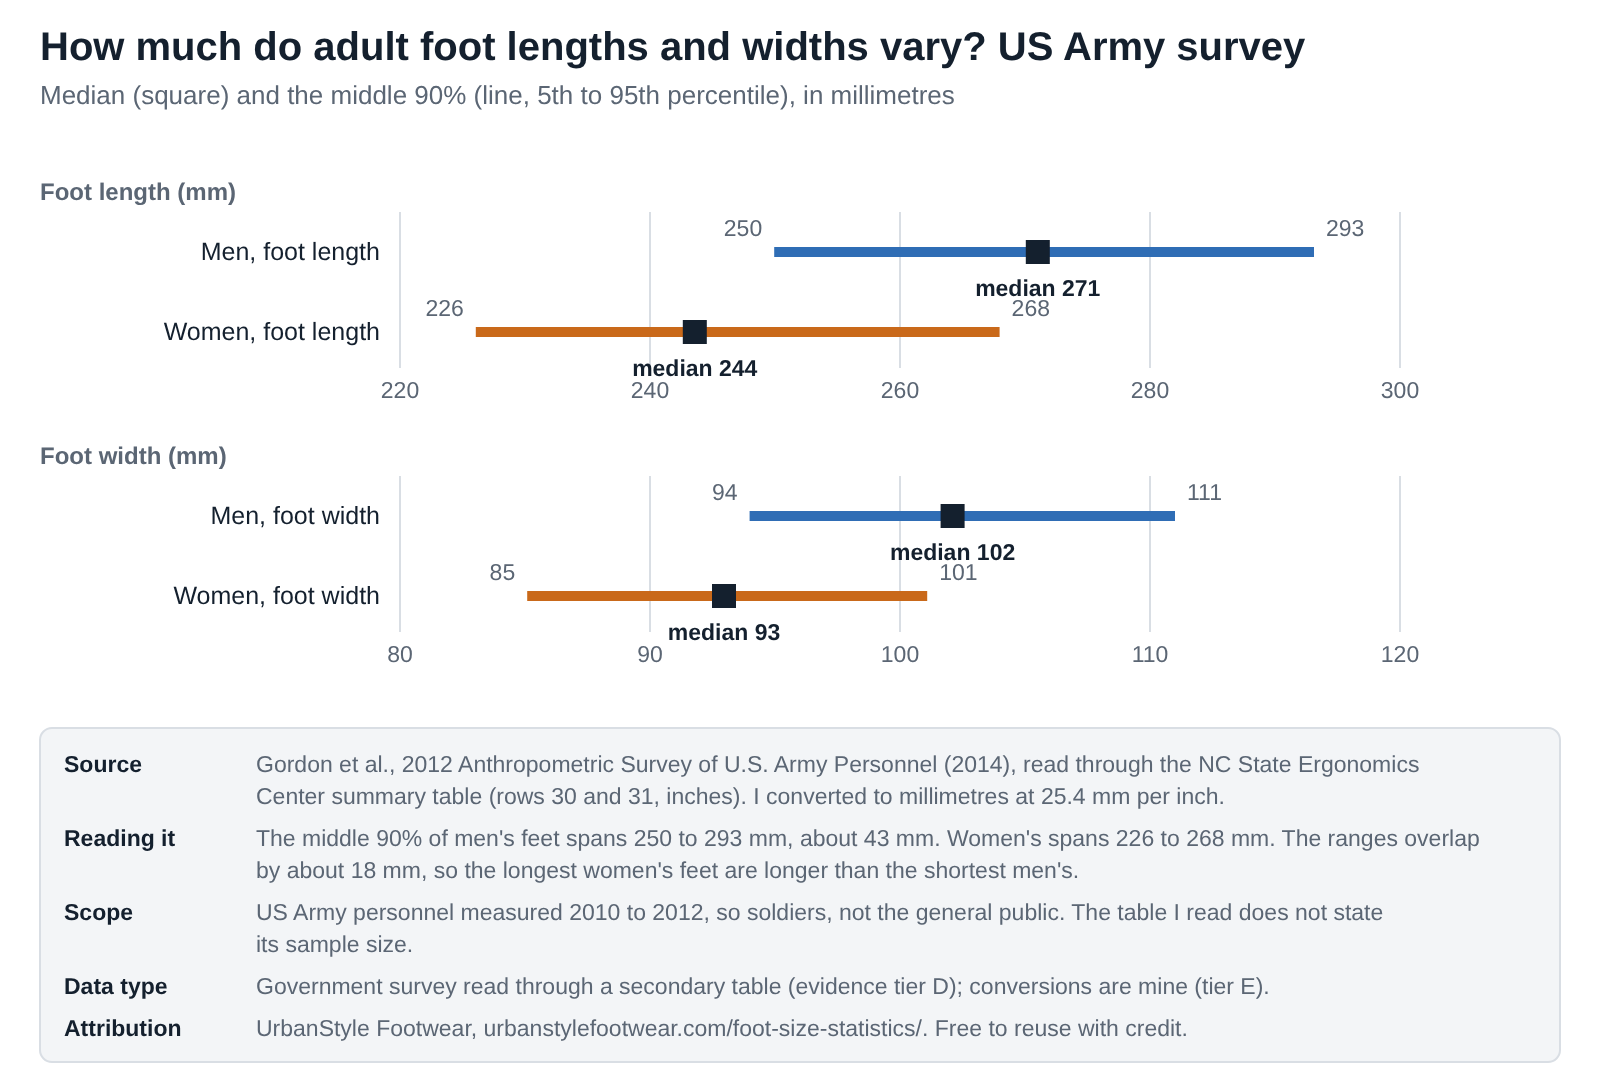
An average hides how much feet vary. The US Army table also gives percentiles, which show the range most adults fall into.
Embed this chart
<figure style="margin:0"><a href="https://urbanstylefootwear.com/foot-size-statistics/"><img src="https://urbanstylefootwear.com/wp-content/uploads/2026/10/usf-foot-length-and-width-range-us-army-survey.png" alt="Chart of adult foot length ranges in a US Army survey: men 250 to 293 mm, women 226 to 268 mm, plus widths" width="800" style="max-width:100%;height:auto"></a><figcaption>Source: UrbanStyle Footwear, based on the 2012 US Army anthropometric survey (via an NC State summary table). <a href="https://urbanstylefootwear.com/foot-size-statistics/">Foot Size Statistics 2026</a></figcaption></figure>Click the code, press Ctrl+C (Cmd+C on Mac), and paste it into any web page. Please keep the attribution link.
View as table
| Group | 5th percentile, mm | Median, mm | 95th percentile, mm | Source |
|---|---|---|---|---|
| Men, foot length | 250 | 271 | 293 | US Army survey via NC State table (my conversion from inches) |
| Women, foot length | 226 | 244 | 268 | US Army survey via NC State table (my conversion from inches) |
| Men, foot breadth | 94 | 102 | 111 | US Army survey via NC State table (my conversion from inches) |
| Women, foot breadth | 85 | 93 | 101 | US Army survey via NC State table (my conversion from inches) |
For men, the middle 90% of foot lengths ran from 250 to 293 mm, about 43 mm, with a median of 271 mm. For women it was 226 to 268 mm around a median of 244 mm. The standard deviations were about 13 and 12 mm.
The two ranges overlap. The longest 5% of women’s feet in the survey were about 18 mm longer than the shortest 5% of men’s (my calculation). When I first subtracted the rounded millimetre figures I got 18.1, and recomputing from the original inch values gave 18.0, so I say “about 18”.
What you can safely say. “In a study of 1.2 million foot scans, the most common foot length for men in North America and Europe was 270 mm and for women 245 mm.” Name the source, and say foot length, not shoe size.
My read. If you only need one number, 270 and 245 mm is a fair centre for the West. But a 43 mm spread means “average” will not help you pick a size. Your own measurement will.
Sources: Jurca et al., Scientific Reports, 2019 (tier A); Gordon et al., 2012 Anthropometric Survey of U.S. Army Personnel, read through an NC State Ergonomics Center table (tier D); Hajaghazadeh et al., Health Scope, 2018 (tier A). Conversions and differences are mine (tier E).What is the average foot width?
Short answer. The US Army survey’s median foot breadth was about 102 mm for men and 93 mm for women. Iranian students averaged 100.4 mm and 89.2 mm. Width rises with length, so width at your own length matters more than any single average.
Width is harder to compare than length because studies measure it at different points on the foot. I would not mix numbers from two studies in one calculation.
In the US Army survey, median foot breadth was 4.02 inches (102 mm) for men and 3.66 inches (93 mm) for women, with the middle 90% running from 94 to 111 mm for men and 85 to 101 mm for women (my conversion). The Iranian students averaged 100.44 mm and 89.17 mm, a gap of about 11 mm.
The scan study doesn’t give an overall width. It reports width within each length class instead. For North American men in the 270 mm class the mean was 102.0 mm, and the 5th to 95th percentile ran from 94.4 to 110.2 mm. That 16 mm spread among men with the same foot length is the part I’d remember. It’s why a size based on length alone can fit badly.
The same study found European feet had a higher instep than North American feet in every male length class, and men had higher insteps than women in most classes.
What you can safely say. “In a US Army survey, median foot breadth was about 102 mm for men and 93 mm for women.” Say it is a military sample.
How does foot size differ around the world?
Short answer. Feet in Asia were shorter and, in most length classes, wider than in North America and Europe in the one large study that compares them. India reportedly has wider feet than the West. For most other countries I found no usable measured average.
This is where I could do the least, and I’d rather say so than fill the page with guesses. Pick a dataset below to see who was measured and where it falls short.
See what each study measured and where it falls short
Choose a dataset to see who was measured, what it found and how I would read it.
Select a dataset above.
1.2M foot scans. November 2017 to August 2018. 1,200,847 barefoot 3D scans of customers at 712 stores: 1,105,508 in North America, 74,534 in Europe and 20,805 in Asia. The most common foot-length class was 270 mm for men and 245 mm for women in North America and Europe, and 255 mm and 235 mm in Asia. How to read it: Peer-reviewed (tier A) and the largest source I found, but it measures shoppers in a retail store, not a random sample, and records no age. The Asian share is under 2% of scans. It reports a most common class, not a mean. The lead author has a financial interest in the scanner maker.
US Army survey. 2010 to 2012, published 2014. Median foot length of 271 mm for men and 244 mm for women, and median foot breadth of 102 mm and 93 mm, with 5th to 95th percentile ranges for each. How to read it: A government measurement survey, but I read it through an NC State summary table (tier D) and could not open the original table. It measures soldiers, who are not the general public, and it was converted from inches by me.
India survey. December 2021 to March 2022. CSIR-CLRI scanned 101,880 people at 79 locations in five zones. As reported, Indian feet tend to be wider than Western feet, and average foot size peaks around age 11 for women and 15 or 16 for men. How to read it: Secondary reporting (tier D). I did not find the survey itself or any length and width figures, so I cannot give an Indian average. The proposed Bha system (eight sizes) was still a proposal in the April 2024 report I read.
Iran students. 2018 study. 580 university students aged 18 to 30 in Urmia: mean foot length 270.0 mm for men and 234.4 mm for women, and mean width 100.4 mm and 89.2 mm. How to read it: Peer-reviewed (tier A) but one city and a young student group, so it is not a national average. It is useful because it reports means, which the scan study does not.
| Region | What I found | Strength of the evidence |
|---|---|---|
| North America | 1,105,508 scans (92% of the scan study) plus the US Army survey: men about 270 to 271 mm, women about 244 to 245 mm | Strong on sample size, but shoppers and soldiers |
| Europe | 74,534 scans from 22 countries: same most common classes as North America, higher instep | Good, but no country breakdown in the paper |
| East and Southeast Asia | 20,805 scans from seven countries: men 255 mm, women 235 mm, wider in most classes. A study of 2,321 Chinese adults and the 4,045-adult Size Korea data add detail but no averages I could read | Moderate; small share of scans |
| South Asia (India) | 101,880 people scanned in 2021 and 2022, wider than Western feet, but no lengths or widths reported | Large survey, secondary reporting only |
| Middle East | 580 students in Urmia, Iran: men 270.0 mm, women 234.4 mm | One city and young adults |
| Africa, Latin America, Oceania | Nothing I could use. A forensic study from Nigeria and one from Turkey did not report means in the text I could read | No verified figure |
Start with Asia against the West. The most common length was 15 mm shorter for men (255 against 270 mm) and 10 mm shorter for women (235 against 245 mm), and in most length classes Asian feet were wider, except for men at 295 and 300 mm. But Asia is a thin slice of that study: 20,805 of 1,200,847 scans, about 1.7% (my calculation), from China, Japan, Korea, Malaysia, Singapore, Taiwan and Thailand. It says nothing about India or the Middle East.
For India, a reported survey by CSIR-CLRI scanned 101,880 people at 79 locations between December 2021 and March 2022. As reported, average foot size peaks around age 11 for women and 15 or 16 for men. A proposed Indian sizing system called Bha would have eight sizes, and in the April 2024 report I read it was still a proposal. I didn’t find a notified standard. My Indian vs UK shoe size guide covers the sizing side.
Korea is the one I wanted most and couldn’t get. A 2026 paper uses foot data from 4,045 adults aged 20 to 59 in the 8th Size Korea survey (2020 to 2023) and finds four foot-shape groups for each sex, but I couldn’t read average lengths from it.
My read. The pattern that holds up is small: Asian feet run shorter and broader, Western feet longer and higher in the instep. Beyond that, I would not quote a national average for a country unless someone can show me the measurement.
Sources: Jurca et al. (tier A); US Army survey via NC State table (tier D); Business Today report on the CSIR-CLRI survey (tier D); Kim, 2026, via a citation page (tier D); Hajaghazadeh et al. (tier A); Hong et al. (tier A). Shares are my calculations (tier E).How do men’s and women’s feet differ?
Short answer. Men’s feet are longer by about 27 mm at the median in the US Army survey and about 36 mm in the Iranian study, and men’s feet are wider. At the same foot length, women’s feet were about 4.3 mm narrower in a Chinese study.
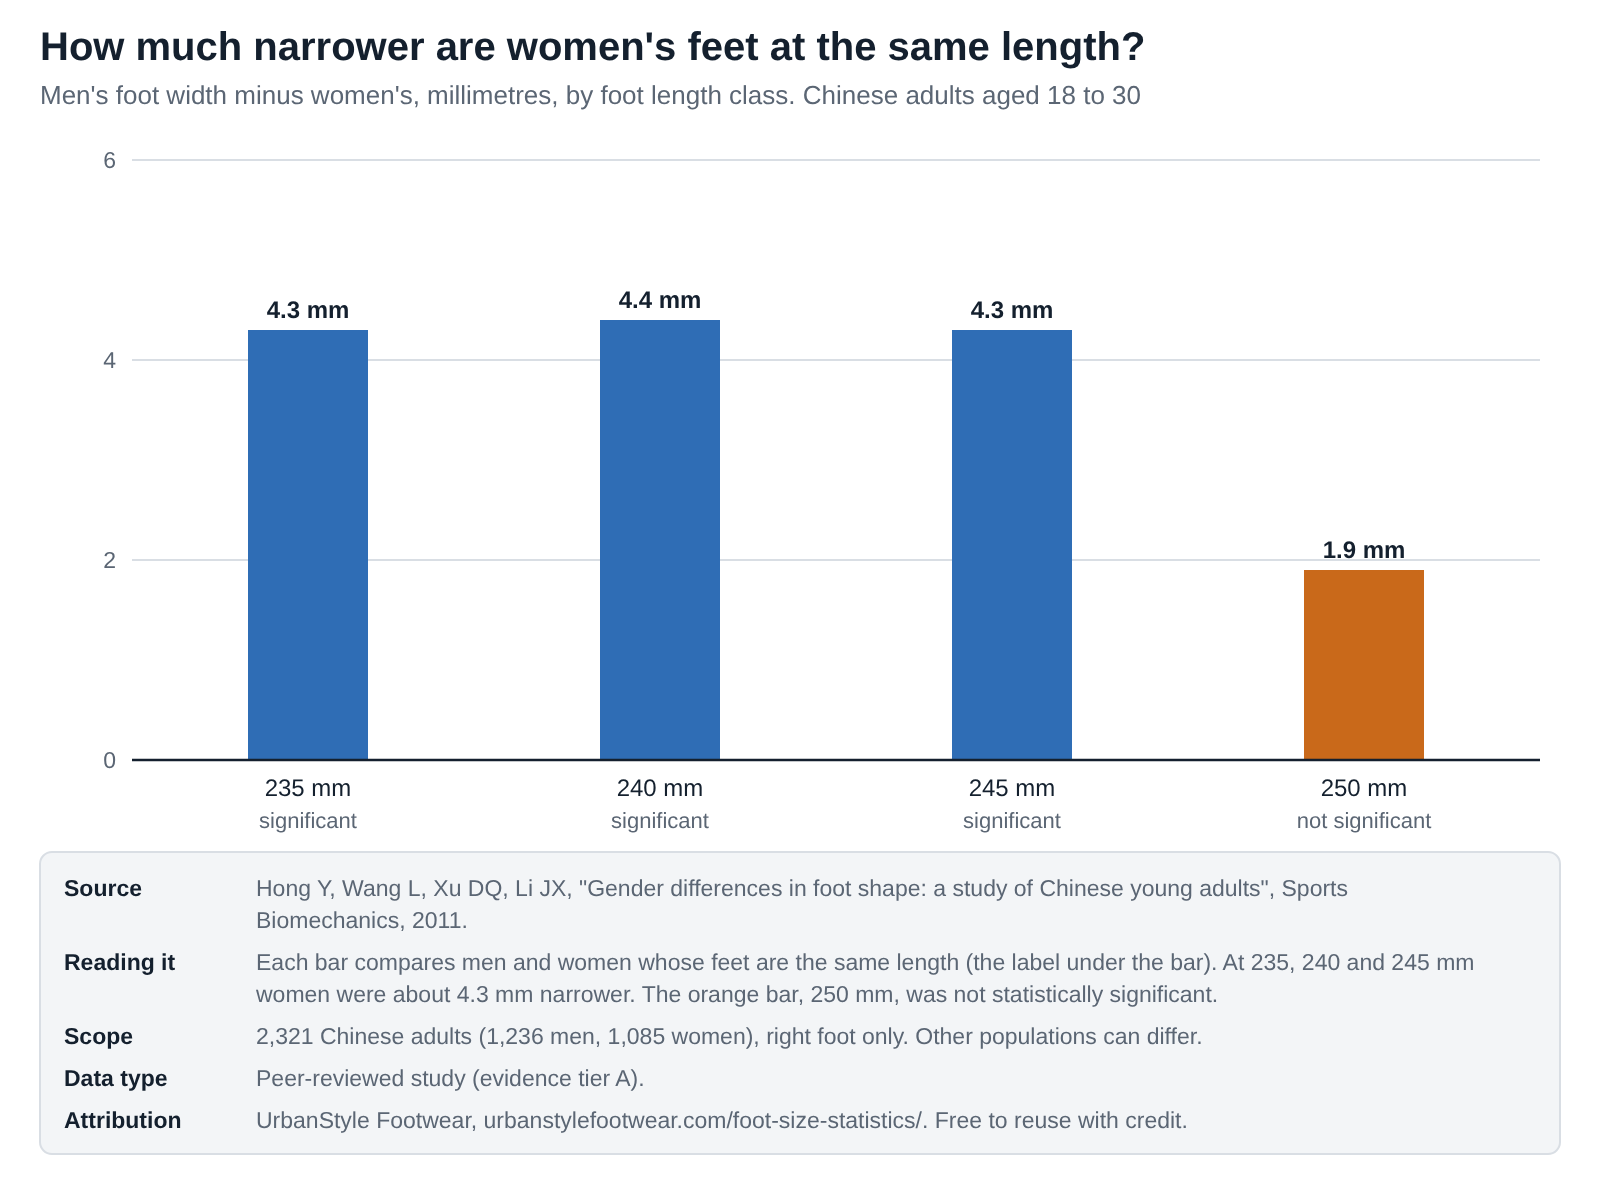
The length gap is the easy part. The more useful finding is about shape, because it affects how a “women’s” shoe fits a woman with a long foot.
Embed this chart
<figure style="margin:0"><a href="https://urbanstylefootwear.com/foot-size-statistics/"><img src="https://urbanstylefootwear.com/wp-content/uploads/2026/10/usf-womens-feet-narrower-than-mens-at-same-length.png" alt="Chart of women's feet being about 4.3 mm narrower than men's at the same foot length, in 2,321 Chinese adults" width="800" style="max-width:100%;height:auto"></a><figcaption>Source: UrbanStyle Footwear, based on Hong et al. (2011), 2,321 Chinese adults. <a href="https://urbanstylefootwear.com/foot-size-statistics/">Foot Size Statistics 2026</a></figcaption></figure>Click the code, press Ctrl+C (Cmd+C on Mac), and paste it into any web page. Please keep the attribution link.
View as table
| Foot length class, mm | Men width, mm | Women width, mm | Difference, mm | Statistically significant |
|---|---|---|---|---|
| 235 | 91.4 | 87.1 | 4.3 | Yes |
| 240 | 92.5 | 88.0 | 4.4 | Yes |
| 245 | 93.3 | 89.0 | 4.3 | Yes |
| 250 | 94.1 | 92.2 | 1.9 | No |
On length, the median was 271 mm against 244 mm in the US Army survey, a gap of 27.4 mm, and 270.0 against 234.4 mm in Iran, a gap of 35.7 mm (my calculations).
Width at the same length is the better finding. Hong and colleagues compared Chinese men and women whose feet were the same length, and women’s feet were about 4.3 mm narrower at 235, 240 and 245 mm. At 250 mm the 1.9 mm gap wasn’t statistically significant. The scan study points the same way: men were wider and had higher insteps in most length classes from about 245 to 280 mm, while heel width differences were described as practically negligible.
The Chinese authors argue that women’s shoe lasts made by grading down men’s lasts may not suit women’s feet. That’s their reading and I haven’t tested it. I’d also keep in mind that the width result rests mainly on one study of young Chinese adults, so it may look different elsewhere.
Sources: Hong et al., Sports Biomechanics, 2011 (tier A); Jurca et al., 2019 (tier A); US Army survey via NC State table (tier D); Hajaghazadeh et al., 2018 (tier A). Differences are my calculations (tier E).Are your left and right feet the same size?
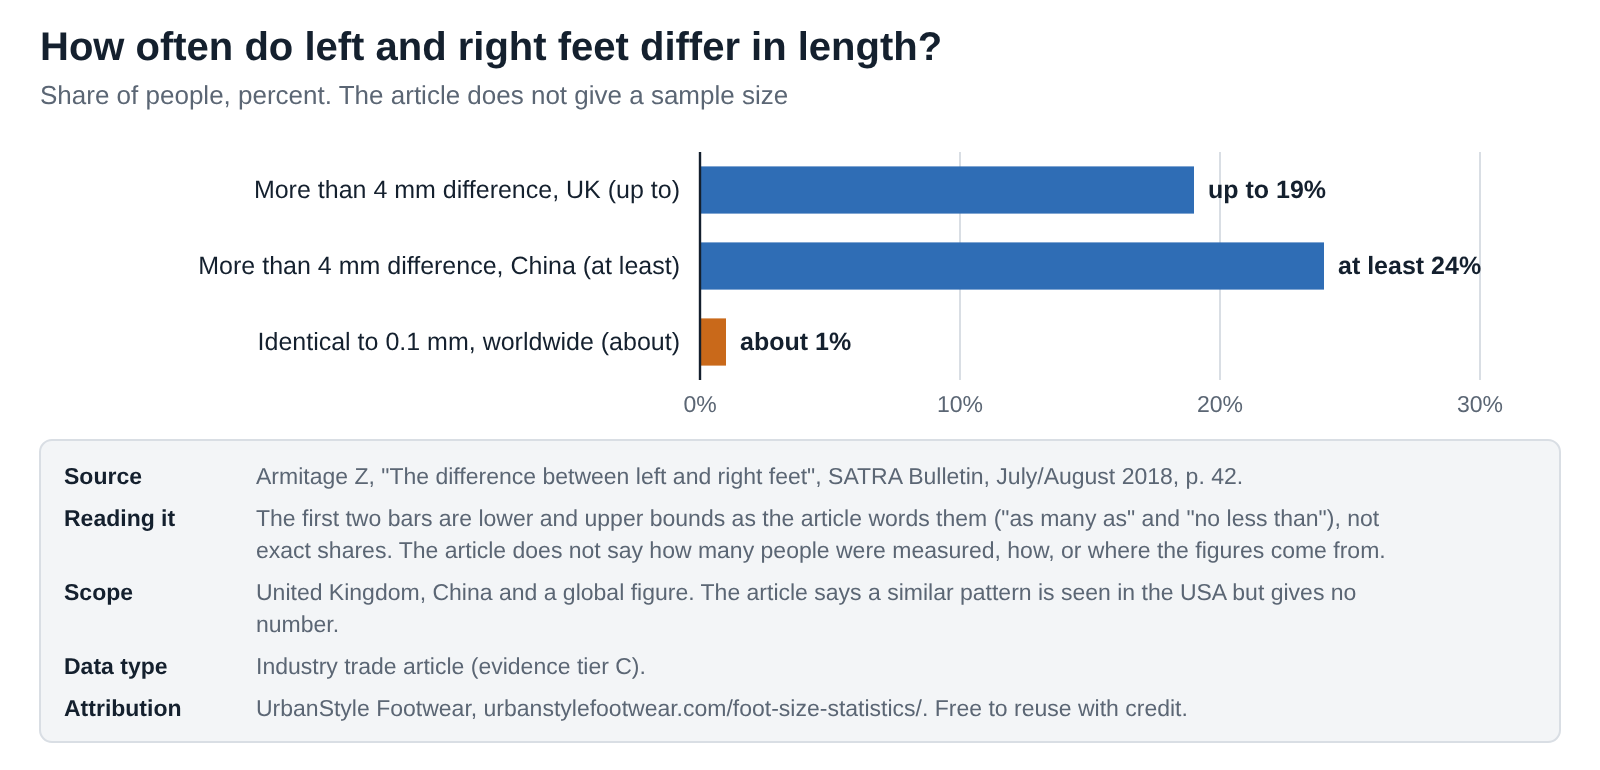
Short answer. Usually not quite. A SATRA article says as many as 19% of people in the UK and at least 24% in China have feet that differ in length by more than 4 mm, and only about 1% are identical. It gives no sample size, so take it as an indication.
SATRA is a footwear research body, and the figures come from its Bulletin, July and August 2018. I could not find the underlying measurements, so I give it a tier C and don’t build anything else on it.
Embed this chart
<figure style="margin:0"><a href="https://urbanstylefootwear.com/foot-size-statistics/"><img src="https://urbanstylefootwear.com/wp-content/uploads/2026/10/usf-left-and-right-foot-length-difference.png" alt="Chart of feet differing over 4 mm in length: up to 19% in the UK, at least 24% in China, about 1% identical" width="800" style="max-width:100%;height:auto"></a><figcaption>Source: UrbanStyle Footwear, based on the SATRA Bulletin (2018), sample size not stated. <a href="https://urbanstylefootwear.com/foot-size-statistics/">Foot Size Statistics 2026</a></figcaption></figure>Click the code, press Ctrl+C (Cmd+C on Mac), and paste it into any web page. Please keep the attribution link.
View as table
| Measure | Share of people | Basis |
|---|---|---|
| More than 4 mm difference, UK (up to) | up to 19% | SATRA Bulletin, 2018; sample size and method not stated |
| More than 4 mm difference, China (at least) | at least 24% | SATRA Bulletin, 2018; sample size and method not stated |
| Identical to 0.1 mm, worldwide (about) | about 1% | SATRA Bulletin, 2018; sample size and method not stated |
4 mm is small enough that most people never notice it, yet it can make one shoe feel tighter than the other. The article says typically only around 1% of people have the same foot length on both feet to the nearest 0.1 mm, which is a very strict meaning of “the same”. It says a similar pattern shows up in the USA but gives no figure.
Two small studies I read only at abstract level point the same way: a Turkish study of 134 students found women’s right feet significantly longer than their left, and a Nigerian study found significant left-right differences in women. Neither gave figures I could use.
My read. The practical rule is the one shoe fitters give: measure both feet and fit the larger one. The numbers just show how common it is.
Sources: SATRA Bulletin, 2018 (tier C); two small forensic studies read at abstract or excerpt level, not used for figures.Does foot size change with age or pregnancy?
Short answer. Feet grow through childhood and the teens, and they can change in adulthood. In a study of 49 women, arch height fell and foot length rose between early pregnancy and 19 weeks after birth. I found no reliable figure for the exact age feet stop growing.
The India survey report says average foot size peaks around age 11 for women and age 15 or 16 for men. It gives no measurements and I haven’t seen the survey, so I treat it as a pointer, not a rule. The big scan study can’t help here because it recorded no ages.
On pregnancy, Segal and colleagues measured 49 women in the first trimester and again 19 weeks after birth. Arch height and rigidity fell, and foot length and arch drop rose. They write that pregnancy “seems to be associated with a permanent loss of arch height” and that the first pregnancy may matter most. The abstract gives no length figures, and I haven’t seen what happens years later.
I found small studies of older adults, but none with figures I could check at the source, so I left them out.
Children’s feet need their own tables, because the answer depends on age in months and years. See my children’s shoe size chart.
Sources: Segal et al., American Journal of Physical Medicine and Rehabilitation, 2013 (tier A); Business Today on the CSIR-CLRI survey (tier D); Jurca et al., 2019 (tier A).Are people’s feet getting bigger?
Short answer. I couldn’t verify it. The claims I found name no measured study, so I don’t state it as fact.
You will see this claim often, usually as a number. I traced two versions.
- British sizes up by two. A footwear website’s news page says British feet “get two sizes bigger in 40 years”, with men moving from size 8 in 1970 to 10 and women from 4 to 6. It credits the College of Podiatry and a poll of 2,000 adults, links no study and shows no date.
- American women’s feet. One health site says American women’s feet are larger than decades ago and links it to rising height and weight. It lists an industry article among its sources, which I did not read.
- Why it is hard to prove. Shoe size labels are not stable measurements. To show feet have grown you need foot lengths measured the same way in comparable groups years apart, and I haven’t found that.
My read. It may well be true, because average height has risen in many countries. But “may be true” is not a statistic, and I’d rather leave it out than repeat a number nobody can trace.
Sources: Buckbootz news page citing the College of Podiatry (tier D); a health website’s women’s shoe size page (read, not used for figures).Is foot size the same as shoe size?
No, and mixing them is behind most of the confusion you see online. Foot size is a measurement of the foot in millimetres or centimetres. Shoe size is a label that differs between countries and between brands, and it is built around the shoe’s shape (its last), not only your foot. There is no official US average shoe size, which I cover on my shoe size statistics page.
- All the lengths on this page are foot lengths from measurement studies.
- To turn a foot length into a size, use the conversion calculator or the international shoe size chart, then check the brand’s own chart.
- For measuring at home, see my foot measuring guide.
Why do foot size statistics from different websites disagree?
Short answer. They measure different people, report different kinds of average, and often mix foot length, shoe size and insole length.
Almost every mismatch I hit came down to one of these eight.
| Reason | Example from my research | What to do |
|---|---|---|
| Most common class, median or mean | 270 mm (most common class, scans), 271 mm (median, army) and 270.0 mm (mean, Iran) | Say which kind of average it is |
| Who was measured | Store customers, soldiers, university students | Name the group |
| Sample size | 1,200,847 scans, 101,880 people and 580 students | Give more weight to larger, better-described samples |
| Foot length, shoe size or insole | 245 mm foot length is not a size label | Keep them separate |
| Method and device | 3D scanners, calipers and video, all in the studies here | Compare like with like |
| One foot or both | Iran and the Chinese study measured the right foot; the scan study scanned both | Fit the larger foot |
| Age mix | The scan study records no age; the students were 18 to 30 | Check for children’s feet in the data |
| Units and rounding | The army table is in inches; the scan classes are 5 mm steps | Convert carefully and say so |
What you can safely say. “There is no official average foot size. Published figures differ because studies measure different groups in different ways.” Then name the figure you’re quoting and its source.
Who measures what?
Foot data comes from five kinds of source, and each answers a different question. No official statistics body appears, which is why this page rests on research. Select a step to see what it covers and how I use it.
1Large foot-scan studiesJurca et al. (Volumental scanners) and the Indian CSIR-CLRI survey
Scan the feet of people in stores or at survey sites, which gives the biggest samples: 1.2 million scans in one case and 101,880 people in the other. They are not random samples and often record little about age, so they describe shoppers or volunteers, not whole populations.
2Government measurement surveysUS Army anthropometric survey, Size Korea
Measure a planned sample of people with trained staff and fixed methods. The US Army survey covers soldiers only, and I read it through a summary table. Size Korea is a national survey, but I only found a paper that uses it, not the figures.
3University measurement studiesHajaghazadeh et al. (Iran) and Hong et al. (China)
Measure students or young adults with calipers or cameras, usually at one site. They report means and sex differences carefully, but they cannot stand in for a whole country.
4Trade-body articlesSATRA Bulletin
SATRA is a footwear research body. Its article gives left-right difference shares but not how many people were measured, so I treat it as an indication only.
5Press reports of surveysBusiness Today on the CLRI survey
Summarise surveys I could not open. I use them only for facts the report states plainly, such as the sample size and the finding that Indian feet are wider, and I mark them tier D. No official statistics body publishes foot length.
How good is the evidence behind foot size statistics?
Short answer. Mostly peer-reviewed research, and none of it official. Of the 52 rows in this page’s dataset, 56% are peer-reviewed (tier A), 25% are secondary reporting (tier D), 13% are my calculations (tier E) and 6% are industry research (tier C). There are no official statistics (tier B).
| Evidence tier | Rows | Share |
|---|---|---|
| A Peer-reviewed research | 29 | 56% |
| B Official statistics | 0 | 0% |
| C Industry research and company statements | 3 | 6% |
| D Secondary reporting | 13 | 25% |
| E UrbanStyle calculations | 7 | 13% |
| Total | 52 | 100% |
- Tier A leans on one study. The 1.2 million scans make up many of the rows, so the count overstates how many independent sources there are. Nine sources sit behind the whole page.
- Tier D matters. The US Army survey and the India survey are the ones I could only read second-hand, and they carry key figures.
- Counts are not quality scores. A tier A row is not automatically right for your question. The tier tells you where to look first.
What I’m watching next
I don’t forecast. These are the things that would change this page, and what I’ll do if they appear.
- Published figures from India’s foot survey. If CSIR-CLRI releases lengths and widths, I’ll add an Indian average and replace the secondary report.
- Whether the Bha sizing system is notified. I found no notified standard in the reports I read. I’ll update the note when that changes.
- Size Korea results. If the 8th survey’s foot means are published in a form I can read, I’ll add Korea.
- Any national foot survey from Europe, Latin America, Africa or Oceania that reports means by sex and age.
- Repeated measurements over time. That is what would let me say whether feet are getting bigger.
- Corrections. If you know a measured source I missed, email me.
Every change goes in the freshness log.
Where other foot size articles go wrong
I read one popular health-site page in full and looked at the search results for “average foot size”. Most results were copies of the same text on unrelated websites. Some of what follows I saw, and the rest are traps that are easy to fall into. This is not a complete audit of anyone’s work.
- Problem 1Shoe sizes presented as foot size, even though size labels differ by country and brand.
- Problem 2“Average” sizes taken from salespeople’s impressions, not measurements, with no method.
- Problem 3The claim that feet are getting bigger with no measured source behind it.
- Problem 4Width mostly ignored, even though it is where feet differ most for the same length.
- Problem 5Three countries shown as “the world”, and one country’s data presented as global.
- Problem 6Small samples, such as students or soldiers, presented as national averages.
- Problem 7No downloadable data, so nobody can check or reuse the numbers.
How can you use these numbers when buying shoes?
This is practical advice, separate from the research. It reflects what the studies do and don’t show, plus my own opinions where I say so.
- Measure both feet, in millimetres. Many people have feet that differ, so fit the larger one. My foot measuring guide shows how.
- Measure width as well as length. Among men with the same foot length, the middle 90% spanned about 16 mm in width, so a length-only size can still fit badly. See my shoe width guide.
- Don’t pick a size from the average. The middle 90% of men’s feet spans about 43 mm, so an average says little about yours.
- Convert from millimetres, not from a size. Use foot length with the conversion calculator when you shop across countries, then check the brand’s chart.
- Re-measure after pregnancy. The one study I found suggests arch and length can change, so don’t assume your old size still fits.
- If you are a woman with long or broad feet, check the men’s range as well as the women’s. The overlap between the two is about 18 mm of foot length, and that’s my reading, not a rule.
- Know the return policy. Fit is the usual reason shoes come back. See my shoe return statistics.
Sources and evidence tiers
Evidence hierarchy
- APeer-reviewed research. Original measurement studies in journals: the 1.2 million scan study, the Chinese foot-shape study, the Iranian study and the pregnancy study.
- BOfficial statistics. None. No statistics office I checked publishes foot length.
- CIndustry research and trade statements. The SATRA Bulletin article. Useful, but the sample size and method are not shown.
- DSecondary reporting. A government survey I read through a summary table, press reports of the Indian and Korean surveys, and a news page citing a poll.
- EEstimates and calculations. My own conversions and differences, with the method stated.
Primary versus secondary data
Primary source: the organisation or researchers who collected the data. Secondary source: an article or table summarising someone else’s data. Where I could only read a secondary source, the table says so.
Source table
| Source | Year | Sample | Geography | Finding used | Tier | Series ID | Primary source |
|---|---|---|---|---|---|---|---|
| Jurca A, Zabkar J, Dzeroski S, "Analysis of 1.2 million foot scans from North America, Europe and Asia", Scientific Reports, 2019 | 2019 | 1,200,847 3D foot scans of customers at 712 stores, Nov 2017 to Aug 2018 (North America 1,105,508; Europe 74,534; Asia 20,805) | North America, Europe, Asia | Most frequent foot-length class: men 270 mm and women 245 mm in North America and Europe; men 255 mm and women 235 mm in Asia. Asian feet were wider in most length classes | A | DOI 10.1038/s41598-019-55432-z | Jurca et al. (PMC) |
| Hong Y, Wang L, Xu DQ, Li JX, "Gender differences in foot shape: a study of Chinese young adults", Sports Biomechanics, 2011 | 2011 | 2,321 Chinese adults aged 18 to 30 (1,236 men, 1,085 women), right foot, 3D video method | China | At foot lengths of 235, 240 and 245 mm, women's feet were about 4.3 mm narrower than men's; the difference at 250 mm was not significant | A | DOI 10.1080/14763141.2011.569567 | Hong et al. (DOI) |
| Segal NA, Boyer ER, Teran-Yengle P, Glass N, Hillstrom HJ, Yack HJ, "Pregnancy leads to lasting changes in foot structure", American Journal of Physical Medicine and Rehabilitation, 2013 | 2013 | 49 women measured in the first trimester and at 19 weeks after birth | United States | Arch height and rigidity fell and foot length rose; the authors say the first pregnancy may be the most significant | A | DOI 10.1097/PHM.0b013e31827443a9 | Segal et al. (DOI) |
| Hajaghazadeh M, Emamgholizadeh Minaei R, Allahyari T, Khalkhali H, "Anthropometric Dimensions of Foot in Northwestern Iran and Comparison with Other Populations", Health Scope, 2018 | 2018 | 580 university students aged 18 to 30 in Urmia (290 men, 290 women), right foot | Iran | Mean foot length 270.03 mm for men and 234.35 mm for women; mean foot width 100.44 mm and 89.17 mm | A | Health Scope 7(3), e14063 | Hajaghazadeh et al. (Brieflands) |
| Gordon CC et al., "2012 Anthropometric Survey of U.S. Army Personnel: Methods and Summary Statistics" (Natick TR-15/007, 2014), read through an NC State Ergonomics Center summary table | 2012 | US Army personnel measured 2010 to 2012. The public ANSUR II data has 4,082 men and 1,986 women; the table I read does not state its sample | United States (military) | Median foot length 10.67 in (271 mm) for men and 9.59 in (244 mm) for women; median foot breadth 4.02 in (102 mm) and 3.66 in (93 mm) | D | Table row 30 and 31 (inches) | NC State summary table |
| Business Today, "Indians to have new shoe sizing system as Bha set to replace EU/UK/US sizes" (April 23, 2024), reporting a CSIR-Central Leather Research Institute survey | 2024 | 101,880 people scanned at 79 locations in five zones, December 2021 to March 2022, 3D scanners | India | Indian feet tend to be wider than Western feet; average foot size peaks around age 11 for women and 15 or 16 for men; a proposed Bha system has eight sizes | D | n/a | Business Today report |
| Kim J-H, "Anthropometric classification of foot morphology in Korean adults using K-means cluster analysis" (2026), read through a citation page; journal not shown there | 2026 | Foot data from 4,045 adults aged 20 to 59 in the 8th Size Korea Anthropometric Survey, 2020 to 2023 | South Korea | Four foot-shape clusters were found for each sex | D | ISSN 0928-7329 | Citation page |
| Armitage Z, "The difference between left and right feet", SATRA Bulletin, July/August 2018, p. 42 | 2018 | Sample size and method not stated in the article | United Kingdom, United States, China | As many as 19% of people in the UK and at least 24% in China have feet that differ in length by more than 4 mm; about 1% have identical lengths to the nearest 0.1 mm | C | n/a | SATRA article |
| Buckbootz news page, "British feet get two sizes bigger in 40 years", citing the College of Podiatry (no date shown, no study named) | n/a | Poll of 2,000 British adults attributed to the College of Podiatry; the poll itself is not linked | United Kingdom | Claims average UK sizes rose from 8 to 10 for men and 4 to 6 for women since 1970. No primary source is named or linked | D | n/a | News page |
| UrbanStyle Footwear calculations on this page | 2026 | Arithmetic on figures from the sources above; method stated | Global | Unit conversions, differences and shares on this page | E | n/a | Methodology |
Methodology and limitations
How I built this page. I looked for official statistics first, then peer-reviewed measurement studies, then trade and press reports, and only then articles. For each figure I recorded the source, date, sample and what kind of evidence it is, and I opened the original wherever it was open to me. I read the scan study on PubMed Central, the Iran study at its publisher, the Chinese foot-shape study through a copy of the paper, the pregnancy study’s abstract through a university repository, the army figures through an NC State summary table, and the SATRA, Business Today and news pages on October 21, 2026. Where I calculated something, such as a conversion, a difference or a share, it’s labelled E and the method is in the dataset.
What I left out. I left out the comparison table of other countries inside the Iran paper, because it collects results from older studies I couldn’t check and some values look inconsistent with each other. I also left out average shoe sizes, small studies of older adults whose figures I couldn’t confirm, a Polish study of 100 older adults whose reported lengths were well below every other source and whose method I could not reconcile, a women’s shoe size page that rests on sales staff estimates, and the age at which feet stop growing.
Limitations you should know about
- The scan study isn’t a random sample. It measured store customers, records no age, can’t exclude boys’ feet, and reports a most common class, not a mean. Its lead author has a financial interest in the scanner maker, though the authors say results are independent of the device.
- Asia is about 2% of the scans. I would not generalise from them to all of Asia.
- The US Army figures are second-hand. I could not open the original table. They describe soldiers, and the source documents give two different sample counts, so I don’t state one for the table.
- The Iran and Chinese studies are young-adult groups in one city or from convenience samples, and they measure width in different ways.
- The India and Korea surveys are reported, not read. I have sample sizes and findings but no lengths or widths.
- SATRA gives no sample size or method. I use it only as an indication.
- The pregnancy study is small. It followed 49 women for about five months after birth and doesn’t report how much foot length rose.
- Unit conversions are mine. Inches were converted at 25.4 mm per inch, and rounded figures can differ by about 1 mm.
- Coverage is uneven. I found nothing usable for Africa, Latin America or Oceania.
Data freshness
| Date | Change |
|---|---|
| October 21, 2026 | First publication. Data read from the scan study, the US Army survey table, the Iranian and Chinese studies, the pregnancy study, the SATRA Bulletin and press reports of the Indian and Korean surveys. Downloadable dataset, four charts and calculations with stated methods. |
| When a newer survey or measured source appears | Planned update of the matching figures. |
| January 2027 | Next scheduled full review. |
Last full source review: October 21, 2026. Next scheduled review: January 2027.
Corrections. If you spot an error or have better data, email info@urbanstylefootwear.com with the subject “Data correction”. I’ll check it and note any change in the table above. How I test and review products is explained in our methodology.
For journalists and researchers
You can use the statistics and charts on this page with credit to UrbanStyle Footwear. Wherever you can, please cite the original source printed with each statistic. My own calculations are marked tier E and can be cited to me.
A sentence you can use. “In a study of 1.2 million 3D foot scans, the most common foot length was 270 mm for men and 245 mm for women in North America and Europe, and 255 mm and 235 mm in Asia. No official average foot size exists.” (Sources: Jurca et al., Scientific Reports, 2019; UrbanStyle Footwear)
Media kit
All figures with value, unit, geography, segment, basis, period, source and evidence tier.
Four charts with source, scope and data type printed on each image. SVG versions are under each chart above.
The 15 citable statistics on one printable PDF.
Every source with year, sample, geography, tier, series ID and link.
Ready-made citations below. Media and research enquiries go to info@urbanstylefootwear.com.
Cite this page
Suggested citation
UrbanStyle Footwear. “Foot Size Statistics 2026: Average Foot Length and Width Around the World.” Updated October 21, 2026. https://urbanstylefootwear.com/foot-size-statistics/
APA style
Vahith, A. (2026, October 21). Foot size statistics 2026: average foot length and width around the world. UrbanStyle Footwear. https://urbanstylefootwear.com/foot-size-statistics/
Link (HTML)
<a href="https://urbanstylefootwear.com/foot-size-statistics/">Foot Size Statistics 2026 by UrbanStyle Footwear</a>Click any citation, then press Ctrl+C (Cmd+C on Mac) to copy it.
For individual statistics, UrbanStyle recommends citing the original source listed in the source table whenever possible.
Data requests. Data correction or dataset request: info@urbanstylefootwear.com
Frequently asked questions
What is the average foot length for men?
There is no official figure, but the best evidence points to about 270 mm. In 1.2 million foot scans, 270 mm was the most common length class for men in North America and Europe (Jurca et al., 2019), the US Army survey median was about 271 mm, and Iranian male students averaged 270.0 mm. It is a foot length, not a shoe size. See average foot length.
What is the average foot length for women?
About 235 to 245 mm depending on where you look. The most common class for women in North America and Europe scans was 245 mm and the US Army survey median was about 244 mm, while Asian scans peaked at 235 mm and Iranian female students averaged 234.4 mm. See average foot length.
How wide is the average foot?
The US Army survey median foot breadth was about 102 mm for men and 93 mm for women (my conversion from inches), and Iranian students averaged 100.4 mm and 89.2 mm. Width rises with length, so a single average is less useful than width at your own foot length. See average foot width.
Is there an official average foot size?
Not one I could open. The largest studies are a retail scan study, a US Army survey and a handful of national or local surveys, and none is a census of everyone’s feet. Official statistics bodies do not publish foot length, so I rely on research and say so for every number. See the evidence tiers.
How do foot sizes differ by country?
Only a few countries have usable data. North American and European scans were very similar, Asian scans were shorter and wider on average, and Indian feet are reported to be wider than Western feet. I could not find reliable national averages for most countries, and I do not fill the gap with estimates. See foot size by region.
Are Asian feet shorter and wider?
On average the scan study says yes: the most common length class was 255 mm for men and 235 mm for women in Asia, against 270 mm and 245 mm in North America and Europe, and Asian feet were wider in most length classes. Asia was only about 2% of the scans, and the countries covered were limited to seven.
Are Indian feet wider than Western feet?
The CSIR-CLRI survey of 101,880 people says Indian feet tend to be wider than Western feet, according to Business Today. I could not find the survey itself or any length and width figures, so I cannot give an Indian average. My Indian vs UK shoe size guide covers sizing.
How much longer are men's feet than women's?
About 27 mm at the median in the US Army survey (271 mm against 244 mm), and about 36 mm in the Iranian student study. The ranges overlap: the longest 5% of women’s feet in the US Army survey are longer than the shortest 5% of men’s. See men and women.
Are women's feet narrower than men's at the same length?
Yes, in the one study I found that compared them directly. Among 2,321 Chinese adults, women’s feet were about 4.3 mm narrower than men’s at foot lengths of 235, 240 and 245 mm, and the difference at 250 mm was not significant (Hong et al., 2011). See men and women.
Is one foot usually bigger than the other?
Usually a little. A SATRA Bulletin article says as many as 19% of people in the UK and at least 24% in China have feet that differ in length by more than 4 mm, and about 1% have identical lengths. It states no sample size, so treat it as an indication. If your feet differ, fit the larger one. See left and right feet.
At what age do feet stop growing?
I could not find a reliable global figure. The India survey reports that average foot size peaks around age 11 for women and 15 or 16 for men, but gives no measurements. For children I have separate guides: see my children’s shoe size chart. See age and pregnancy.
Does pregnancy change foot size?
It can. In a study of 49 women, arch height and rigidity fell and foot length rose between the first trimester and 19 weeks after birth, and the authors say the first pregnancy may be the most significant (Segal et al., 2013). The abstract gives no figures, and it does not show how many women kept the change for years. See age and pregnancy.
Are people's feet getting bigger?
I could not verify it. Several pages say average feet have grown, including a report that British sizes rose by two since 1970, but none I read names a measured study. Without repeated measurements of comparable groups, I do not state it as fact. See are feet getting bigger.
Is foot size the same as shoe size?
No. Foot size is a measurement of the foot, usually in millimetres or centimetres. Shoe size is a label that differs by country and by brand, and no official US average shoe size exists. For that, see my shoe size statistics and the conversion calculator.
Can I use these statistics and download the data?
Yes, with credit to UrbanStyle Footwear, and cite the original source for any single statistic where you can. The CSV, XLSX, charts and a printable list of key statistics are in the media kit, with citation formats.