
A sourced, evidence-graded look at how many shoes get sent back, why it happens, what returns cost and how brand return policies compare, with the data free to download and cite.
One question, five answers: what share of shoes get returned? Select a lens to see what each figure counts.
Select a lens above, for example “Shoe shopper survey”, to see why the headline numbers disagree.
15.8%Retailers estimated that 15.8% of 2025 sales would be returned, about $849.9 billion (NRF and Happy Returns, tier C). It covers all products and counts dollars of sales, not shoes.
19.3%NRF and Happy Returns estimated that 19.3% of online sales would be returned in 2025 (tier C). Still all retail, not footwear.
30% to 35%Return Prime, an Indian returns platform, reported 30% to 35% in "certain categories like clothing and shoes", against 17.6% for all online products (reported July 2024, tier D). Not a US figure.
56%A June 2026 survey of 1,882 online shoppers, commissioned by an eyewear brand, estimated that 56% of online shoes and boots are returned (tier D). The method is not fully published.
35%Zappos said in March 2010 that customers returned 35% of what they ordered on average (reported secondhand, tier D). One retailer built around free returns, 16 years ago.
None of these is an official US shoe return rate. Full comparison: what share of shoes are returned?
Shoe return research at a glance
Quick answer. There is no official US figure for how many shoes are returned. The best-sourced numbers cover all retail: the National Retail Federation (NRF) and Happy Returns estimate that 15.8% of 2025 sales, about $849.9 billion, would be returned, and 19.3% of online sales. For shoes alone, published online return rates run from 19% to 56% depending on who measured, what they counted and when, so they cannot be averaged. What the evidence does support is the cause: fit. A peer-reviewed review found that 63% to 72% of wearers in 18 studies wore shoes that did not fit the length or width of their feet, and every footwear source we read names sizing as the leading reason for returns. Brand policies differ more than most shoppers expect: Brooks gives 90 days, Nike and Zappos 60, New Balance 45, and HOKA and adidas performance footwear 30.
This page collects the return numbers we could trace to a real source, says what kind of evidence each one is, explains why the headline figures disagree, and leaves out what we could not verify. If you are shopping rather than researching, skip to what this means for shoppers, read our ultimate footwear buying guide, or see how fit varies in our shoe size statistics.
Key findings
- There is no official or independent US shoe-only return rate. The closest well-sourced figures cover all retail: NRF and Happy Returns put 2025 returns at $849.9 billion, or 15.8% of sales, and online returns at 19.3% of online sales.
- Two estimates of 2025 returns disagree. Appriss Retail reports $706 billion returned in 2025 against NRF’s $849.9 billion. They use different data and methods, so neither is a correction of the other.
- NRF’s yearly series is not a clean trend. NRF said its 2023 numbers cannot be compared with its 2022 report because the method changed, and the 2023 report used Appriss data while the 2024 and 2025 reports were produced with Happy Returns. Treat changes between years as indicative.
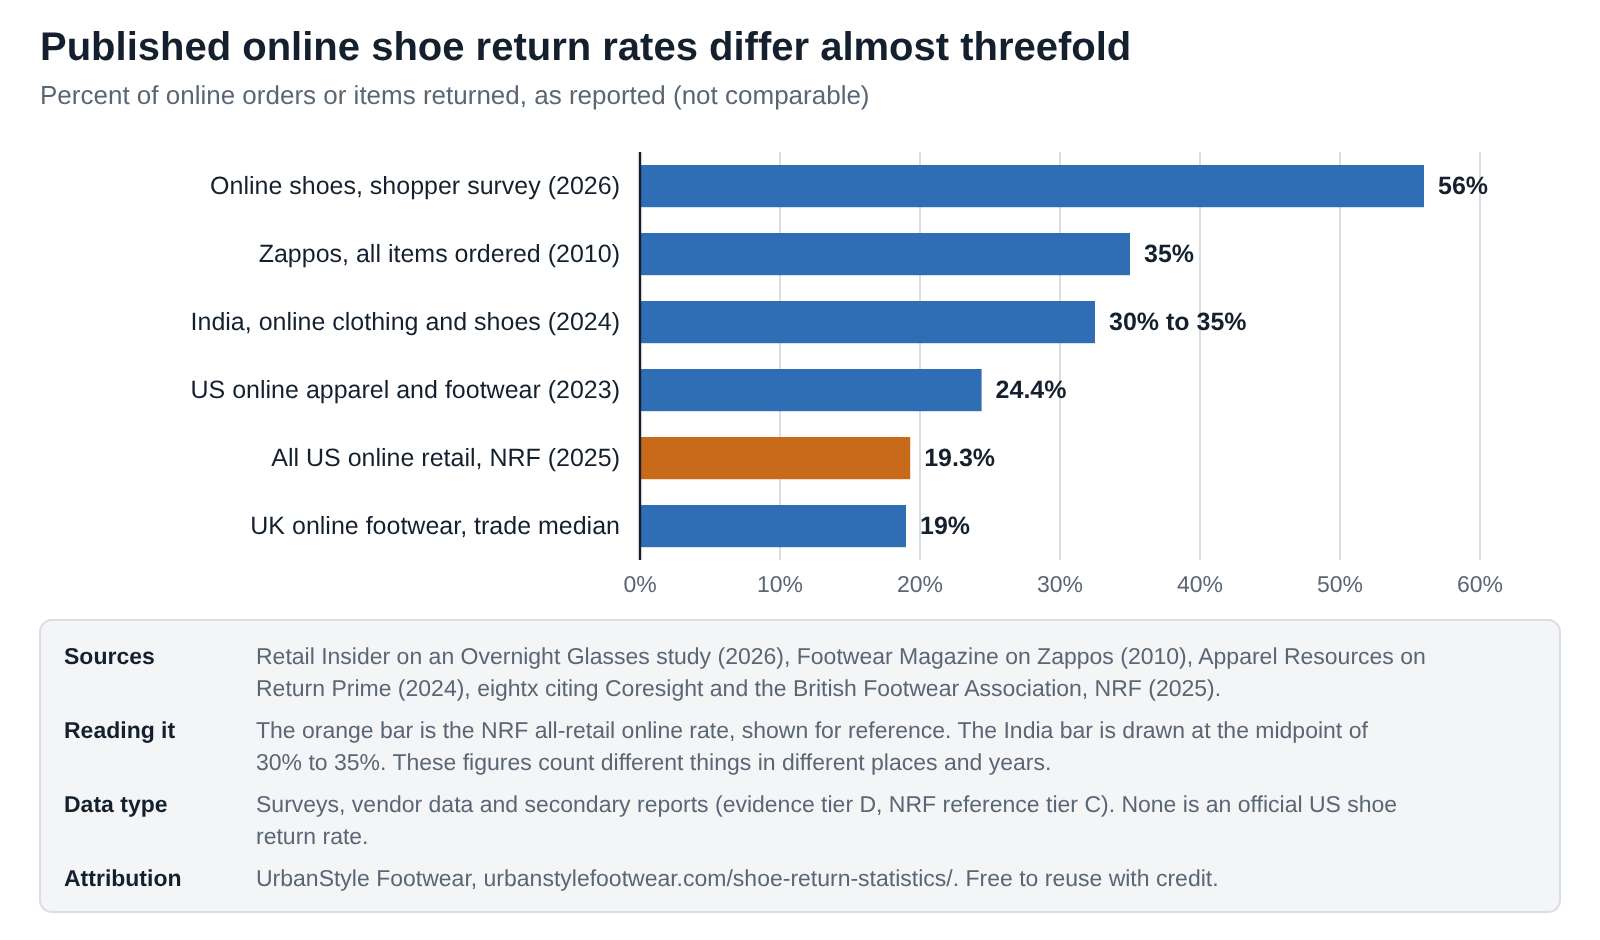
- Published online shoe return rates we could chart run from 19% to 56%, almost a threefold spread. The figures count different things: orders, items or dollars, one retailer or a whole market, survey recall or records, and different countries and years.
- Fit is the reason sources name most. The peer-reviewed evidence is on wearers rather than returns: 63% to 72% wore ill-fitting shoes across 18 studies. Vendor and trade reports put the fit-related share of shoe returns at roughly 40% to 70%, but we could not trace those figures to original data.
- Online purchases drive a large share of returned dollars. Appriss attributes 48% of the $706 billion to purchases made online: 29% brought back to a store and 19% returned online (the 48% is our sum of the two).
- Free returns still shape where people shop: 82% of surveyed consumers call them a major consideration, up from 76%, and 71% say a poor returns experience makes them less likely to shop with a retailer again, up from 67% in 2024.
- Retailers are weighing fees. NRF’s retailer survey lists rising operating costs (40%), rising carrier shipping costs (40%) and economic uncertainty or tariff risk (33%) as reasons retailers charge for returns. New Balance charges non-members a $5 restocking fee online.
- Return windows at six shoe brands range from 30 to 90 days, and wear rules differ: adidas accepts performance footwear in any condition within 30 days, Brooks offers a 90-day trial run, and Zappos requires shoes to be unworn.
What we know and what we do not know
Research integrity starts with saying where the evidence stops. This is the state of the public evidence as of October 2026.
| Question | Evidence status | Why |
|---|---|---|
| Total value of US retail returns | Estimates that disagree | NRF says $849.9 billion for 2025; Appriss Retail says $706 billion |
| Online versus in-store return rates, all retail | Industry estimate | NRF gives 19.3% online for 2025; survey of 358 retail professionals |
| Whether many people wear ill-fitting shoes | Peer-reviewed review | 18 studies, 3,205 participants, though fit definitions vary |
| Brand return policies today | Read at the source | Taken from each brand’s own help page on October 9, 2026; policies change |
| US return rate for shoes only | No official figure | Published shoe rates come from surveys, vendors and single retailers |
| Share of shoe returns caused by fit | Consistent direction, weak numbers | Sources agree fit leads, but percentages come from vendors we could not trace |
| Return rates by shoe brand or retailer | Not published | We found no verifiable brand-level return rate |
| Cost of processing a shoe return | Vendor claims only | Per-pair figures circulate in vendor blogs without a stated method |
| Environmental impact of returns | Unsourced figures | Widely quoted landfill and CO2 totals name no source or year |
| Whether size-recommendation tools cut shoe returns | Vendor claims only | No independent study found |
| Share of returns that are fraudulent | Industry estimate | NRF says 9% in 2025; fraud and abuse are defined differently by different publishers |
15 shoe return statistics you can cite
Each card gives a number, a one-sentence explanation and its source. “Copy text” opens a box with the sentence, the source and a link back to this page. For any single statistic, please cite the original source listed on the card. Cards marked E are UrbanStyle calculations or comparisons, with the method stated.
NRF and Happy Returns projected that US consumers would return $849.9 billion of merchandise in 2025. The figure covers all retail, not shoes alone.
Copy text
$849.9B retail returns, 2025: NRF and Happy Returns projected that US consumers would return $849.9 billion of merchandise in 2025. The figure covers all retail, not shoes alone. Source: NRF and Happy Returns, 2025. Via UrbanStyle Footwear: https://urbanstylefootwear.com/shoe-return-statistics/
Retailers estimated that 15.8% of annual sales would be returned in 2025, against 16.9% in NRF and Happy Returns' 2024 estimate. The reports use different samples, so treat the change as indicative.
Copy text
15.8% of sales returned, 2025: Retailers estimated that 15.8% of annual sales would be returned in 2025, against 16.9% in NRF and Happy Returns' 2024 estimate. The reports use different samples, so treat the change as indicative. Source: NRF and Happy Returns, 2025. Via UrbanStyle Footwear: https://urbanstylefootwear.com/shoe-return-statistics/
NRF and Happy Returns estimated that 19.3% of online sales would be returned in 2025. The figure covers all online retail, not footwear.
Copy text
19.3% of online sales returned, 2025: NRF and Happy Returns estimated that 19.3% of online sales would be returned in 2025. The figure covers all online retail, not footwear. Source: NRF and Happy Returns, 2025. Via UrbanStyle Footwear: https://urbanstylefootwear.com/shoe-return-statistics/
Appriss Retail reported that $706 billion of merchandise was returned in 2025. It differs from NRF's $849.9 billion because the two use different methods and data.
Copy text
$706B returned in 2025, per Appriss: Appriss Retail reported that $706 billion of merchandise was returned in 2025. It differs from NRF's $849.9 billion because the two use different methods and data. Source: Appriss Retail, 2026 benchmark. Via UrbanStyle Footwear: https://urbanstylefootwear.com/shoe-return-statistics/
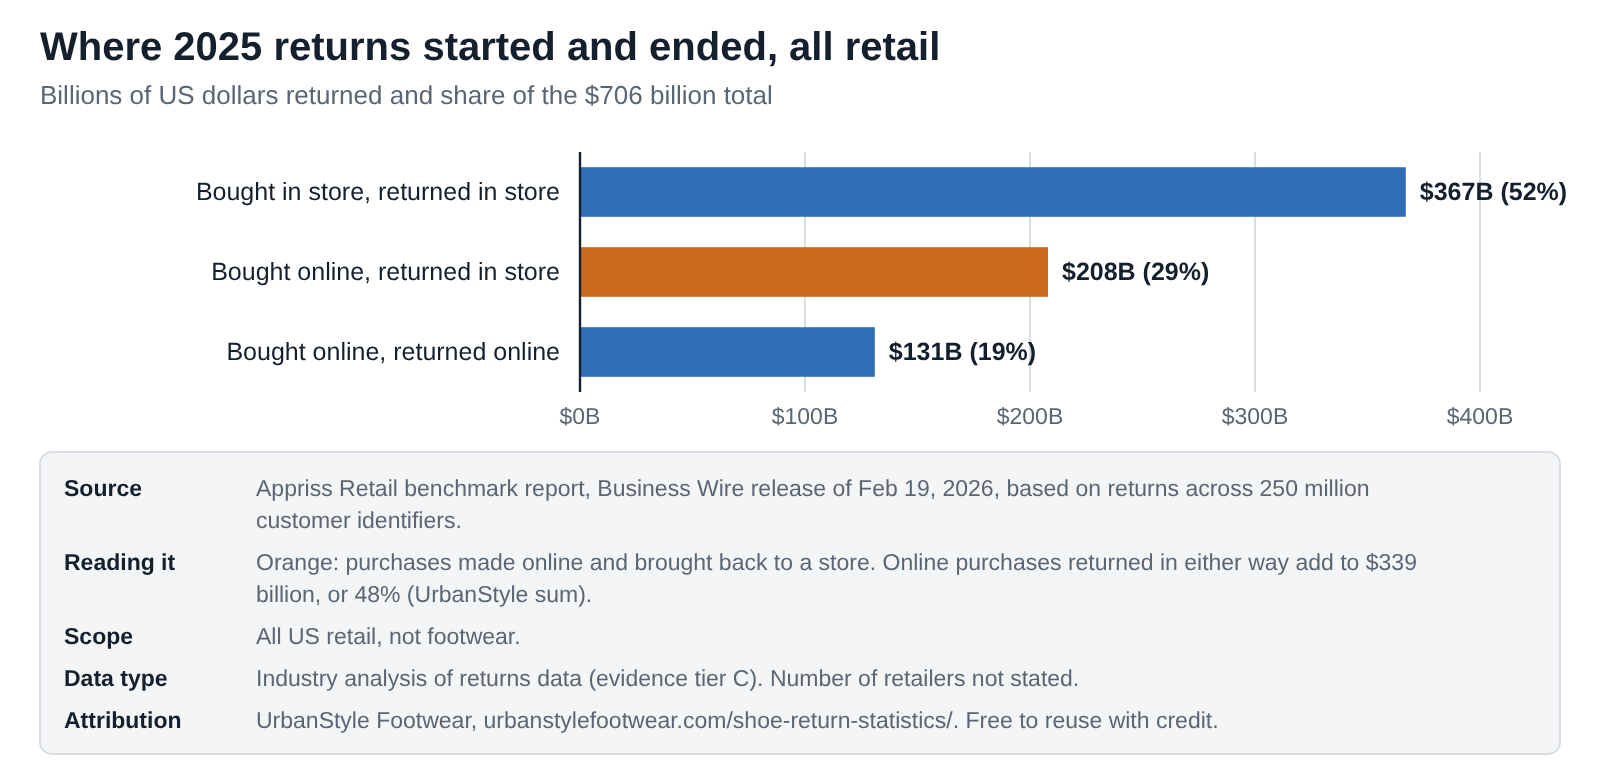
Of the $706 billion returned in 2025, $208 billion (29%) was bought online and returned in a store, and $131 billion (19%) was bought online and returned online, according to Appriss Retail.
Copy text
29% bought online, returned in a store: Of the $706 billion returned in 2025, $208 billion (29%) was bought online and returned in a store, and $131 billion (19%) was bought online and returned online, according to Appriss Retail. Source: Appriss Retail, 2026 benchmark. Via UrbanStyle Footwear: https://urbanstylefootwear.com/shoe-return-statistics/
NRF and Happy Returns estimated that 9% of all returns in 2025 were fraudulent.
Copy text
9% of returns fraudulent, 2025: NRF and Happy Returns estimated that 9% of all returns in 2025 were fraudulent. Source: NRF and Happy Returns, 2025. Via UrbanStyle Footwear: https://urbanstylefootwear.com/shoe-return-statistics/
Of consumers who had returned an online purchase, 82% said free returns were a major consideration when buying, up from 76% a year earlier (NRF and Happy Returns, 2025).
Copy text
82% say free returns matter: Of consumers who had returned an online purchase, 82% said free returns were a major consideration when buying, up from 76% a year earlier (NRF and Happy Returns, 2025). Source: NRF and Happy Returns, 2025. Via UrbanStyle Footwear: https://urbanstylefootwear.com/shoe-return-statistics/
71% of surveyed consumers said a poor returns experience made them less likely to shop with that retailer again, up from 67% in 2024 (NRF and Happy Returns).
Copy text
71% less likely to shop again: 71% of surveyed consumers said a poor returns experience made them less likely to shop with that retailer again, up from 67% in 2024 (NRF and Happy Returns). Source: NRF and Happy Returns, 2025. Via UrbanStyle Footwear: https://urbanstylefootwear.com/shoe-return-statistics/
51% of Gen Z consumers said they bracket, meaning they buy several items intending to return some (NRF and Happy Returns, 2024).
Copy text
51% of Gen Z bracket: 51% of Gen Z consumers said they bracket, meaning they buy several items intending to return some (NRF and Happy Returns, 2024). Source: NRF and Happy Returns, 2024. Via UrbanStyle Footwear: https://urbanstylefootwear.com/shoe-return-statistics/
Consumers aged 18 to 30 made an average of 7.7 online returns in the past 12 months, more than any other generation in the survey (NRF and Happy Returns, 2025).
Copy text
7.7 online returns by consumers aged 18 to 30: Consumers aged 18 to 30 made an average of 7.7 online returns in the past 12 months, more than any other generation in the survey (NRF and Happy Returns, 2025). Source: NRF and Happy Returns, 2025. Via UrbanStyle Footwear: https://urbanstylefootwear.com/shoe-return-statistics/
Across 18 studies with 3,205 participants, 63% to 72% of people wore shoes that did not accommodate the length or width of their feet. Fit definitions varied between studies (Buldt and Menz, 2018).
Copy text
63% to 72% wore ill-fitting shoes: Across 18 studies with 3,205 participants, 63% to 72% of people wore shoes that did not accommodate the length or width of their feet. Fit definitions varied between studies (Buldt and Menz, 2018). Source: Buldt and Menz (2018) (DOI 10.1186/s13047-018-0284-z). Via UrbanStyle Footwear: https://urbanstylefootwear.com/shoe-return-statistics/
A June 2026 survey of 1,882 online shoppers, commissioned by an eyewear brand, estimated that 56% of online shoes and boots are returned. It is a stated-behaviour estimate, not a US sales count.
Copy text
56% online shoes returned, shopper survey: A June 2026 survey of 1,882 online shoppers, commissioned by an eyewear brand, estimated that 56% of online shoes and boots are returned. It is a stated-behaviour estimate, not a US sales count. Source: Overnight Glasses study via Retail Insider. Via UrbanStyle Footwear: https://urbanstylefootwear.com/shoe-return-statistics/
Published online shoe return rates we could chart run from 19% to 56%, almost a threefold spread, because they count different things. None is an official US figure. UrbanStyle comparison.
Copy text
19% to 56% range of charted online shoe return rates: Published online shoe return rates we could chart run from 19% to 56%, almost a threefold spread, because they count different things. None is an official US figure. UrbanStyle comparison. Source: UrbanStyle calculation. Via UrbanStyle Footwear: https://urbanstylefootwear.com/shoe-return-statistics/
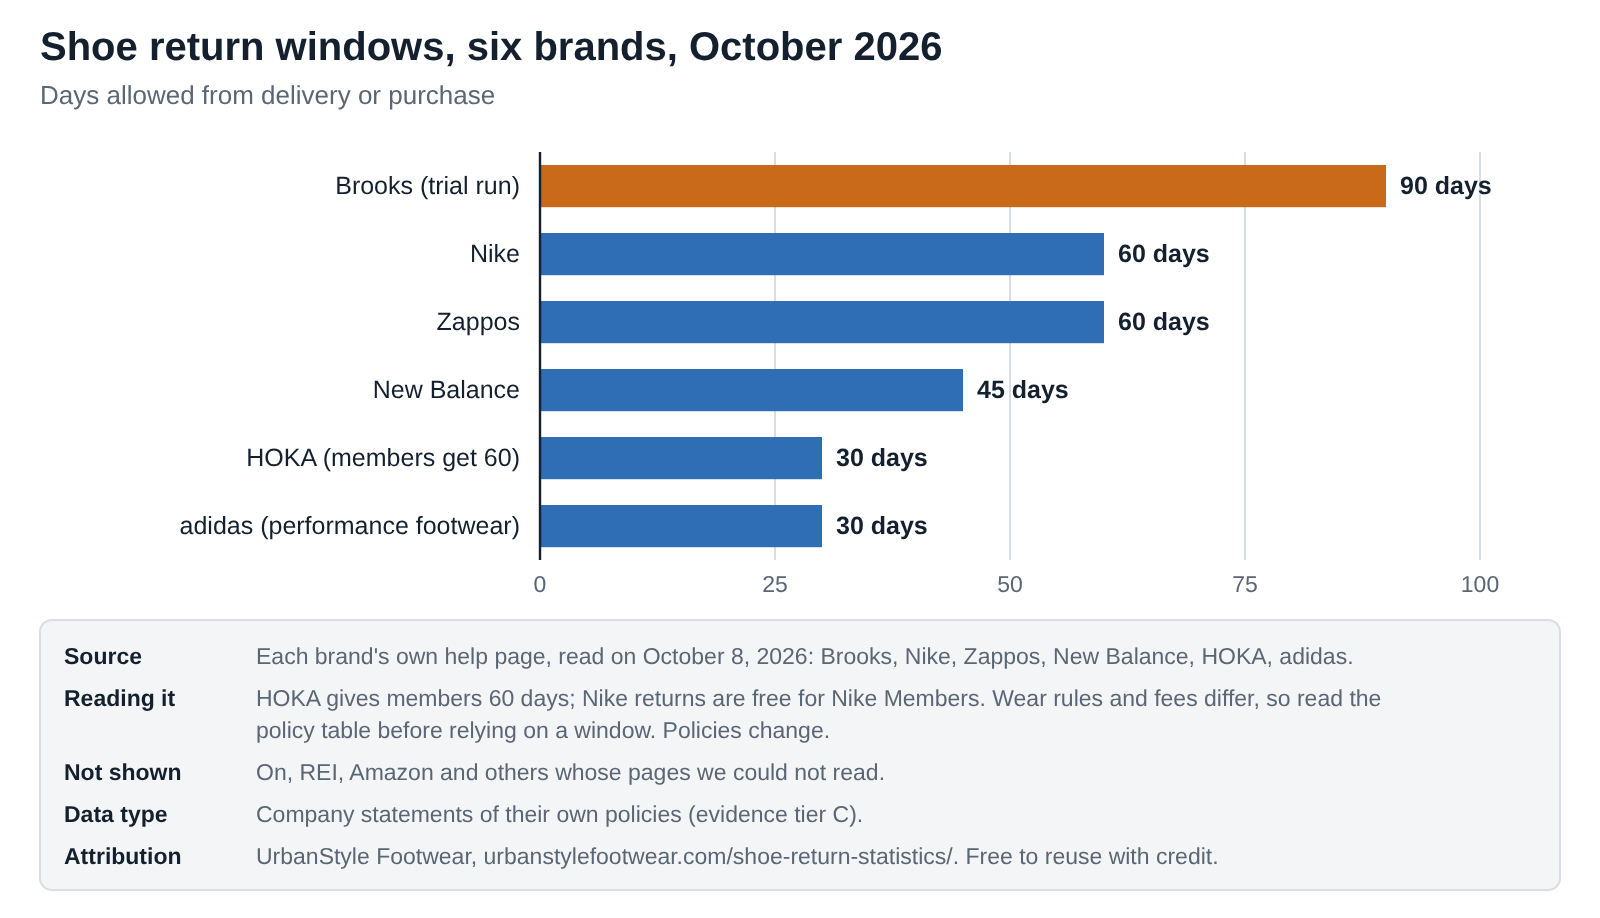
Return windows at six shoe brands range from 30 days (HOKA, adidas performance footwear) to 90 days (Brooks), with Nike and Zappos at 60 and New Balance at 45. Company help pages, read October 9, 2026.
Copy text
30 to 90 days return windows, six brands: Return windows at six shoe brands range from 30 days (HOKA, adidas performance footwear) to 90 days (Brooks), with Nike and Zappos at 60 and New Balance at 45. Company help pages, read October 9, 2026. Source: UrbanStyle calculation. Via UrbanStyle Footwear: https://urbanstylefootwear.com/shoe-return-statistics/
New Balance charges non-members a $5 restocking fee on online returns, deducted from the refund. Online returns are free for members and in-store returns are free for everyone (company return policy).
Copy text
$5 New Balance restocking fee, non-members: New Balance charges non-members a $5 restocking fee on online returns, deducted from the refund. Online returns are free for members and in-store returns are free for everyone (company return policy). Source: New Balance return policy. Via UrbanStyle Footwear: https://urbanstylefootwear.com/shoe-return-statistics/
How many returns are there in the US?
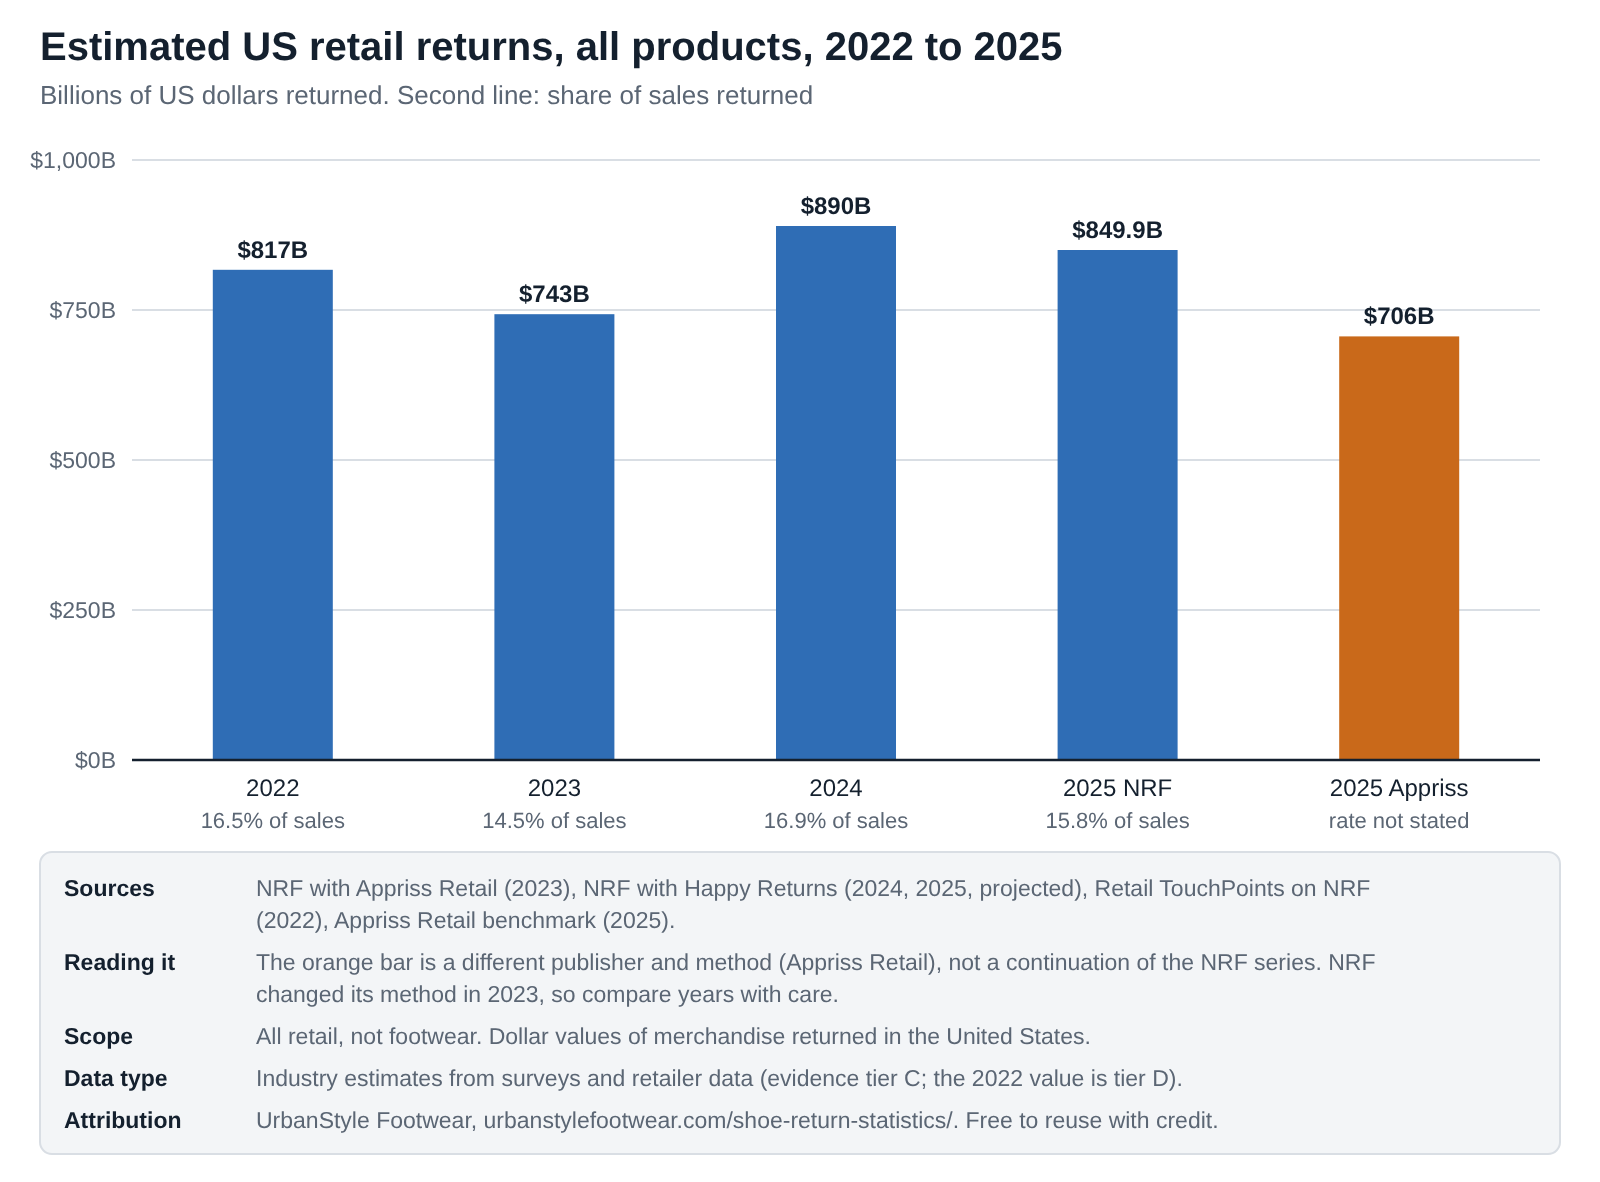
Before looking at shoes, it helps to know what the wider numbers say. Two organisations publish totals for 2025, and they do not match. Neither covers footwear alone, so use them as context, not as a shoe figure.
Why there are two totals for 2025
| Measure | Value | What it counts | What it leaves out | Tier |
|---|---|---|---|---|
| NRF and Happy Returns, 2025 | $849.9B; 15.8% of sales; online 19.3% | Retailers’ estimates of the share of annual sales that will be returned; NRF reports the result as a national dollar total | Based on a survey of 358 e-commerce professionals at merchants over $500 million in revenue; not footwear-specific | C |
| Appriss Retail benchmark, 2025 | $706B | Returns found in Appriss’s data across 250 million unique customer identifiers, plus a consumer survey of more than 1,000 people | The release does not say how many retailers took part or give a return rate; not footwear-specific | C |
| NRF and Happy Returns, 2024 | $890B; 16.9% of sales | Retailers’ estimate of the share of sales returned, projected | Survey of 249 e-commerce and finance professionals at large retailers | C |
| NRF and Appriss Retail, 2023 | $743B; 14.5%; online 17.6%; in-store 10.02% | NRF survey paired with Appriss returns data | NRF says these cannot be compared with its 2022 report | C |
| NRF, 2022 | Nearly $817B; 16.5% | As reported by Retail TouchPoints | We read the trade-press report, not the 2022 release | D |
Embed this chart
<figure style="margin:0"><a href="https://urbanstylefootwear.com/shoe-return-statistics/"><img src="https://urbanstylefootwear.com/wp-content/uploads/2026/10/usf-us-retail-returns-2022-2025.png" alt="Bar chart of estimated US retail returns: $817 billion in 2022, $743 billion in 2023, $890 billion in 2024, $849.9 billion in 2025 (NRF) and $706 billion in 2025 (Appriss Retail)" width="800" style="max-width:100%;height:auto"></a><figcaption>Source: UrbanStyle Footwear, based on NRF, Happy Returns and Appriss Retail. <a href="https://urbanstylefootwear.com/shoe-return-statistics/">Shoe Return Statistics 2026</a></figcaption></figure>Click the code, press Ctrl+C (Cmd+C on Mac), and paste it into any web page. Please keep the attribution link.
View as table
| Period | Merchandise returned (billion US dollars) | Share of sales returned (%) | Publisher and method | Source |
|---|---|---|---|---|
| 2022 | 817 | 16.5 | NRF, reported by Retail TouchPoints (nearly $817 billion) | Retail TouchPoints on NRF |
| 2023 | 743 | 14.5 | NRF with Appriss Retail data | NRF and Appriss Retail |
| 2024 | 890 | 16.9 | NRF with Happy Returns (projected) | NRF and Happy Returns |
| 2025 NRF | 849.9 | 15.8 | NRF with Happy Returns (projected) | NRF and Happy Returns |
| 2025 Appriss | 706 | not stated | Appriss Retail benchmark report | Appriss Retail |
From 2024 to 2025, NRF’s projected dollars fell 4.5% (from $890 billion to $849.9 billion) and its return rate fell 1.1 percentage points (from 16.9% to 15.8%). These are our calculations, tier E. Because the surveys differ each year, we treat them as indicative rather than as proof that returns are falling.
Fraud and abuse
- NRF and Happy Returns estimate that 9% of all 2025 returns were fraudulent. In 2023, NRF with Appriss put fraud losses at $101 billion, about $13.70 per $100 of returned merchandise.
- Appriss Retail reports $100 billion (14.2%) in preventable loss from returns fraud and abuse in 2025. It separates abuse ($86 billion, described as six times fraud) from fraud, so the two reports are not measuring the same thing.
- NRF’s retailer survey lists overstated quantities (71%), empty-box returns (65%) and decoy returns such as counterfeit items (64%) among the fraud trends retailers tracked.
Who measures what in returns
A return can be counted in five different ways, and each organisation uses one. That is why the numbers do not line up. Select a step to see what is counted and where this page uses it.
1Retailer return recordsAppriss Retail analysis of returns across 250 million customer identifiers
Counts what customers actually sent back at participating retailers. The release does not say how many retailers took part or how they were chosen, and it covers all products.
2Retailer surveysNRF and Happy Returns survey of 358 e-commerce professionals (2025)
Asks large merchants (over $500 million in revenue) what share of sales they expect to be returned. These are estimates rather than records, and they lean toward big retailers.
3Consumer surveysNRF (2,006 consumers) and a commissioned shopper study (1,882 shoppers)
Ask people what they returned or how they feel. People misremember, and a survey of people who returned something cannot give a return rate for all shoppers.
4Vendor and trade benchmarksReturn Prime, British Footwear Association member surveys, returns-software blogs
Count returns among a vendor’s own clients or a trade group’s members. Useful for patterns, but those clients are not a random sample of the market.
5Company accountsAnnual reports of shoe and retail companies
Companies set aside money for expected returns, but those accounting reserves are estimates, not return rates, and we did not use them.
What share of shoes bought online are returned?
This is the number most articles quote, and the one with the weakest evidence. We found no official or independent figure for the US. We found a handful of published estimates, listed below with what each covers, and we say whether we read the original or only a report of it. D
| Figure | What it covers | Source and year | What we read | Tier |
|---|---|---|---|---|
| 56% | Online shoes and boots; survey of 1,882 online shoppers; geography not stated; commissioned by an eyewear brand | Overnight Glasses, reported by Retail Insider, July 2026 | News report, not the study | D |
| 35% | Average share of items ordered that were returned, at one retailer built around free returns | Zappos disclosure, March 2010, reported by Footwear Magazine | Secondhand report | D |
| 30% to 35% | “Certain categories like clothing and shoes”, India (17.6% for all online products) | Return Prime, reported by Apparel Resources, July 2024 | News report | D |
| 27% | Online shoes, global | PRIME AI article, no source cited, undated | Vendor article; no source to check | D |
| 24.4% | Online apparel and footwear, US, April 2023 | Coresight Research, as cited by eightx | Blog citing the figure | D |
| 19% | Online footwear, median of British Footwear Association members (range 2% to 31%); median 5% in store. Respondent count, date and unit counted not stated | British Footwear Association member survey article, UK | The BFA article | C |
| 18% | Average online return rate for footwear; year not stated | Statista, as cited by Corso | Blog citing the figure; not charted | D |
| “20% to 35%”, “50% or more” | Online shoes; described as often quoted or suggested by some sources | Footwear Magazine; no source named | Unattributed | D |
| 19.3% (reference) | All US online retail, not footwear | NRF and Happy Returns, 2025 | The press release | C |
Embed this chart
<figure style="margin:0"><a href="https://urbanstylefootwear.com/shoe-return-statistics/"><img src="https://urbanstylefootwear.com/wp-content/uploads/2026/10/usf-published-online-shoe-return-rates.png" alt="Bar chart of published online return rates: shoes 56 percent, Zappos 35 percent in 2010, India clothing and shoes 30 to 35 percent, US apparel and footwear 24.4 percent, all online retail 19.3 percent, UK footwear 19 percent" width="800" style="max-width:100%;height:auto"></a><figcaption>Source: UrbanStyle Footwear, based on published reports compared by UrbanStyle Footwear. <a href="https://urbanstylefootwear.com/shoe-return-statistics/">Shoe Return Statistics 2026</a></figcaption></figure>Click the code, press Ctrl+C (Cmd+C on Mac), and paste it into any web page. Please keep the attribution link.
View as table
| Figure | Value shown (%) | Scope | Source |
|---|---|---|---|
| Online shoes, shopper survey (2026) | 56 | Online shoes and boots, survey of 1,882 shoppers, geography not stated | Overnight Glasses via Retail Insider |
| Zappos, all items ordered (2010) | 35 | Average share of items ordered that were returned, one retailer | Zappos via Footwear Magazine |
| India, online clothing and shoes (2024) | 30 to 35 | Certain categories such as clothing and shoes, India | Return Prime via Apparel Resources |
| US online apparel and footwear (2023) | 24.4 | Online apparel and footwear, US | Coresight Research via eightx |
| All US online retail, NRF (2025) | 19.3 | All online retail, not footwear (reference) | NRF and Happy Returns |
| UK online footwear, trade median | 19 | Median of British Footwear Association members, range 2 to 31; unit counted not stated | British Footwear Association member survey |
Why the numbers differ so much
- What is counted. A return rate can be returned orders, returned items or returned dollars. They give different answers for the same shop.
- Who is counted. One retailer, a trade group’s members or every shopper. Zappos built its business on free returns, so its 2010 figure is not a market average.
- Records or recall. A shopper survey asks people what they remember returning. Retailer records count what actually came back.
- Channel. The British Footwear Association’s member survey reported a median of 19% online against 5% in store for footwear. NRF’s 2023 figures showed 17.6% online and 10.02% in store for all retail.
- Place and year. The figures span India, the UK and the US, and 2010 to 2026.
- Type of shoe. The 2026 shopper survey reported that fashion shoes had the highest return rates within footwear, and that ankle and combat boots were often returned for calf-width mismatches.
What you can safely say. Footwear sits among the more-returned online categories in every footwear source we read, and published estimates for online shoes start around one in five. No source we could verify gives a US shoe-only rate, and a single number would hide a threefold spread.
Why shoes get returned: fit comes first
Every footwear source we read names fit or sizing as the main reason shoes come back. The strongest evidence is not about returns at all. A systematic review in the Journal of Foot and Ankle Research (Buldt and Menz, 2018) covered 18 studies and 3,205 participants and found that 63% to 72% of wearers had shoes that did not accommodate the length or width of their feet. Fit definitions differed between studies. A
That is a finding about the shoes people already own. It suggests that many people struggle to pick a size, which is consistent with, but not proof of, fit being the main driver of online returns. Our shoe size statistics page covers why sizes vary between brands and countries.
| What was reported | Source | Tier |
|---|---|---|
| Footwear returns were mostly sizing issues; ankle and combat boots often came back for calf-width mismatches; fashion shoes had the highest return rates within footwear; retailers accepted about 90% of footwear returns | Overnight Glasses study via Retail Insider, 2026 (survey of 1,882 shoppers) | D |
| Size concerns were almost 40% of returns across shoes and clothing in India | Return Prime via Apparel Resources, 2024 | D |
| 57% of footwear returns due to poor fit; up to 70% linked to fit | PowerReviews and Taggstar, as cited by Corso (originals not read) | D |
| 63% of surveyed consumers bracket at least some online purchases | Narvar State of Returns 2022, as cited by Footwear Magazine | D |
| 51% of Gen Z consumers bracket; consumers aged 18 to 30 averaged 7.7 online returns in 12 months | NRF and Happy Returns, 2024 and 2025 | C |
The one unverified claim to avoid
You will see statements such as “93% of shoe returns are about size”. We found that figure attributed to an unnamed UK study, with no way to trace it, so we do not use it.
Where returns happen: online, in store, or both
Appriss Retail splits its $706 billion of 2025 returns by where the purchase and the return happened. Just over half started and ended in a store. The rest began online, and a large share of those were returned in person. C
Embed this chart
<figure style="margin:0"><a href="https://urbanstylefootwear.com/shoe-return-statistics/"><img src="https://urbanstylefootwear.com/wp-content/uploads/2026/10/usf-us-returns-by-channel-2025.png" alt="Bar chart of 2025 US returns by channel: bought in store and returned in store $367 billion, bought online and returned in store $208 billion, bought online and returned online $131 billion" width="800" style="max-width:100%;height:auto"></a><figcaption>Source: UrbanStyle Footwear, based on Appriss Retail benchmark report, 2026. <a href="https://urbanstylefootwear.com/shoe-return-statistics/">Shoe Return Statistics 2026</a></figcaption></figure>Click the code, press Ctrl+C (Cmd+C on Mac), and paste it into any web page. Please keep the attribution link.
View as table
| Channel | Returned dollars (billion US dollars) | Share of returned dollars (%) | Source |
|---|---|---|---|
| Bought in store, returned in store | 367 | 52 | Appriss Retail, 2025 |
| Bought online, returned in store | 208 | 29 | Appriss Retail, 2025 |
| Bought online, returned online | 131 | 19 | Appriss Retail, 2025 |
- $208 billion (29%) was bought online and returned in a store. Appriss describes this path as the fastest-growing fraud and abuse vector.
- $131 billion (19%) was bought online and returned online, usually by post.
- Online purchases returned either way total $339 billion, or 48% of the $706 billion (our sum, tier E).
- These are all-retail figures. They do not say how footwear splits across the three paths.
For shoppers, the practical point is that many retailers with stores let you return online orders in person, and some brands make that free. New Balance, for example, says all in-store returns are free while online returns are free only for members. See the policy comparison.
Shoe return policies compared, October 2026
We read each brand’s own help page on October 9, 2026. These are the brands whose US pages we could read in full. Policies change, so confirm the terms at checkout. C
Check a brand’s return policy
Choose a brand to see its window, cost and wear rules, as stated on its own help page on October 9, 2026.
Select a brand above.
Brooks. Window: 90-day trial run. Cost: Free. The page says "no shipping or re-stocking fee". Conditions: Item conditions are not listed on the returns page; see the Returns and Exchanges FAQ.
Nike. Window: 60 days from delivery (online) or purchase (store). Cost: Free for Nike Members. The page does not mention fees for non-members. Conditions: Proof of purchase is required. Worn shoes are not addressed on the page. Clearance store purchases are final. After 60 days, defects go through the shoe warranty.
Zappos. Window: 60 days of purchase. Cost: Free. "Your returns back to the warehouse are absolutely free." Conditions: Items must be unworn, in the state received and in original packaging. Noncompliant returns "could result in a restocking fee up to 50%". Final Sale items cannot be returned.
New Balance. Window: 45 days from shipment (online) or purchase (store). Cost: In-store returns free. Online returns free for members; non-members pay a $5 restocking fee. Conditions: New condition required; worn or damaged items may be refused. Items marked final sale cannot be returned.
HOKA. Window: 30 days from purchase ("Fly for 30"); 60 days for HOKA members. Cost: The page says "Free Shipping, Free Returns" in general terms and does not detail return shipping. Conditions: Full refund or exchange, "no questions asked". Worn shoes are not addressed. HOKA may deny requests it finds abusive or fraudulent and may ask for proof of purchase.
adidas (performance footwear). Window: 30 days. Cost: Not stated on the guarantee page. Conditions: Return "in any condition" if the shoes are not the one. Covers performance footwear; eligibility is detailed on linked pages.
Embed this chart
<figure style="margin:0"><a href="https://urbanstylefootwear.com/shoe-return-statistics/"><img src="https://urbanstylefootwear.com/wp-content/uploads/2026/10/usf-shoe-return-windows-2026.png" alt="Bar chart of shoe return windows in days: Brooks 90, Nike 60, Zappos 60, New Balance 45, HOKA 30, adidas performance footwear 30" width="800" style="max-width:100%;height:auto"></a><figcaption>Source: UrbanStyle Footwear, based on brand help pages read on October 9, 2026. <a href="https://urbanstylefootwear.com/shoe-return-statistics/">Shoe Return Statistics 2026</a></figcaption></figure>Click the code, press Ctrl+C (Cmd+C on Mac), and paste it into any web page. Please keep the attribution link.
View as table
| Brand | Return window (days) | Cost to return | Source |
|---|---|---|---|
| Brooks | 90 | Free. The page says "no shipping or re-stocking fee". | Company help page, Oct 9, 2026 |
| Nike | 60 | Free for Nike Members. The page does not mention fees for non-members. | Company help page, Oct 9, 2026 |
| Zappos | 60 | Free. "Your returns back to the warehouse are absolutely free." | Company help page, Oct 9, 2026 |
| New Balance | 45 | In-store returns free. Online returns free for members; non-members pay a $5 restocking fee. | Company help page, Oct 9, 2026 |
| HOKA | 30 | The page says "Free Shipping, Free Returns" in general terms and does not detail return shipping. | Company help page, Oct 9, 2026 |
| adidas (performance footwear) | 30 | Not stated on the guarantee page. | Company help page, Oct 9, 2026 |
| Brand | Window | Cost to return | Condition and exceptions |
|---|---|---|---|
| Brooks | 90-day trial run | Free. The page says "no shipping or re-stocking fee". | Item conditions are not listed on the returns page; see the Returns and Exchanges FAQ. |
| Nike | 60 days from delivery (online) or purchase (store) | Free for Nike Members. The page does not mention fees for non-members. | Proof of purchase is required. Worn shoes are not addressed on the page. Clearance store purchases are final. After 60 days, defects go through the shoe warranty. |
| Zappos | 60 days of purchase | Free. "Your returns back to the warehouse are absolutely free." | Items must be unworn, in the state received and in original packaging. Noncompliant returns "could result in a restocking fee up to 50%". Final Sale items cannot be returned. |
| New Balance | 45 days from shipment (online) or purchase (store) | In-store returns free. Online returns free for members; non-members pay a $5 restocking fee. | New condition required; worn or damaged items may be refused. Items marked final sale cannot be returned. |
| HOKA | 30 days from purchase ("Fly for 30"); 60 days for HOKA members | The page says "Free Shipping, Free Returns" in general terms and does not detail return shipping. | Full refund or exchange, "no questions asked". Worn shoes are not addressed. HOKA may deny requests it finds abusive or fraudulent and may ask for proof of purchase. |
| adidas (performance footwear) | 30 days | Not stated on the guarantee page. | Return "in any condition" if the shoes are not the one. Covers performance footwear; eligibility is detailed on linked pages. |
Five things to check in any shoe return policy
- The window and its start date. From delivery, from purchase or from shipment can differ by days.
- Wear rules. “Unworn” (Zappos), “new condition” (New Balance) and “any condition” (adidas performance footwear) are very different promises.
- Who pays. Free for members only, free in store only, or a restocking fee.
- Exceptions. Final sale, clearance and custom items are usually excluded.
- What happens after the window. A defect is a warranty matter rather than a return. Nike, for example, points to its shoe warranty after 60 days.
What returns cost and who pays
Retail-wide, NRF and Happy Returns project $849.9 billion in returned merchandise for 2025. That is the value of goods sent back, not the cost of handling them. We found no verified cost per shoe return.
- Who pays now. Brooks says returns are free with no restocking fee. Nike returns are free for Nike Members. New Balance charges non-members a $5 restocking fee online. Zappos says noncompliant returns could incur a restocking fee of up to 50% of the item price.
- Why retailers charge. In NRF’s retailer survey, rising operating costs (40%), rising carrier shipping costs (40%) and economic uncertainty or tariff risk (33%) were listed as reasons retailers charge for returns. The release does not state the base for these percentages.
- Typical fees. A Wharton Baker Retailing Center article (January 8, 2026) says mail-in return fees at many major stores are typically $4 to $12, without naming a source. D
- Shoppers still want free returns. 82% of surveyed consumers call free returns a major consideration, and 76% are more likely to choose an option offering an instant refund or exchange.
Figures we did not use
- Cost per shoe return. Vendor blogs quote per-pair processing costs and shares of the item price with no stated method, so we leave them out.
- Environmental totals. Optoro’s page says 9.6 billion pounds of returns go to landfill and about 27 million tons of CO2 are emitted each year, but it names no source or year for those two figures. Its other results are modelled estimates from its own clients. We do not repeat the totals.
Shopper and retailer behaviour
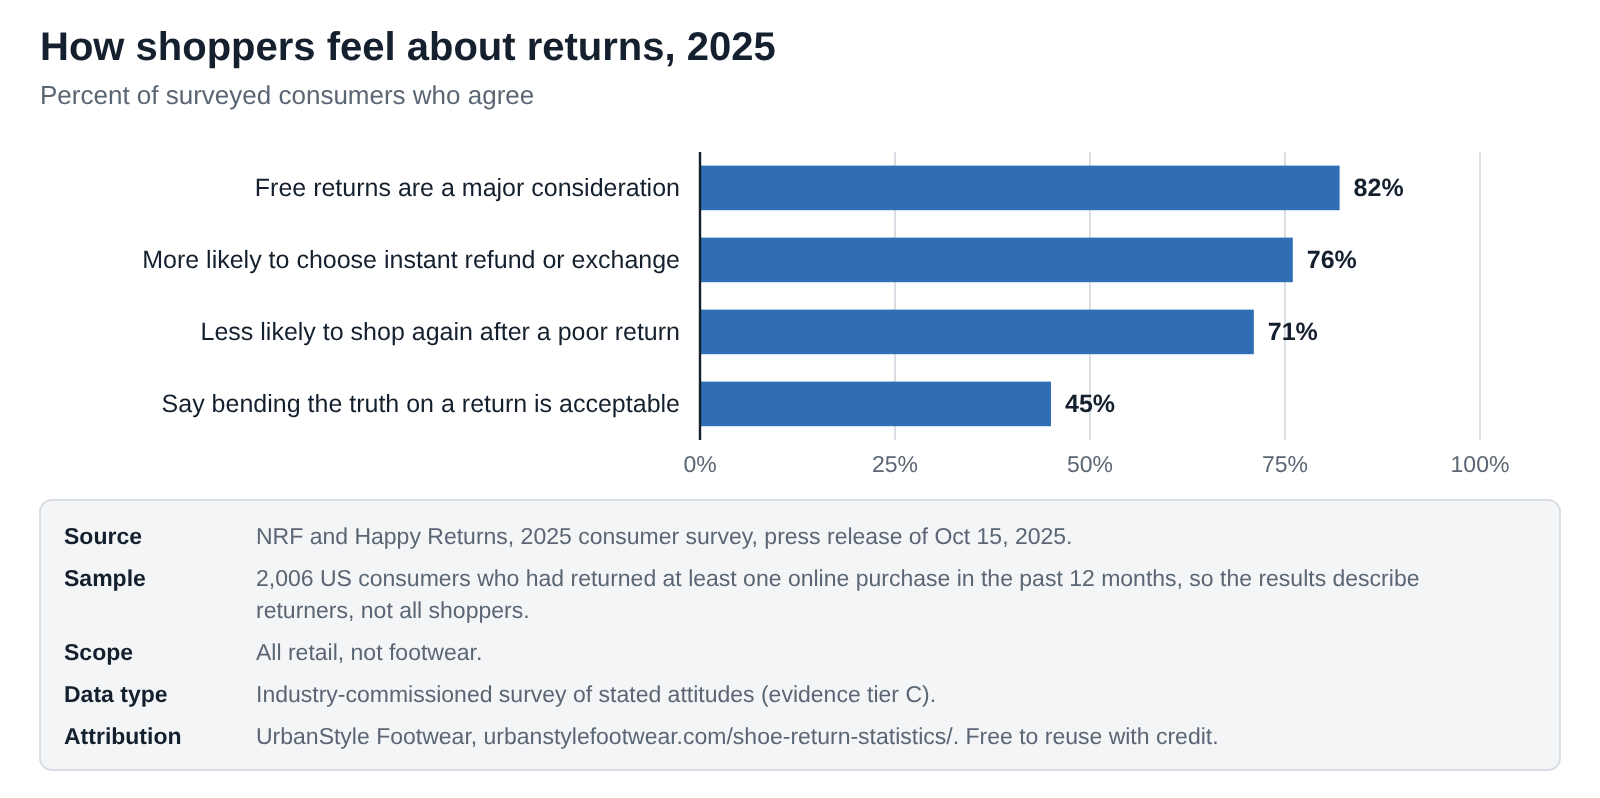
NRF and Happy Returns surveyed 2,006 consumers who had returned an online purchase in the past 12 months and 358 e-commerce professionals at large retailers. Because the consumers all returned something, the results describe returners, not every shopper. C
Embed this chart
<figure style="margin:0"><a href="https://urbanstylefootwear.com/shoe-return-statistics/"><img src="https://urbanstylefootwear.com/wp-content/uploads/2026/10/usf-shopper-attitudes-to-returns-2025.png" alt="Bar chart of shopper attitudes to returns: 82 percent say free returns matter, 76 percent prefer instant refunds or exchanges, 71 percent are less likely to shop again after a poor return, 45 percent say bending the truth is acceptable" width="800" style="max-width:100%;height:auto"></a><figcaption>Source: UrbanStyle Footwear, based on NRF and Happy Returns, 2025. <a href="https://urbanstylefootwear.com/shoe-return-statistics/">Shoe Return Statistics 2026</a></figcaption></figure>Click the code, press Ctrl+C (Cmd+C on Mac), and paste it into any web page. Please keep the attribution link.
View as table
| Statement | Share of consumers (%) | Source |
|---|---|---|
| Free returns are a major consideration | 82 | NRF and Happy Returns, 2025 |
| More likely to choose instant refund or exchange | 76 | NRF and Happy Returns, 2025 |
| Less likely to shop again after a poor return | 71 | NRF and Happy Returns, 2025 |
| Say bending the truth on a return is acceptable | 45 | NRF and Happy Returns, 2025 |
- About four in five consumers said they would share a negative returns experience with friends and family.
- 45% said bending the truth on a return is acceptable. NRF estimates that 9% of returns are fraudulent.
- 85% of retailers use AI to detect or prevent return fraud, and 64% said updating their returns process in the next six months is a priority.
- For the holidays, retailers expect about 17% of holiday sales to be returned. Their plans include third-party logistics partners (49%), seasonal staff (43%) and longer return windows (37%).
- In Appriss’s survey of more than 1,000 consumers, 90% said they would buy again after receiving a warning about their returns.
- In Europe, Zalando warns customers with persistently excessive returns, then restricts account functions, and can pause an account for 12 months. This is not a US policy and it gives no return-rate figure. D
What to watch next
We do not forecast. These are the signals worth tracking, each with its source.
- Retailer priorities. NRF’s 2025 report says retailers’ top 2026 priorities are increasing online sales and reducing return rates. C
- Fee and policy changes. Fees, shorter windows and account restrictions are all being used or discussed. Watch the brand pages in the policy table.
- The next NRF report. NRF published its 2024 report in December 2024 and its 2025 report in October 2025. We will update this page when the 2026 report appears.
- A real footwear number. A shoe-only return rate from retailer records, with a stated method, would settle much of this page. If you publish one, tell us.
We record every change in the freshness log.
What existing shoe return articles get wrong
Most shoe return content shares the same weaknesses. This page is built to avoid each one.
- Problem 1They quote a shoe return rate with no source, or with a source that does not contain the number.
- Problem 2They treat a range such as “20% to 35%” or “50% or more” as established fact.
- Problem 3They mix returned orders, items and dollars.
- Problem 4They present a 2010 Zappos figure as a current industry rate.
- Problem 5They apply apparel or all-retail rates to shoes.
- Problem 6They treat a software vendor’s client benchmark as an industry average.
- Problem 7They quote NRF’s $849.9 billion or $890 billion as footwear returns.
- Problem 8They compare NRF years without noting that the method and partner changed.
- Problem 9They repeat return-window claims without a date. Zappos’s own help page says 60 days, so check the date on anything older.
- Problem 10They repeat landfill and emissions totals that name no source.
What these findings mean for shoppers
Fit is the most common reason shoes go back, and policies vary a lot. These steps are practical advice, separate from the research above.
- Get your size right before you order. Measure at home with our foot measuring guide, convert between systems with the size conversion calculator, and see why sizes differ in our shoe size statistics.
- Read the return policy before you buy. Check the window, who pays, and the wear rule using the policy table. A long window helps only if the shoes can be worn or tried as the policy allows.
- Match your try-on method to the policy. If a policy says unworn, try shoes indoors on a clean surface and keep the packaging. If it offers a trial run, such as Brooks’s 90 days, wear them for real routes and note how they feel.
- Use store returns when allowed. About 29% of returned dollars in Appriss’s data were online purchases returned in a store, and some brands make store returns free.
- Be careful with ordering two sizes. Retailers track return patterns. HOKA says it may deny abusive requests, and Zalando restricts accounts with persistent excessive returns. If you bracket, send back the extra pair promptly.
- Watch for exclusions. Final sale, clearance and custom items are often not returnable, and defects after the window are handled by warranty.
- Get more from each pair. The cheapest return is the one you avoid. See how long walking shoes last, our shoe care guide, and comparisons such as New Balance vs Brooks vs Hoka and the best running shoes under $100. For price context, see our US footwear market statistics.
Sources and evidence tiers
Evidence hierarchy
- APrimary peer-reviewed research. Original data in a peer-reviewed journal. Only the Buldt and Menz review on shoe fit is in this tier. No peer-reviewed study of shoe return rates is cited here.
- BOfficial statistics. Government data. We found none that reports shoe returns, which is itself a finding.
- CIndustry research, surveys and company statements. NRF, Happy Returns and Appriss Retail research, and brands’ own published return policies. Useful, but the publisher may have a commercial interest.
- DSecondary reporting. A publication or vendor summarising someone else’s data, including trade press, blogs and commissioned studies read through news reports.
- EEstimates and calculations. Our own arithmetic and comparisons are labelled E, with the method stated.
Primary versus secondary data
Primary source: the organisation that collected or published the original data, or a company describing its own policy. Secondary source: a publication summarising someone else’s data. For several shoe return rates we could only read a secondary report, and the table says so.
Source table
| Source | Year | Sample | Geography | Finding used | Tier | Series ID | Primary source |
|---|---|---|---|---|---|---|---|
| National Retail Federation and Happy Returns (a UPS company), "Consumers Expected to Return Nearly $850 Billion in Merchandise in 2025" (press release, Oct 15, 2025) | 2025 | Consumer survey of 2,006 people who returned at least one online purchase in the past 12 months; retailer survey of 358 e-commerce professionals at US merchants with over $500 million in revenue; fielded in summer 2025 (exact dates not stated) | United States | Projected returns of $849.9 billion, 15.8% of sales, 19.3% of online sales; 9% of returns fraudulent; consumer and retailer attitudes | C | n/a | NRF press release |
| National Retail Federation and Happy Returns, "NRF and Happy Returns Report: 2024 Retail Returns to Total $890 Billion" (press release, Dec 5, 2024) | 2024 | Consumer survey of 2,007 people who returned at least one online purchase in the past year; retailer survey of 249 e-commerce and finance professionals at large US retailers (over $500 million in revenue); fielded in fall 2024 | United States | Projected returns of $890 billion, 16.9% of sales; 51% of Gen Z bracket; 76% say free returns are a key factor | C | n/a | NRF press release |
| National Retail Federation and Appriss Retail, "$743 Billion in Merchandise Returned in 2023" (press release) | 2023 | NRF survey paired with Appriss Retail returns data; Appriss customers include 60 of the top 100 US retailers. NRF says the method changed, so 2023 cannot be compared with its 2022 report | United States | $743 billion returned, 14.5% of sales; online 17.6%, in-store 10.02%; fraud losses $101 billion | C | n/a | NRF press release |
| Retail TouchPoints, "NRF: Returns Reach 14.5% of Sales in 2023, Fraud Contributed $101 Billion in Losses" | 2023 | Trade-press report of the NRF and Appriss Retail 2023 release | United States | NRF 2022 returns of nearly $817 billion, 16.5% of sales; methodology note | D | n/a | Retail TouchPoints article |
| Appriss Retail, "Appriss Retail Benchmark Report Uncovers $796B in Total Retail Loss" (Business Wire release, Feb 19, 2026) | 2025 | Consumer survey of more than 1,000 people plus analysis of in-store and online returns across 250 million unique customer identifiers; number of retailers not stated | United States | $706 billion returned in 2025; channel split of returns; $100 billion preventable loss from fraud and abuse; return rate not stated | C | n/a | Business Wire release |
| Buldt AK and Menz HB, "Incorrectly fitted footwear, foot pain and foot disorders: a systematic search and narrative review of the literature", Journal of Foot and Ankle Research 11:43 (2018) | 2018 | 18 studies, 3,205 participants | Multiple countries (review) | 63% to 72% of wearers wore shoes that did not accommodate the length or width of their feet; fit definitions vary | A | DOI 10.1186/s13047-018-0284-z | Journal article |
| Retail Insider, "Online clothing leads e-commerce returns, with sizing driving most send-backs: Overnight Glasses" (Jul 3, 2026), reporting a study commissioned by Overnight Glasses | 2026 | Survey of 1,882 online shoppers, June 2026; geography not stated; commissioned by an eyewear brand; full methodology not published in the article | Not stated | 56% of online shoes and boots returned; footwear 13.9% of reported returns; mostly sizing issues; about 90% of footwear returns accepted by retailers | D | n/a | Retail Insider article |
| Apparel Resources, "Over a third of online-bought fashion and footwear products get returned, says report" (Jul 31, 2024), reporting Return Prime data | 2024 | Return Prime platform data; sample not stated | India | 17.6% of all online products returned, 30% to 35% in certain categories such as clothing and shoes; size concerns almost 40% of returns | D | n/a | Apparel Resources article |
| Footwear Magazine, "What's the return rate for shoes purchased online?" (undated) | n/a | Trade article citing a 2010 Zappos disclosure and the Narvar 2022 State of Returns; no original data | United States | Zappos customers returned 35% of items ordered on average (March 2010); 63% of consumers bracket (Narvar, 2022) | D | n/a | Footwear Magazine article |
| British Footwear Association, "Footwear Return Rates: How Does Your Business Measure Up?" (member survey article) | n/a | Survey of BFA members, all with e-commerce sites; number of respondents, survey date and the unit counted (orders, pairs or value) are not stated in the article | United Kingdom | Online footwear return rate median 19% (range 2% to 31%); in-store median 5% (range 0.55% to 21%) | C | n/a | BFA article |
| eightx, "Footwear Return Rate Benchmarks: What's Normal in 2026" (blog) | 2026 | Compilation of third-party figures; no original return-rate survey | United States (as cited) | Cites Coresight Research (US online apparel and footwear 24.4%, April 2023); original not read | D | n/a | eightx article |
| Corso, "Footwear returns and the online fit problem" (blog) | n/a | Compilation of third-party figures; no original data | Mixed | Cites PowerReviews (57% of footwear returns due to poor fit), Taggstar (up to 70%) and a Statista online footwear return rate of 18% | D | n/a | Corso article |
| PRIME AI, "Industry Benchmarks for Clothing Return Rates by Product Category and Country" | n/a | Vendor article; no sources or methods cited | Global | States a 27% global online return rate for shoes with no source; shown only as an example of an unsourced figure | D | n/a | PRIME AI article |
| Baker Retailing Center, Wharton School, "Shoppers Face New Return Fees as Retailers Crack Down on Holiday Exchanges" (Jan 8, 2026) | 2026 | Article; original sources for its figures are not named | United States | Typical mail-in return fee of $4 to $12 at many major stores | D | n/a | Baker Retailing Center article |
| FashionUnited, "Zalando penalises 'excessive' returns" | 2025 | News report of a company policy | Europe | Zalando warns, then restricts, then pauses for 12 months accounts with persistently excessive returns | D | n/a | FashionUnited article |
| Optoro, "Sustainability at Optoro" (company page) | n/a | Company page; the two industry-scale figures carry no source or year | United States | States 9.6 billion pounds of returns go to landfill and about 27 million tons of CO2 are emitted each year; not used on this page | D | n/a | Optoro page |
| Brooks Running, Returns Center (company help page, read Oct 9, 2026) | 2026 | Company policy page | United States | 90-day trial run; free returns; no shipping or restocking fee | C | n/a | Brooks returns page |
| Nike, Returns Policy (company help page, read Oct 9, 2026) | 2026 | Company policy page | United States | 60 days; free for Nike Members; proof of purchase needed; worn shoes not addressed on the page | C | n/a | Nike returns policy |
| Zappos, Shipping and Returns (company help page, read Oct 9, 2026) | 2026 | Company policy page | United States | 60 days of purchase; free return shipping to the warehouse; items must be unworn and in original packaging; restocking fee up to 50% for noncompliant returns | C | n/a | Zappos help page |
| New Balance, Return Policy (company help page, read Oct 9, 2026) | 2026 | Company policy page | United States | 45 days; in-store returns free; online returns free for members; $5 restocking fee for non-member online returns; worn or damaged items may be refused | C | n/a | New Balance return policy |
| HOKA, 30 Day Guarantee "Fly for 30" (company page, read Oct 9, 2026) | 2026 | Company policy page | United States | 30 days from purchase, 60 days for HOKA members; full refund or exchange; worn shoes and return shipping cost not addressed on the page | C | n/a | HOKA guarantee page |
| adidas, 30 Day Guarantee for Performance Footwear (company page, read Oct 9, 2026) | 2026 | Company policy page | United States | 30 days; return in any condition; applies to performance footwear | C | n/a | adidas guarantee page |
| UrbanStyle Footwear calculations from the sources above | 2026 | Arithmetic on published figures; method stated beside each | United States | Derived changes, sums and ranges | E | n/a | Methodology |
Methodology and limitations
How we built this page. Every statistic was traced to its original source and read there wherever possible. We recorded the source, publication date, data year, sample or population and what kind of evidence it is. Where we calculate a number (changes, sums, ranges), it is labelled E and the method is in the dataset. Brand policies were read directly from each brand’s US help page on October 9, 2026.
What we left out. We did not use cost-per-return figures, environmental totals with no source, brand-level return rates, claims that size tools cut returns by a stated percentage, an unnamed UK study’s 93% fit figure, or any figure we could not tie to a named source.
Limitations you should know about
- No shoe-only US return rate exists in what we found. The footwear figures are surveys, vendor data and single-retailer disclosures from different places and years.
- NRF figures are estimates. They come from surveys of retail professionals, the sample is weighted to large retailers, and NRF changed its method in 2023. The 2025 release does not give exact fieldwork dates or margins of error.
- Appriss Retail’s release does not state how many retailers are in its data or what return rate it implies. The 29% and 19% channel shares and the $100 billion figure are as reported in the release; the 48% is our sum.
- The 56% figure comes from a commissioned study read through a news article. Its geography and full method are not published there.
- Several rates are secondhand. The Coresight and Statista figures are as cited by blogs, and the Zappos figure is from a 2010 disclosure reported by a trade magazine.
- Peer-reviewed fit evidence is about wearers, not returns, and definitions of fit vary between the 18 studies.
- The British Footwear Association survey does not state its respondent count, date or the unit counted, so treat its 19% median as a rough trade guide.
- Brand policies change. We read six US pages on one day. Some pages do not say whether worn shoes are accepted. Third-party retailers may apply different terms.
- Dates. Some sources (Footwear Magazine, Corso, PRIME AI) are undated.
Data freshness
| Date | Change |
|---|---|
| October 8, 2026 | First publication. Data read from NRF, Happy Returns, Appriss Retail, a peer-reviewed review, trade reports and six brand help pages. Downloadable dataset, charts and calculations with stated methods. |
| October 9, 2026 | Re-read all six brand return pages and the NRF 2025 release against their sources; no figures changed. Replaced a secondhand citation of the British Footwear Association survey with the original BFA article, and removed one detail about Nike ID capture that the page no longer repeats. |
| January 2027 | Next scheduled review, or sooner if NRF publishes its 2026 returns report. |
Last full source review: October 9, 2026. Next scheduled review: January 2027.
Corrections. If you find an error or have better data, email info@urbanstylefootwear.com with the subject “Data correction”. We will review it and note any change in the table above. How we test and review products is explained in our methodology.
For journalists and researchers
Looking for shoe return data for an article, report or research project? You can use the statistics and charts on this page with attribution to UrbanStyle Footwear. Whenever possible, please cite the original source listed with each statistic. Our own calculations are marked tier E and can be cited to us.
Media kit
All figures with value, unit, geography, segment, basis, period, source and evidence tier.
Five charts with source, scope and data type printed on each image. SVG versions are under each chart above.
The 15 citable statistics on one printable PDF.
Every source with year, sample, geography, tier, series ID and link.
Ready-made citations below. Media and research enquiries go to info@urbanstylefootwear.com.
Cite this page
Suggested citation
UrbanStyle Footwear. “Shoe Return Statistics 2026: Return Rates, Reasons, Costs and Policies.” Updated October 9, 2026. https://urbanstylefootwear.com/shoe-return-statistics/
APA style
Vahith, A. (2026, October 8). Shoe return statistics 2026: Return rates, reasons, costs and policies. UrbanStyle Footwear. https://urbanstylefootwear.com/shoe-return-statistics/
Link (HTML)
<a href="https://urbanstylefootwear.com/shoe-return-statistics/">Shoe Return Statistics 2026 by UrbanStyle Footwear</a>Click any citation, then press Ctrl+C (Cmd+C on Mac) to copy it.
For individual statistics, UrbanStyle recommends citing the original source listed in the source table whenever possible.
Data requests. Data correction or dataset request: info@urbanstylefootwear.com
Frequently asked questions
What is the return rate for shoes bought online?
There is no official US figure. Published estimates we could chart run from 19% to 56%, and they measure different things. For all online retail, NRF and Happy Returns estimate 19.3% for 2025. See the comparison.
What percentage of shoes are returned?
No source we could verify gives a share for all US shoe sales. Retail-wide, retailers estimate that 15.8% of 2025 sales would be returned (NRF and Happy Returns). Shoes are among the more-returned online categories in every footwear source we read.
Why are shoes returned so often?
Fit and sizing are the reason sources name most. A peer-reviewed review found that 63% to 72% of wearers in 18 studies wore shoes that did not fit the length or width of their feet. Bracketing, buying several sizes to return some, also adds returns. See why shoes get returned.
How many returns happen in the US each year?
NRF and Happy Returns project $849.9 billion for 2025, or 15.8% of sales. Appriss Retail reports $706 billion. They use different methods, so we show both.
What is bracketing?
Buying more than one size or version of an item with the intention of returning some. In NRF and Happy Returns’ 2024 survey, 51% of Gen Z consumers said they bracket. A 2022 Narvar survey, as cited by Footwear Magazine, put it at 63% of consumers for at least some online purchases.
Is it better to return shoes in store or by mail?
It depends on the brand. In Appriss’s data, 29% of returned dollars were bought online and returned in a store. New Balance says all in-store returns are free, while online returns are free only for members. Check the policy.
Can you return worn shoes?
It depends. adidas accepts performance footwear in any condition within 30 days, and Brooks offers a 90-day trial run. Zappos requires shoes to be unworn, and New Balance may refuse worn items. Nike’s and HOKA’s pages do not say, so ask before you wear them.
How long do I have to return shoes?
Across six brands, from 30 days (HOKA, adidas performance footwear) to 90 days (Brooks), with Nike and Zappos at 60 and New Balance at 45. HOKA gives members 60 days. See the policy table.
What is Zappos’s return window?
Zappos’s own help page, read on October 9, 2026, says items may be returned within 60 days of purchase, unworn and in original packaging. Check the date on any article that gives a different window.
Do retailers charge for shoe returns?
Some do. New Balance charges non-members a $5 restocking fee on online returns, and Zappos says noncompliant returns could incur a fee of up to 50%. Brooks says its returns are free with no restocking fee, and Nike returns are free for Nike Members.
How much does a shoe return cost the retailer?
We found no verified figure. Per-pair numbers in vendor blogs do not state a method, so we do not use them.
How common is return fraud?
NRF and Happy Returns estimate that 9% of 2025 returns were fraudulent. Appriss Retail reports $100 billion of preventable 2025 loss from returns fraud and abuse, and separates abuse ($86 billion) from fraud. They define the terms differently.
Are online shoe returns bad for the environment?
Returns add shipping and handling, but we could not verify the totals that circulate, because the landfill and CO2 figures we found name no source or year. We would rather say that than repeat them.
Why do different websites give different shoe return rates?
They count different things, in different places and years: orders, items or dollars; one retailer or a market; survey recall or records. Our comparison table shows what each figure covers.
Can I use this data in my article?
Yes, with attribution to UrbanStyle Footwear and, where possible, the original source. Download the dataset and charts from the media kit and see the citation formats.