
A sourced, evidence-graded look at how big the US footwear market is, who supplies it, what it costs and where it is heading, with the data free to download and cite.
One market, five different numbers. Select a lens to see what each figure counts.
Select a lens above, for example “Shoe stores only”, to see why the headline numbers disagree.
$121.15BUS household spending on footwear in 2025, all channels, current dollars. Source: BEA, tier B. This is the broadest official figure, and the one FDRA rounds to $121 billion.
$354BEA spending divided by BEA's population estimate of 341.9 million, for 2025. An UrbanStyle calculation, tier E.
$461Average footwear spending per consumer unit in 2024, from the BLS Consumer Expenditure Survey. A different method from the national accounts, so it cannot be used to rebuild the total.
$38.72BSales by shoe-store establishments in 2025 (Census, summed by UrbanStyle). About 32% of the BEA total. It leaves out online-only sellers, department stores, mass merchants and sporting-goods chains.
$47.9BIBISWorld's 2025 revenue estimate for internet shoe retailers, up 3.6%. A proprietary industry definition, tier D, that overlaps with the other figures in ways nobody publishes.
These figures are not parts of one total. Full reconciliation: how big is the market?
US footwear market research at a glance
Quick answer. Americans spent $121.15 billion on footwear in 2025, according to the Bureau of Economic Analysis, up 4.4% on 2024. That is the broadest official measure of the market. Other numbers you will see, such as $38.7 billion for shoe stores or $47.9 billion for online shoe retailers, count narrower slices and cannot be compared with it directly. In 2026 so far, footwear prices rose faster than overall prices in spring (a 5.2% peak in May) and then eased to 3.6% in August. Circana reports dollar sales up only 1% in the first half with fewer units sold, while running shoes grew 13%. Almost every pair is imported: FDRA puts imports at about 6 pairs per person against about 25 million pairs made in the US.
This page collects the US footwear numbers we could trace to a real source, says what kind of evidence each one is, explains why headline figures disagree, and leaves out what we could not verify. If you are shopping rather than researching, skip to what this means for shoppers or read our ultimate footwear buying guide.
Key findings
- US households spent $121.15 billion on footwear in 2025, up 4.4%. FDRA’s “$121 billion” is the same BEA figure, rounded.
- Adjusted for prices, 2025 growth was 4.3% while BEA’s footwear price index rose just 0.1%. Growth came from volume, not from higher prices.
- From 2019 to 2025, footwear spending rose 31.9% in dollars and 23.4% after adjusting for prices. The BLS footwear index rose 7.0% from December 2019 to December 2025, against 26.1% for all items.
- Footwear is small in the household budget: about $461 a year, or roughly 0.59% of average spending in 2024.
- 2026 prices: footwear inflation peaked at 5.2% in May, then eased to 3.6% in August. FDRA expects 2026 to be the third-fastest year for footwear price rises in 34 years.
- Nearly all footwear is imported. China (964 million pairs) and Vietnam (574 million) supplied about 1.5 billion of the pairs entering the US in 2025.
- Shoe stores account for about 32% of household footwear spending, down from about 40% in 2019, so most spending now happens outside shoe-store establishments.
- Demand in 2026 is mixed. Circana reports dollar sales up 1% in the first half with units down, running up 13%, and nearly half of consumers delaying purchases or trading down.
- Trade policy changed three times in 2026: the Supreme Court struck down IEEPA tariffs on February 20, a 10% Section 122 surcharge ran from February 24 to July 24, and Section 301 forced-labor tariffs began July 24.
What we know and what we do not know
Research integrity starts with saying where the evidence stops. This is the state of the public evidence as of October 2026.
| Question | Evidence status | Why |
|---|---|---|
| Total household spending on footwear | Strong official data | BEA national accounts, annual, revised over time |
| Spending per household | Strong official data | BLS survey, latest published year is 2024 |
| Footwear price changes | Strong official data | BLS index published monthly through August 2026 |
| Imported pairs by country | Industry report of customs data | FDRA analysis reported by trade press; we did not download the raw customs files |
| 2026 dollar and unit trends | Growth rates only | Circana publishes percentages, not dollar totals or unit counts, in its public release |
| Consumer plans and attitudes | Industry survey | 1,000 online respondents, commissioned by industry, stated intentions rather than purchases |
| Market size by channel (online vs stores) | Limited and inconsistent | Sources use different definitions and no public dataset splits footwear by channel |
| Share of footwear bought online | No official figure | Census publishes e-commerce share for all retail (17.1%), not for footwear |
| Brand market share | Not verifiable publicly | Detailed share data sits behind paid research; company results are global, not US-only |
| Average price paid per pair | Not published | No verified public pair-count series to divide spending by |
| How much of a price rise is caused by tariffs | Insufficient independent data | Price indexes do not separate tariffs from other costs |
15 US footwear statistics you can cite
Each card gives a number, a one-sentence explanation and its source. “Copy text” opens a box with the sentence, the source and a link back to this page. For any single statistic, please cite the original source listed on the card. Cards marked E are UrbanStyle calculations from official data, with the method stated.
US households spent $121.15 billion on footwear in 2025, up 4.4% from $116.06 billion in 2024, according to the Bureau of Economic Analysis.
Copy text
$121.15B spent on footwear, 2025: US households spent $121.15 billion on footwear in 2025, up 4.4% from $116.06 billion in 2024, according to the Bureau of Economic Analysis. Source: BEA via FRED (FRED series DFTWRC1A027NBEA (updated Sept 30, 2026)). Via UrbanStyle Footwear: https://urbanstylefootwear.com/us-footwear-market-statistics/
Footwear spending works out to about $354 per person in 2025 (BEA spending divided by BEA population). This is an UrbanStyle calculation.
Copy text
$354 per person, 2025: Footwear spending works out to about $354 per person in 2025 (BEA spending divided by BEA population). This is an UrbanStyle calculation. Source: UrbanStyle calculation. Via UrbanStyle Footwear: https://urbanstylefootwear.com/us-footwear-market-statistics/
In 2025 BEA's price-adjusted footwear spending rose 4.3% while its footwear price index rose 0.1%, so nearly all of the 4.4% dollar increase was volume, not price. UrbanStyle calculation from BEA series.
Copy text
+4.3% vs +0.1% volume vs price, 2025: In 2025 BEA's price-adjusted footwear spending rose 4.3% while its footwear price index rose 0.1%, so nearly all of the 4.4% dollar increase was volume, not price. UrbanStyle calculation from BEA series. Source: UrbanStyle calculation. Via UrbanStyle Footwear: https://urbanstylefootwear.com/us-footwear-market-statistics/
The average US consumer unit spent $461 on footwear in 2024, up from $314 in 2020 and $419 in 2019 (BLS Consumer Expenditure Survey).
Copy text
$461 per household, 2024: The average US consumer unit spent $461 on footwear in 2024, up from $314 in 2020 and $419 in 2019 (BLS Consumer Expenditure Survey). Source: BLS Consumer Expenditure Survey (FRED series CXUFOOTWEARLB0101M (updated Dec 19, 2025)). Via UrbanStyle Footwear: https://urbanstylefootwear.com/us-footwear-market-statistics/
Footwear was about 0.59% of average household spending in 2024 ($461 of $78,535). UrbanStyle calculation from BLS figures.
Copy text
0.59% of household budget: Footwear was about 0.59% of average household spending in 2024 ($461 of $78,535). UrbanStyle calculation from BLS figures. Source: UrbanStyle calculation. Via UrbanStyle Footwear: https://urbanstylefootwear.com/us-footwear-market-statistics/
Footwear prices were 3.6% higher in August 2026 than a year earlier, against 3.4% for all items. UrbanStyle calculation from BLS index values.
Copy text
3.6% footwear prices, Aug 2026: Footwear prices were 3.6% higher in August 2026 than a year earlier, against 3.4% for all items. UrbanStyle calculation from BLS index values. Source: UrbanStyle calculation. Via UrbanStyle Footwear: https://urbanstylefootwear.com/us-footwear-market-statistics/
Footwear price inflation peaked at 5.2% in May 2026 on the BLS footwear index, the highest of the first eight months of the year. UrbanStyle calculation from BLS index values.
Copy text
5.2% peak, May 2026: Footwear price inflation peaked at 5.2% in May 2026 on the BLS footwear index, the highest of the first eight months of the year. UrbanStyle calculation from BLS index values. Source: UrbanStyle calculation. Via UrbanStyle Footwear: https://urbanstylefootwear.com/us-footwear-market-statistics/
Children's footwear prices rose 4.7% year over year in June 2026, the fastest pace in nearly four years, according to FDRA analysis of BLS data reported by SGB Online.
Copy text
4.7% children's shoes, June 2026: Children's footwear prices rose 4.7% year over year in June 2026, the fastest pace in nearly four years, according to FDRA analysis of BLS data reported by SGB Online. Source: FDRA June 2026 via SGB Online. Via UrbanStyle Footwear: https://urbanstylefootwear.com/us-footwear-market-statistics/
About 25 million pairs of shoes were made in the US in 2025, against an average of 6 imported pairs per person, according to FDRA.
Copy text
25 million pairs made in the US: About 25 million pairs of shoes were made in the US in 2025, against an average of 6 imported pairs per person, according to FDRA. Source: FDRA. Via UrbanStyle Footwear: https://urbanstylefootwear.com/us-footwear-market-statistics/
China and Vietnam supplied 964 million and 574 million pairs of footwear to the US in 2025, according to FDRA data based on US International Trade Commission figures.
Copy text
964M + 574M pairs from China and Vietnam: China and Vietnam supplied 964 million and 574 million pairs of footwear to the US in 2025, according to FDRA data based on US International Trade Commission figures. Source: FDRA import data via World Footwear. Via UrbanStyle Footwear: https://urbanstylefootwear.com/us-footwear-market-statistics/
The US footwear industry supports about 237,000 jobs, according to FDRA.
Copy text
237,000 footwear jobs: The US footwear industry supports about 237,000 jobs, according to FDRA. Source: FDRA. Via UrbanStyle Footwear: https://urbanstylefootwear.com/us-footwear-market-statistics/
Shoe stores sold $38.72 billion in 2025, about 32% of total household footwear spending and down from about 40% in 2019. UrbanStyle sum of Census monthly data; the two series use different definitions.
Copy text
$38.7B shoe-store sales, 2025: Shoe stores sold $38.72 billion in 2025, about 32% of total household footwear spending and down from about 40% in 2019. UrbanStyle sum of Census monthly data; the two series use different definitions. Source: UrbanStyle calculation. Via UrbanStyle Footwear: https://urbanstylefootwear.com/us-footwear-market-statistics/
Circana reports US footwear dollar sales up 1% in the first half of 2026, with running footwear up 13% in both dollars and units and overall units down.
Copy text
+1% / +13% footwear / running, H1 2026: Circana reports US footwear dollar sales up 1% in the first half of 2026, with running footwear up 13% in both dollars and units and overall units down. Source: Circana. Via UrbanStyle Footwear: https://urbanstylefootwear.com/us-footwear-market-statistics/
In a July 2026 survey of 1,000 US adults, 44% planned to spend under $100 per child on back-to-school footwear, up from 40% in 2025 (AlixPartners and FDRA).
Copy text
44% plan to spend under $100 a child: In a July 2026 survey of 1,000 US adults, 44% planned to spend under $100 per child on back-to-school footwear, up from 40% in 2025 (AlixPartners and FDRA). Source: AlixPartners and FDRA, July 2026. Via UrbanStyle Footwear: https://urbanstylefootwear.com/us-footwear-market-statistics/
E-commerce was 17.1% of total US retail sales in the second quarter of 2026, up from 11.2% in the fourth quarter of 2019. The figure covers all retail, not footwear alone.
Copy text
17.1% e-commerce share of retail: E-commerce was 17.1% of total US retail sales in the second quarter of 2026, up from 11.2% in the fourth quarter of 2019. The figure covers all retail, not footwear alone. Source: Census e-commerce share (FRED series ECOMPCTSA (updated Aug 18, 2026)). Via UrbanStyle Footwear: https://urbanstylefootwear.com/us-footwear-market-statistics/
How big is the US footwear market?
The honest answer is “about $121 billion, if you mean what households spend on footwear”. Every other figure counts something narrower or different. Before quoting any market size, ask what it counts, in which year, and in what units.
Why every source gives a different number
| Measure | Value | What it counts | What it leaves out | Tier |
|---|---|---|---|---|
| BEA personal consumption expenditures, footwear | $121.15B (2025) | What households and nonprofits serving households spent on footwear, in all channels | Spending by businesses and governments; it is a national-accounts estimate, not a retailer sales count | B |
| FDRA “personal spending on footwear” | $121B (2025) | The same BEA figure, rounded | The same as above | C |
| BLS Consumer Expenditure Survey | $461 per consumer unit (2024) | What an average household-like unit reported spending on footwear | It is an average, not a total, and uses a different survey method, so total spending cannot be rebuilt from it | B |
| Census shoe stores (NAICS 4482) | $38.72B (2025, our sum) | Sales by shoe-store establishments | Online-only sellers, department stores, mass merchants and sporting-goods retailers, which together account for the rest of household spending | E |
| IBISWorld online shoe sales | $47.9B (2025) | Revenue of internet shoe retailers under IBISWorld’s definition | Which sellers count depends on IBISWorld’s proprietary industry definition, so it cannot be matched to the other figures | D |
| Market-research reports (Statista and similar) | Varies | Modelled retail or revenue values | Public pages mask the figures, so we could not check them and do not use them | E |
The measured picture
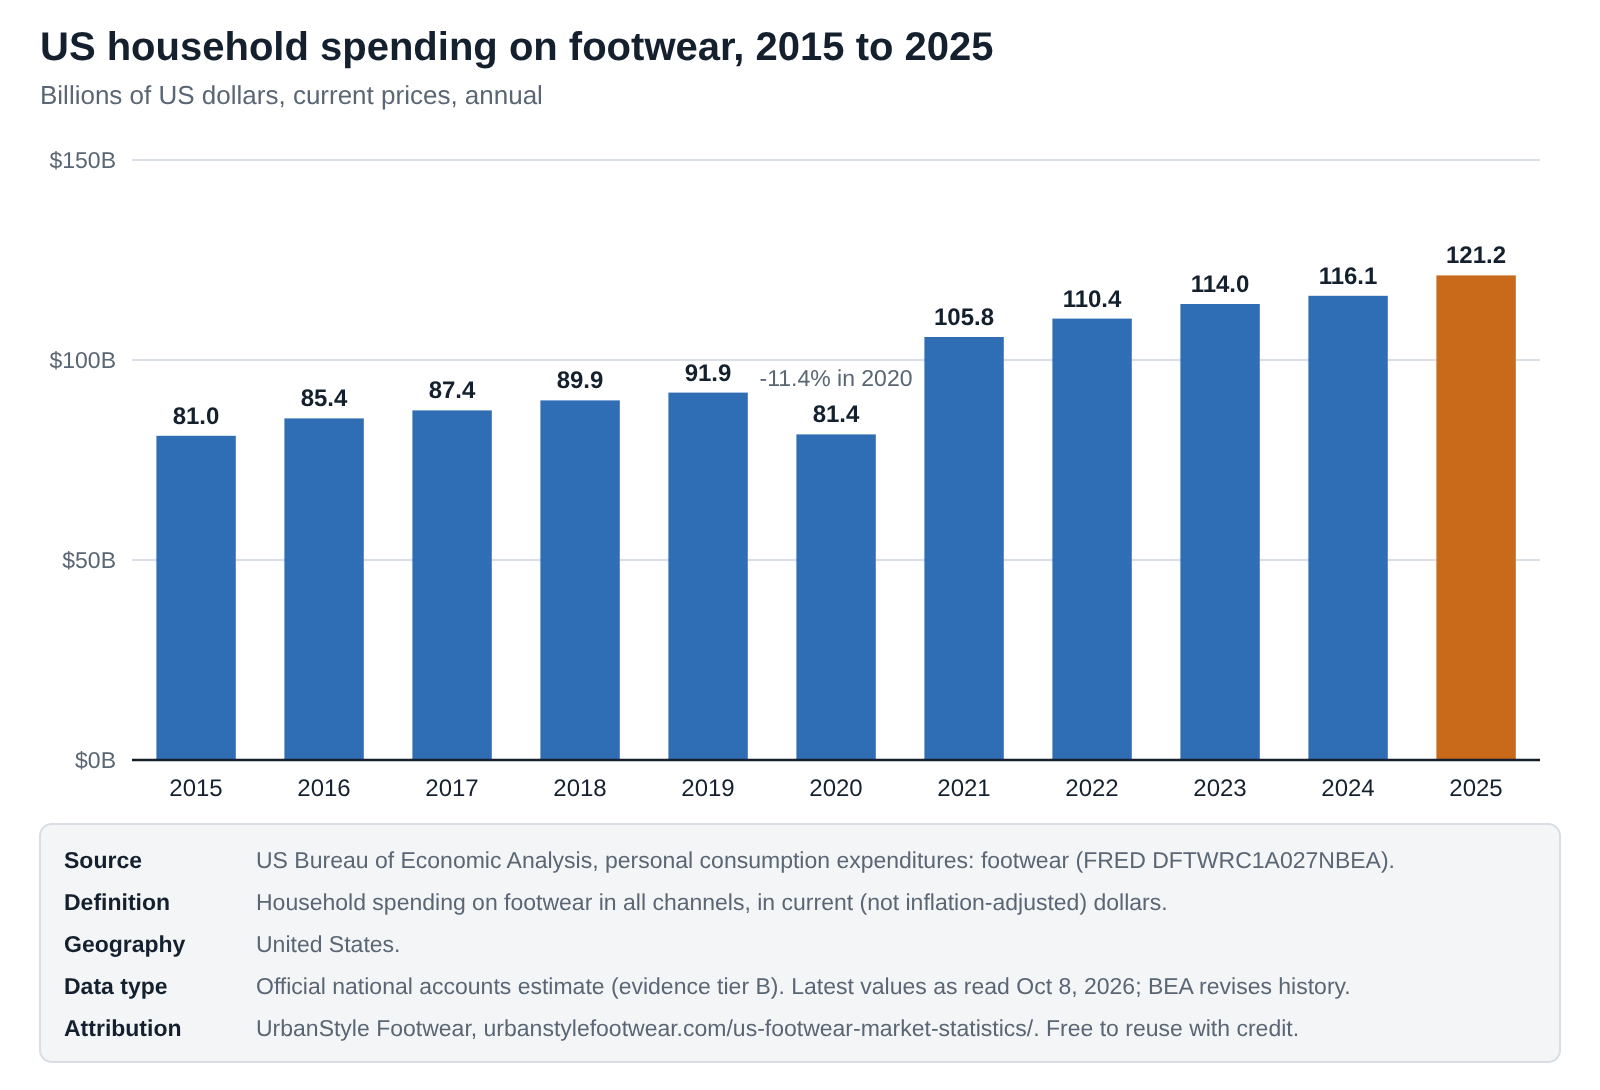
The most defensible market size is the BEA series. It reached $121.15 billion in 2025, up from $116.06 billion in 2024 (+4.4%) and $91.87 billion in 2019. In per-person terms that is about $354 in 2025, calculated by dividing BEA spending by BEA’s population estimate of 341.9 million. B E
Embed this chart
<figure style="margin:0"><a href="https://urbanstylefootwear.com/us-footwear-market-statistics/"><img src="https://urbanstylefootwear.com/wp-content/uploads/2026/10/usf-us-footwear-spending-2015-2025.png" alt="Bar chart of US household footwear spending: $81.0 billion in 2015, $91.9 billion in 2019, $81.4 billion in 2020, and $121.2 billion in 2025" width="800" style="max-width:100%;height:auto"></a><figcaption>Source: UrbanStyle Footwear, based on BEA personal consumption expenditures on footwear. <a href="https://urbanstylefootwear.com/us-footwear-market-statistics/">US Footwear Market Statistics 2026</a></figcaption></figure>Click the code, press Ctrl+C (Cmd+C on Mac), and paste it into any web page. Please keep the attribution link.
View as table
| Year | Footwear spending (billion US dollars) | Change on prior year (%) | Source |
|---|---|---|---|
| 2015 | 81.027 | n/a | BEA via FRED |
| 2016 | 85.381 | 5.4 | BEA via FRED |
| 2017 | 87.404 | 2.4 | BEA via FRED |
| 2018 | 89.919 | 2.9 | BEA via FRED |
| 2019 | 91.872 | 2.2 | BEA via FRED |
| 2020 | 81.417 | -11.4 | BEA via FRED |
| 2021 | 105.758 | 29.9 | BEA via FRED |
| 2022 | 110.365 | 4.4 | BEA via FRED |
| 2023 | 114.021 | 3.3 | BEA via FRED |
| 2024 | 116.061 | 1.8 | BEA via FRED |
| 2025 | 121.150 | 4.4 | BEA via FRED |
The jump in 2021 is the recovery from 2020, when spending fell 11.4%. Since then growth has been steady but uneven: +4.4% in 2022, +3.3% in 2023, +1.8% in 2024 and +4.4% in 2025.
Who measures what in US footwear
A pair of shoes is counted at five different points before it is worn. Each agency or company measures one of them, which is why the numbers do not line up. Select a step to see what is counted and where this page uses it.
1Imports at the borderUS International Trade Commission and Census customs data
Counts the pairs and customs value of footwear entering the US, by supplying country. This page uses FDRA’s summary of those data, reported by World Footwear. We did not download the raw files.
2Cost to the retailerLanded cost, from FDRA and import unit values
Landed cost includes the factory price, freight and duties. FDRA reports, for example, $21.17 per pair for Vietnam in 2025. It is a cost to the importer, not the shelf price.
3Retail salesCensus shoe stores and Circana tracking
Census counts sales of shoe-store establishments only. Circana tracks sales across participating retailers and publishes growth rates, but not dollar totals, in its public release.
4Household spendingBEA national accounts and the BLS household survey
BEA estimates what households spent on footwear in total ($121.15 billion in 2025). BLS asks households what they bought ($461 per consumer unit in 2024). The two use different methods.
5Consumer pricesBLS Consumer Price Index
Tracks the price of a fixed basket of footwear over time, adjusting for quality changes. It tells you how prices moved, not how many pairs were sold.
Footwear spending over time: volume vs price
Dollar spending mixes two things: how much people buy and what it costs. BEA publishes both, which lets us separate them. Its price-adjusted series (chained 2017 dollars) shows that 2025 growth of 4.3% was almost entirely volume, because BEA’s footwear price index barely moved (+0.1%). Earlier years look different: in 2022 spending rose 4.4% in dollars, but price-adjusted spending fell 0.2%, because prices rose 4.6%.
| Year | Spending (billion US dollars) | Change | Price-adjusted change | BEA footwear price change | Per person (US dollars) |
|---|---|---|---|---|---|
| 2015 | 81.0 | n/a | n/a | n/a | 252 |
| 2016 | 85.4 | +5.4% | +5.0% | +0.4% | 263 |
| 2017 | 87.4 | +2.4% | +2.8% | -0.5% | 267 |
| 2018 | 89.9 | +2.9% | +3.3% | -0.5% | 273 |
| 2019 | 91.9 | +2.2% | +1.7% | +0.5% | 278 |
| 2020 | 81.4 | -11.4% | -9.1% | -2.5% | 245 |
| 2021 | 105.8 | +29.9% | +25.3% | +3.7% | 318 |
| 2022 | 110.4 | +4.4% | -0.2% | +4.6% | 330 |
| 2023 | 114.0 | +3.3% | +3.1% | +0.3% | 338 |
| 2024 | 116.1 | +1.8% | +1.1% | +0.7% | 341 |
| 2025 | 121.2 | +4.4% | +4.3% | +0.1% | 354 |
BEA revises its numbers. An earlier BEA release (seen on FRED in December 2025) showed $116.174 billion for 2024. The series we read on October 8, 2026 shows $116.061 billion. Articles that quote the older figure are not wrong about the source, but they are out of date. We record the date each series was read.
Longer-run context
- From 2019 to 2025, spending rose 31.9% in current dollars and 23.4% after adjusting for prices. Spending per person rose about 27% over the same period.
- BEA’s footwear price index rose 6.9% from 2019 to 2025. The BLS footwear index rose 7.0% from December 2019 to December 2025, while the all-items index rose 26.1%. Footwear prices have risen far more slowly than prices in general over six years.
- Both BEA and BLS price indexes adjust for quality changes, so they do not capture every way a pair of shoes can get more expensive, such as a shift to higher-priced models.
How much does the average household spend on footwear?
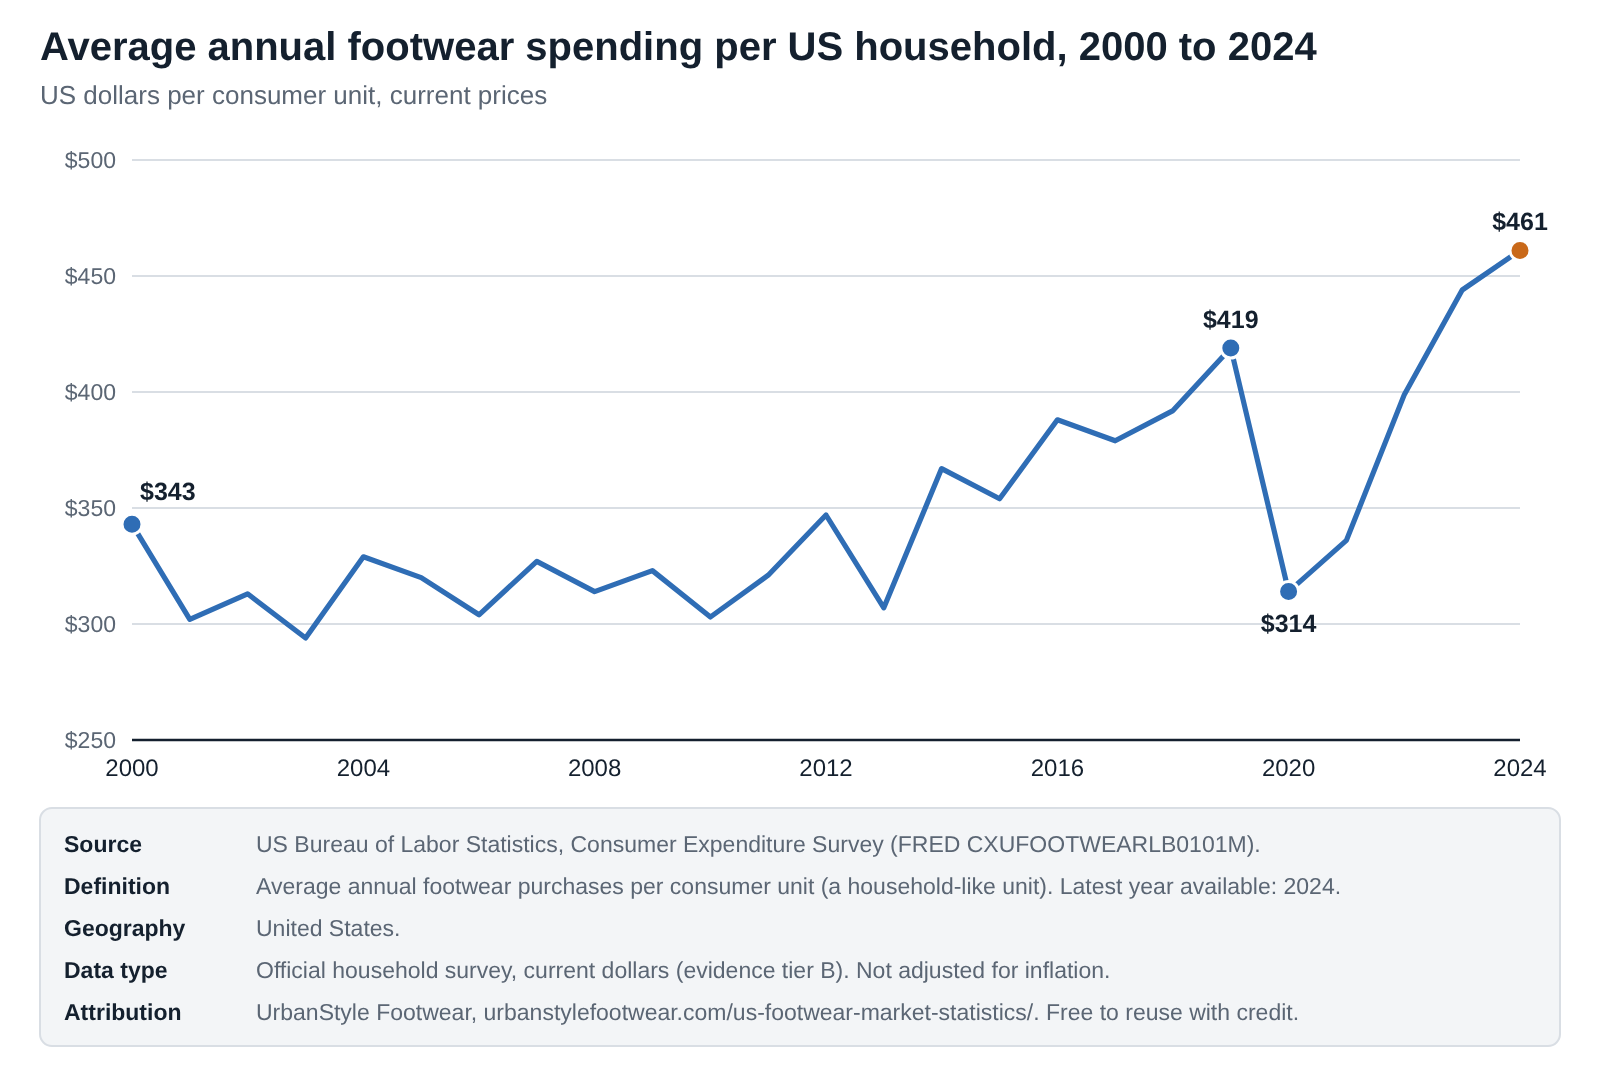
The Bureau of Labor Statistics Consumer Expenditure Survey reports $461 per consumer unit in 2024, the latest year in the series we read. A consumer unit is a household-like group that shares expenses. That is up 10.0% from $419 in 2019, and up 46.8% from the pandemic low of $314 in 2020. B
Embed this chart
<figure style="margin:0"><a href="https://urbanstylefootwear.com/us-footwear-market-statistics/"><img src="https://urbanstylefootwear.com/wp-content/uploads/2026/10/usf-footwear-spending-per-household-2000-2024.png" alt="Line chart of BLS average footwear spending per household: $343 in 2000, $419 in 2019, $314 in 2020, $461 in 2024" width="800" style="max-width:100%;height:auto"></a><figcaption>Source: UrbanStyle Footwear, based on BLS Consumer Expenditure Survey. <a href="https://urbanstylefootwear.com/us-footwear-market-statistics/">US Footwear Market Statistics 2026</a></figcaption></figure>Click the code, press Ctrl+C (Cmd+C on Mac), and paste it into any web page. Please keep the attribution link.
View as table
| Year | Footwear spending per consumer unit (US dollars) | Source |
|---|---|---|
| 2000 | 343 | BLS CE via FRED |
| 2001 | 302 | BLS CE via FRED |
| 2002 | 313 | BLS CE via FRED |
| 2003 | 294 | BLS CE via FRED |
| 2004 | 329 | BLS CE via FRED |
| 2005 | 320 | BLS CE via FRED |
| 2006 | 304 | BLS CE via FRED |
| 2007 | 327 | BLS CE via FRED |
| 2008 | 314 | BLS CE via FRED |
| 2009 | 323 | BLS CE via FRED |
| 2010 | 303 | BLS CE via FRED |
| 2011 | 321 | BLS CE via FRED |
| 2012 | 347 | BLS CE via FRED |
| 2013 | 307 | BLS CE via FRED |
| 2014 | 367 | BLS CE via FRED |
| 2015 | 354 | BLS CE via FRED |
| 2016 | 388 | BLS CE via FRED |
| 2017 | 379 | BLS CE via FRED |
| 2018 | 392 | BLS CE via FRED |
| 2019 | 419 | BLS CE via FRED |
| 2020 | 314 | BLS CE via FRED |
| 2021 | 336 | BLS CE via FRED |
| 2022 | 399 | BLS CE via FRED |
| 2023 | 444 | BLS CE via FRED |
| 2024 | 461 | BLS CE via FRED |
Footwear is a small line in the budget. BLS reports total average annual expenditures of $78,535 per consumer unit for 2024, so $461 is about 0.59% of spending (UrbanStyle calculation). The broader apparel and services category was $2,001 that year. BLS does not publish a combined footwear figure in the news release, so footwear comes from the FRED series.
Do not multiply $461 by an estimate of US households and compare it with the BEA total. The two come from different methods, and survey respondents tend to report differently from national-accounts estimates. Use each for what it measures: BEA for the market, BLS for the typical household.
Footwear prices in 2026
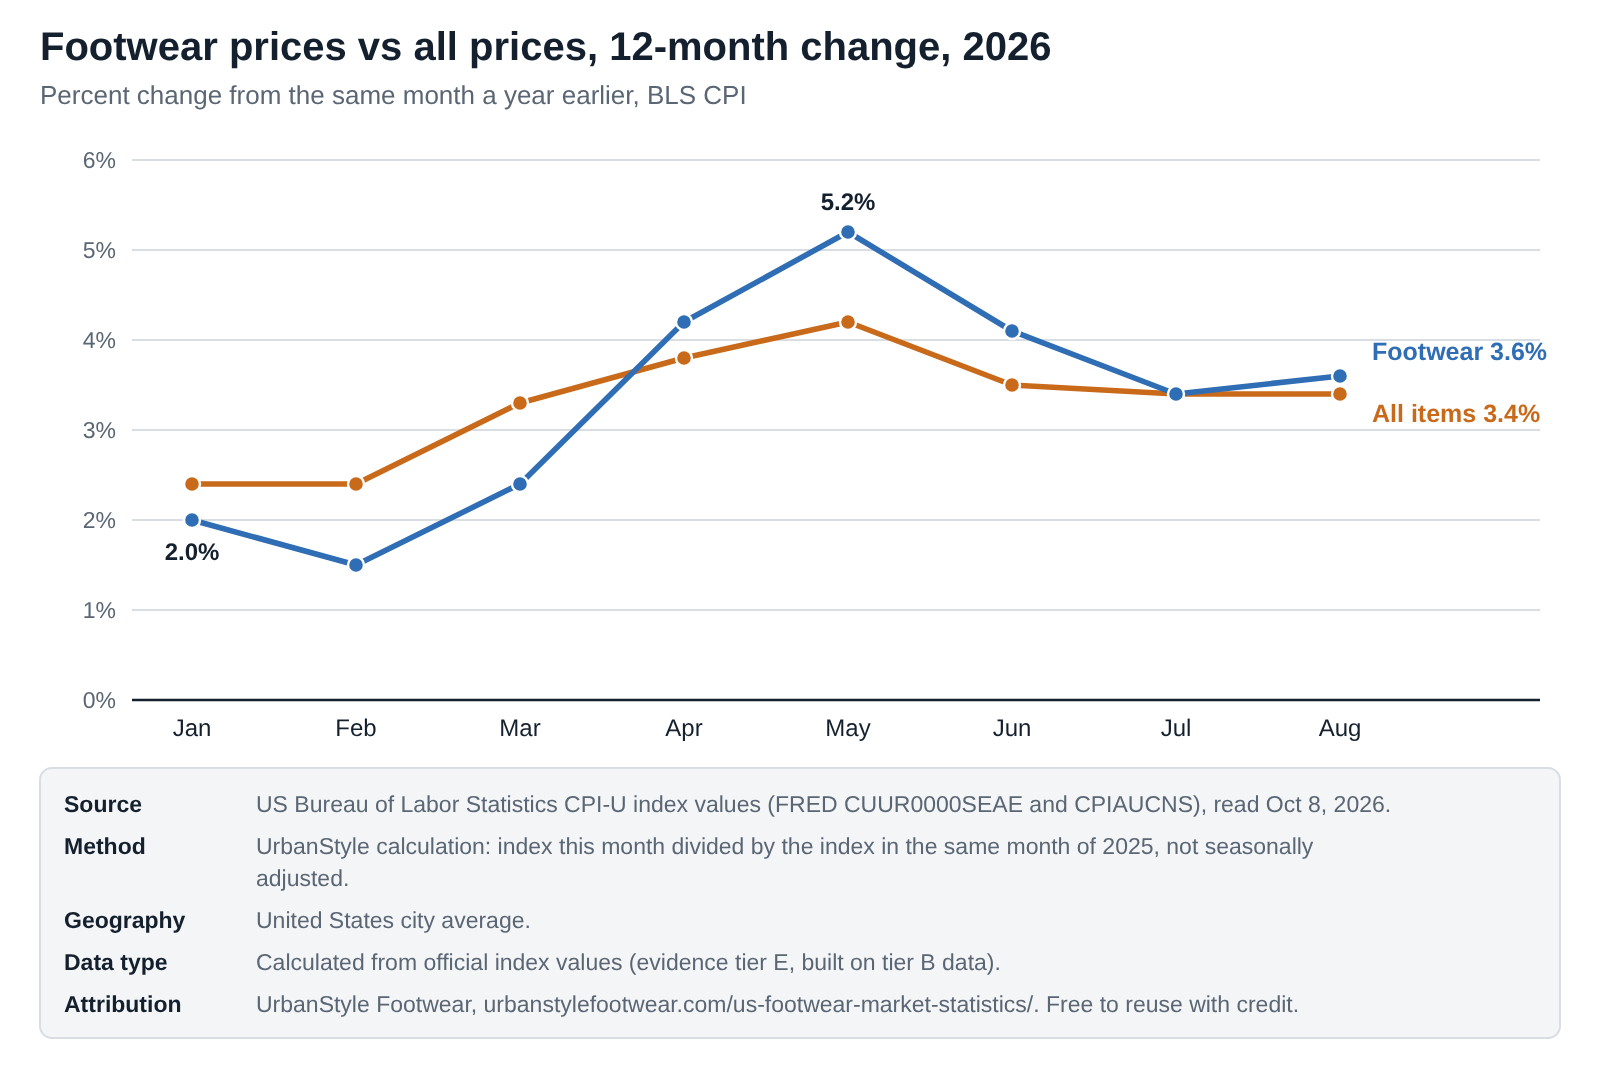
Footwear prices were 3.6% higher in August 2026 than in August 2025, against 3.4% for all items. That sounds close, but the spring was different: footwear inflation climbed from 2.0% in January to 5.2% in May, above the 4.2% headline rate, before easing. E
Footwear prices vs all prices, month by month
Choose a month to compare the 12-month change in the BLS footwear index with the all-items index.
Select a month above.
Jan 2026. Footwear prices were 2.0% higher than in Jan 2025. All items were 2.4% higher. Footwear ran 0.4 percentage points below the headline rate.
Feb 2026. Footwear prices were 1.5% higher than in Feb 2025. All items were 2.4% higher. Footwear ran 0.9 percentage points below the headline rate.
Mar 2026. Footwear prices were 2.4% higher than in Mar 2025. All items were 3.3% higher. Footwear ran 0.9 percentage points below the headline rate.
Apr 2026. Footwear prices were 4.2% higher than in Apr 2025. All items were 3.8% higher. Footwear ran 0.4 percentage points above the headline rate.
May 2026. Footwear prices were 5.2% higher than in May 2025. All items were 4.2% higher. Footwear ran 1.0 percentage points above the headline rate.
Jun 2026. Footwear prices were 4.1% higher than in Jun 2025. All items were 3.5% higher. Footwear ran 0.6 percentage points above the headline rate.
Jul 2026. Footwear prices were 3.4% higher than in Jul 2025. All items were 3.4% higher. Footwear ran level with the headline rate.
Aug 2026. Footwear prices were 3.6% higher than in Aug 2025. All items were 3.4% higher. Footwear ran 0.2 percentage points above the headline rate.
Embed this chart
<figure style="margin:0"><a href="https://urbanstylefootwear.com/us-footwear-market-statistics/"><img src="https://urbanstylefootwear.com/wp-content/uploads/2026/10/usf-footwear-prices-vs-all-items-2026.png" alt="Line chart: footwear price inflation rose from 2.0 percent in January 2026 to a 5.2 percent peak in May, then eased to 3.6 percent in August, against 3.4 percent for all items" width="800" style="max-width:100%;height:auto"></a><figcaption>Source: UrbanStyle Footwear, based on BLS CPI-U index values. <a href="https://urbanstylefootwear.com/us-footwear-market-statistics/">US Footwear Market Statistics 2026</a></figcaption></figure>Click the code, press Ctrl+C (Cmd+C on Mac), and paste it into any web page. Please keep the attribution link.
View as table
| Month 2026 | Footwear prices, 12-month change (%) | All items, 12-month change (%) | Source |
|---|---|---|---|
| Jan | 2.0 | 2.4 | UrbanStyle from BLS index values |
| Feb | 1.5 | 2.4 | UrbanStyle from BLS index values |
| Mar | 2.4 | 3.3 | UrbanStyle from BLS index values |
| Apr | 4.2 | 3.8 | UrbanStyle from BLS index values |
| May | 5.2 | 4.2 | UrbanStyle from BLS index values |
| Jun | 4.1 | 3.5 | UrbanStyle from BLS index values |
| Jul | 3.4 | 3.4 | UrbanStyle from BLS index values |
| Aug | 3.6 | 3.4 | UrbanStyle from BLS index values |
Men’s, women’s and children’s footwear
FDRA’s analysis of BLS data, reported by SGB Online, splits the index by group. D
| Group | May 2026 (year over year) | June 2026 (year over year) |
|---|---|---|
| Men’s footwear | +5.4% (highest in 54 months) | +3.4% |
| Women’s footwear | +6.2% (highest in 45 months) | +4.3% |
| Children’s footwear | +3.0% | +4.7% (fastest in nearly four years) |
| All footwear (UrbanStyle calculation) | +5.2% | +4.1% |
What to watch when reading these numbers
- Compare the same month a year apart. The index is not seasonally adjusted and moves with the shoe-buying calendar, for example 146.675 in August 2025 against 149.463 in September 2025.
- Percent change is not the price level. A 3.6% rise means prices are 3.6% higher than a year earlier, not that shoes cost 3.6% more than last month.
- The October 2025 index has no value in the series we read, so any chart that spans it has a gap.
- FDRA’s outlook: after year-to-date footwear prices of 3.0% (reported June 10) and 3.2% for the first half (reported July 14), FDRA’s chief economist said full-year 2026 was on course for the third-fastest rise in 34 years. That is a forecast, not a result.
Where US shoes come from: imports and domestic production
Almost all footwear sold in the US is made elsewhere. FDRA’s industry summary says the US imported an average of 6 pairs per person in 2025 and made about 25 million pairs at home. With a population of 341.9 million, 6 pairs per person is roughly 2.05 billion pairs, so domestic production is about 1.2% of the total (UrbanStyle arithmetic on rounded figures, tier E). The industry supports about 237,000 jobs, according to FDRA. C
Embed this chart
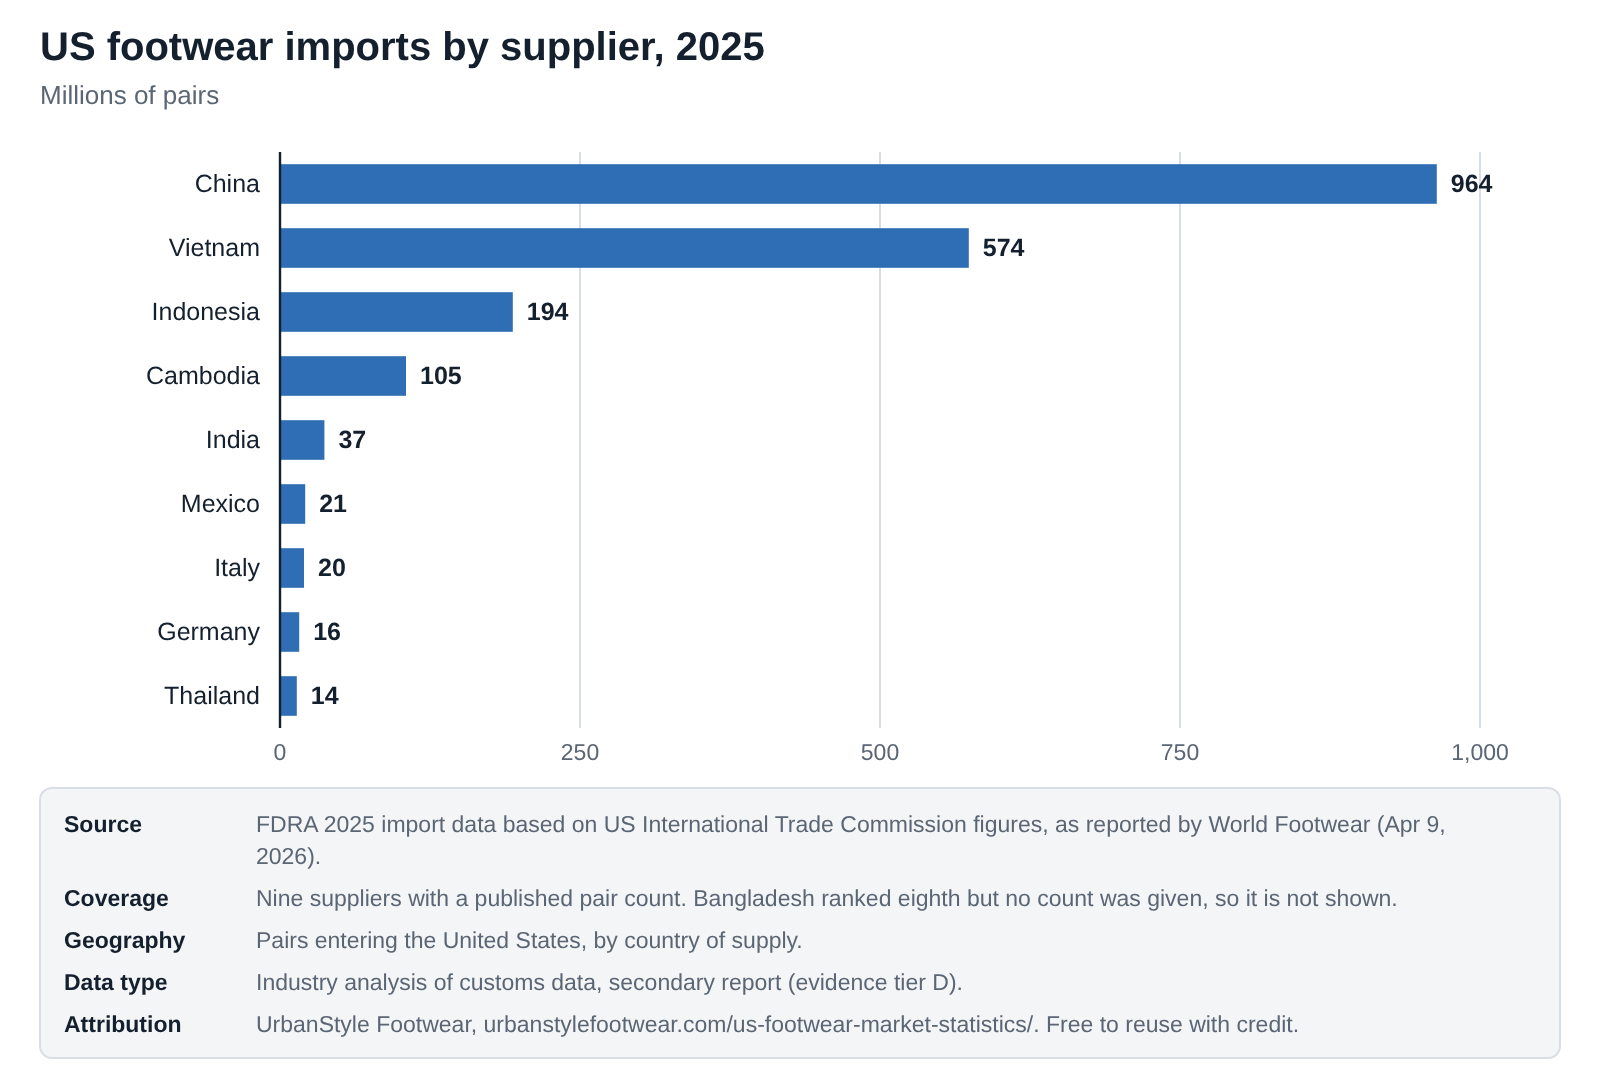
<figure style="margin:0"><a href="https://urbanstylefootwear.com/us-footwear-market-statistics/"><img src="https://urbanstylefootwear.com/wp-content/uploads/2026/10/usf-us-footwear-imports-by-supplier-2025.png" alt="Horizontal bar chart of 2025 US footwear imports in millions of pairs: China 964, Vietnam 574, Indonesia 194, Cambodia 105, India 37, Mexico 21, Italy 20, Germany 16, Thailand 14" width="800" style="max-width:100%;height:auto"></a><figcaption>Source: UrbanStyle Footwear, based on FDRA 2025 import data (USITC) via World Footwear. <a href="https://urbanstylefootwear.com/us-footwear-market-statistics/">US Footwear Market Statistics 2026</a></figcaption></figure>Click the code, press Ctrl+C (Cmd+C on Mac), and paste it into any web page. Please keep the attribution link.
View as table
| Supplier | Pairs imported in 2025 (millions) | Source |
|---|---|---|
| China | 964 | FDRA citing USITC, via World Footwear |
| Vietnam | 574 | FDRA citing USITC, via World Footwear |
| Indonesia | 194 | FDRA citing USITC, via World Footwear |
| Cambodia | 105 | FDRA citing USITC, via World Footwear |
| India | 37 | FDRA citing USITC, via World Footwear |
| Mexico | 21 | FDRA citing USITC, via World Footwear |
| Italy | 20 | FDRA citing USITC, via World Footwear |
| Germany | 16 | FDRA citing USITC, via World Footwear |
| Thailand | 14 | FDRA citing USITC, via World Footwear |
FDRA’s 2025 supplier data, based on US International Trade Commission figures and reported by World Footwear on April 9, 2026, shows China at 964 million pairs and Vietnam at 574 million, together about 1.54 billion pairs. Indonesia (194 million) and Cambodia (105 million) follow. D
- China’s share of imports fell to a 35-year low in both value and volume, and its average landed cost relative to global averages hit a 34-year low.
- Vietnam’s average landed cost reached a 24-year high of $21.17 per pair.
- Cambodia rose 50% to 105 million pairs, India reached a record import share at 37 million pairs, and Bangladesh grew 76% to near-record levels.
- Brazil dropped out of the top ten suppliers because of high tariffs for much of 2025, according to the same report.
Counting pairs is harder than it looks. A separate industry yearbook (APICCAPS, World Footwear Yearbook 2026) puts US consumption at about 1,950 million pairs, close to but not the same as the roughly 2.05 billion implied by FDRA’s per-person figure. Imports, production and consumption are different measures with different timing, so small gaps are normal.
The report we read did not give a total import count or dollar value, and Bangladesh (ranked eighth) was listed without a pair number, so the chart shows only the nine suppliers with a published count.
Where shoes are sold: shoe stores, online and everywhere else
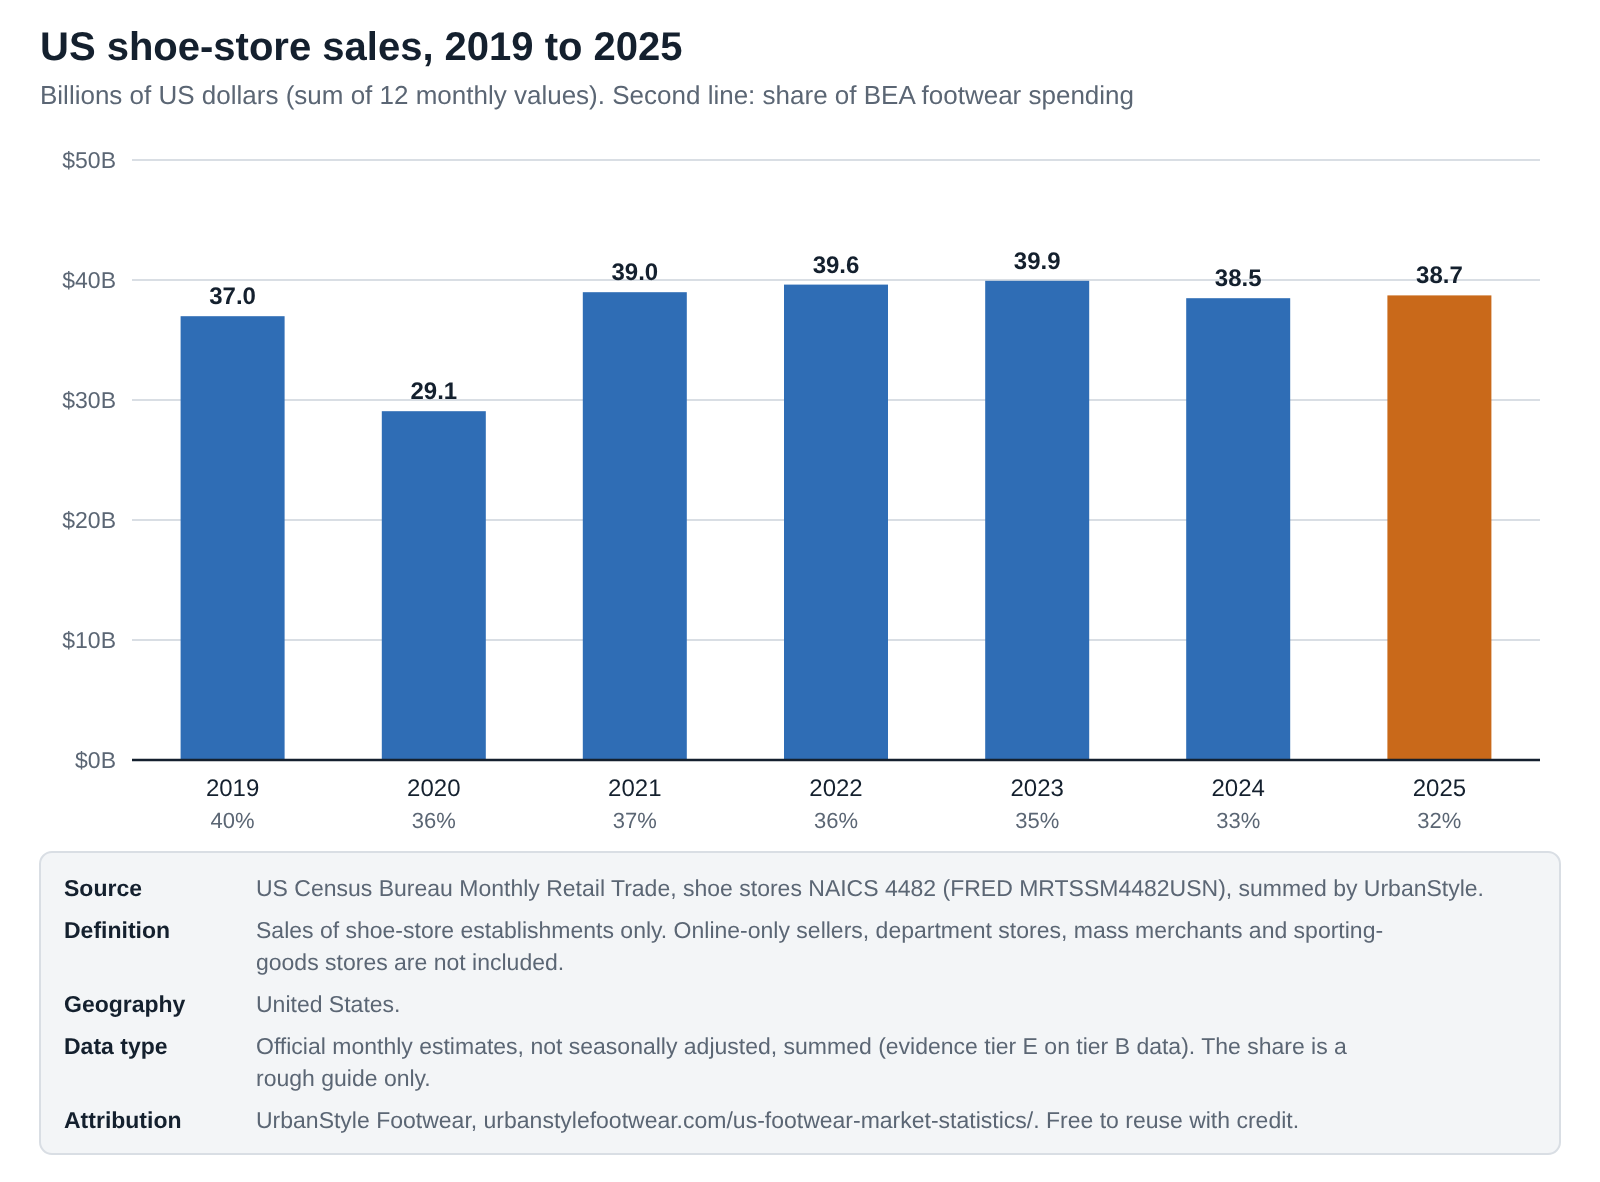
Shoe stores sold $38.72 billion in 2025, by our sum of Census monthly values, which is about 32% of the BEA household total, down from about 40% in 2019. The rest is sold through channels that Census classifies elsewhere: department stores, mass merchants, sporting-goods retailers, brand websites and online marketplaces. E
Embed this chart
<figure style="margin:0"><a href="https://urbanstylefootwear.com/us-footwear-market-statistics/"><img src="https://urbanstylefootwear.com/wp-content/uploads/2026/10/usf-us-shoe-store-sales-2019-2025.png" alt="Bar chart of US shoe-store sales: $37.0 billion in 2019, $29.1 billion in 2020, and $38.7 billion in 2025, which was 32 percent of BEA household footwear spending" width="800" style="max-width:100%;height:auto"></a><figcaption>Source: UrbanStyle Footwear, based on Census Monthly Retail Trade, shoe stores. <a href="https://urbanstylefootwear.com/us-footwear-market-statistics/">US Footwear Market Statistics 2026</a></figcaption></figure>Click the code, press Ctrl+C (Cmd+C on Mac), and paste it into any web page. Please keep the attribution link.
View as table
| Year | Shoe-store sales (billion US dollars) | Share of BEA footwear spending (%) | Source |
|---|---|---|---|
| 2019 | 36.98 | 40.2 | UrbanStyle sum of Census monthly data |
| 2020 | 29.06 | 35.7 | UrbanStyle sum of Census monthly data |
| 2021 | 38.98 | 36.9 | UrbanStyle sum of Census monthly data |
| 2022 | 39.61 | 35.9 | UrbanStyle sum of Census monthly data |
| 2023 | 39.93 | 35.0 | UrbanStyle sum of Census monthly data |
| 2024 | 38.49 | 33.2 | UrbanStyle sum of Census monthly data |
| 2025 | 38.72 | 32.0 | UrbanStyle sum of Census monthly data |
- For the first seven months of 2026, shoe-store sales were $21.30 billion, up about 2.9% on the same months of 2025. This is in current dollars and not adjusted for prices, which were 1.5% to 5.2% higher than a year earlier in those months.
- E-commerce is growing across all retail. Census reports e-commerce at 17.1% of total retail sales in the second quarter of 2026, up from 11.2% in the fourth quarter of 2019. This covers all retail, not footwear.
- Online shoe retailers: IBISWorld estimates industry revenue of $47.9 billion in 2025, up 3.6%, under its own definition of internet shoe retailers.
- Amazon: a receipt-panel analysis in the AlixPartners July 2026 data pack (Numerator, twelve months ending June 7, 2026) shows projected Amazon footwear sales up 10.8% against 6.8% for footwear overall, with more households buying. This is a panel projection, not a sales count.
- Back-to-school shoppers use many channels: specialty retailers (49%), mass merchants (45%), discount and off-price (41%), department stores (40%), brand stores or sites (36%) and online-only sellers (30%). Online (35%) and in-store (34%) were nearly equal as a main way to shop.
Running and athletic footwear in 2026
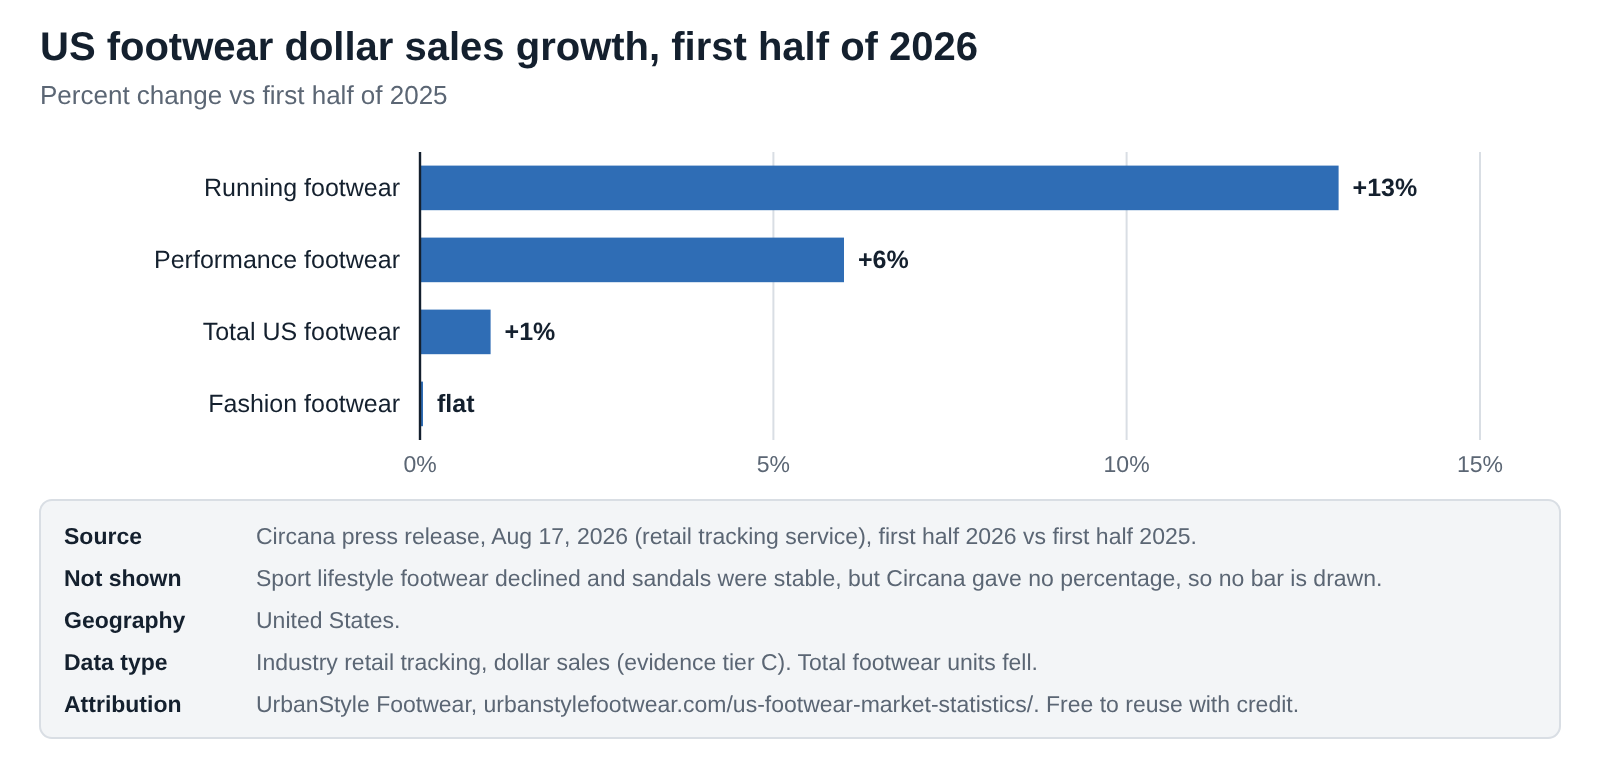
Circana’s August 17, 2026 release reports US footwear dollar sales up 1% in the first half of 2026, with units down and higher average prices offsetting weaker demand. Performance footwear rose 6% and running 13% in both dollars and units. Fashion footwear was flat, and sport lifestyle declined. C
Embed this chart
<figure style="margin:0"><a href="https://urbanstylefootwear.com/us-footwear-market-statistics/"><img src="https://urbanstylefootwear.com/wp-content/uploads/2026/10/usf-us-footwear-sales-growth-h1-2026.png" alt="Horizontal bar chart of Circana first-half 2026 dollar growth: running footwear plus 13 percent, performance plus 6, total footwear plus 1, fashion footwear flat" width="800" style="max-width:100%;height:auto"></a><figcaption>Source: UrbanStyle Footwear, based on Circana, August 2026. <a href="https://urbanstylefootwear.com/us-footwear-market-statistics/">US Footwear Market Statistics 2026</a></figcaption></figure>Click the code, press Ctrl+C (Cmd+C on Mac), and paste it into any web page. Please keep the attribution link.
View as table
| Segment | Dollar sales change, first half 2026 (%) | Source |
|---|---|---|
| Running footwear | 13 | Circana |
| Performance footwear | 6 | Circana |
| Total US footwear | 1 | Circana |
| Fashion footwear | 0 (flat) | Circana |
- In fashion, ballerinas grew at a double-digit dollar rate, with mules, clogs and pumps also up. Slides and flip-flops offset weakness in multi-strap sandals. Hiking, lite hiking, and fishing and water boots gained.
- Circana’s first-quarter 2026 figures were similar: total +1%, performance +5%, fashion +2%, with sport lifestyle down.
- Circana’s full-year view is relatively flat, because pricing gains are offsetting lower unit demand. Nearly half of consumers say they are delaying purchases or choosing lower-priced alternatives because of price increases.
What the brands reported
Company results show where growth is coming from. They are global or regional figures reported by trade press, not US market share. D
| Brand or group | Result | Period |
|---|---|---|
| Hoka (Deckers) | Sales +7.7% to $703.5 million | Quarter ended June 30, 2026 |
| On | Sales +21.6% in constant currency to CHF 850.3 million; Americas +13.0% | Q2 2026 |
| Asics North America | Sales +33.8%; US +19.4% | Q2 2026 |
| Saucony (Wolverine) | Revenue +9.9% to $158.6 million | Q2 2026 |
| Nike running | Fifth straight quarter of double-digit growth | Quarter ended May 31, 2026 |
| Adidas running | Sales +28% | Q2 2026 |
Consumers under pressure: back-to-school 2026
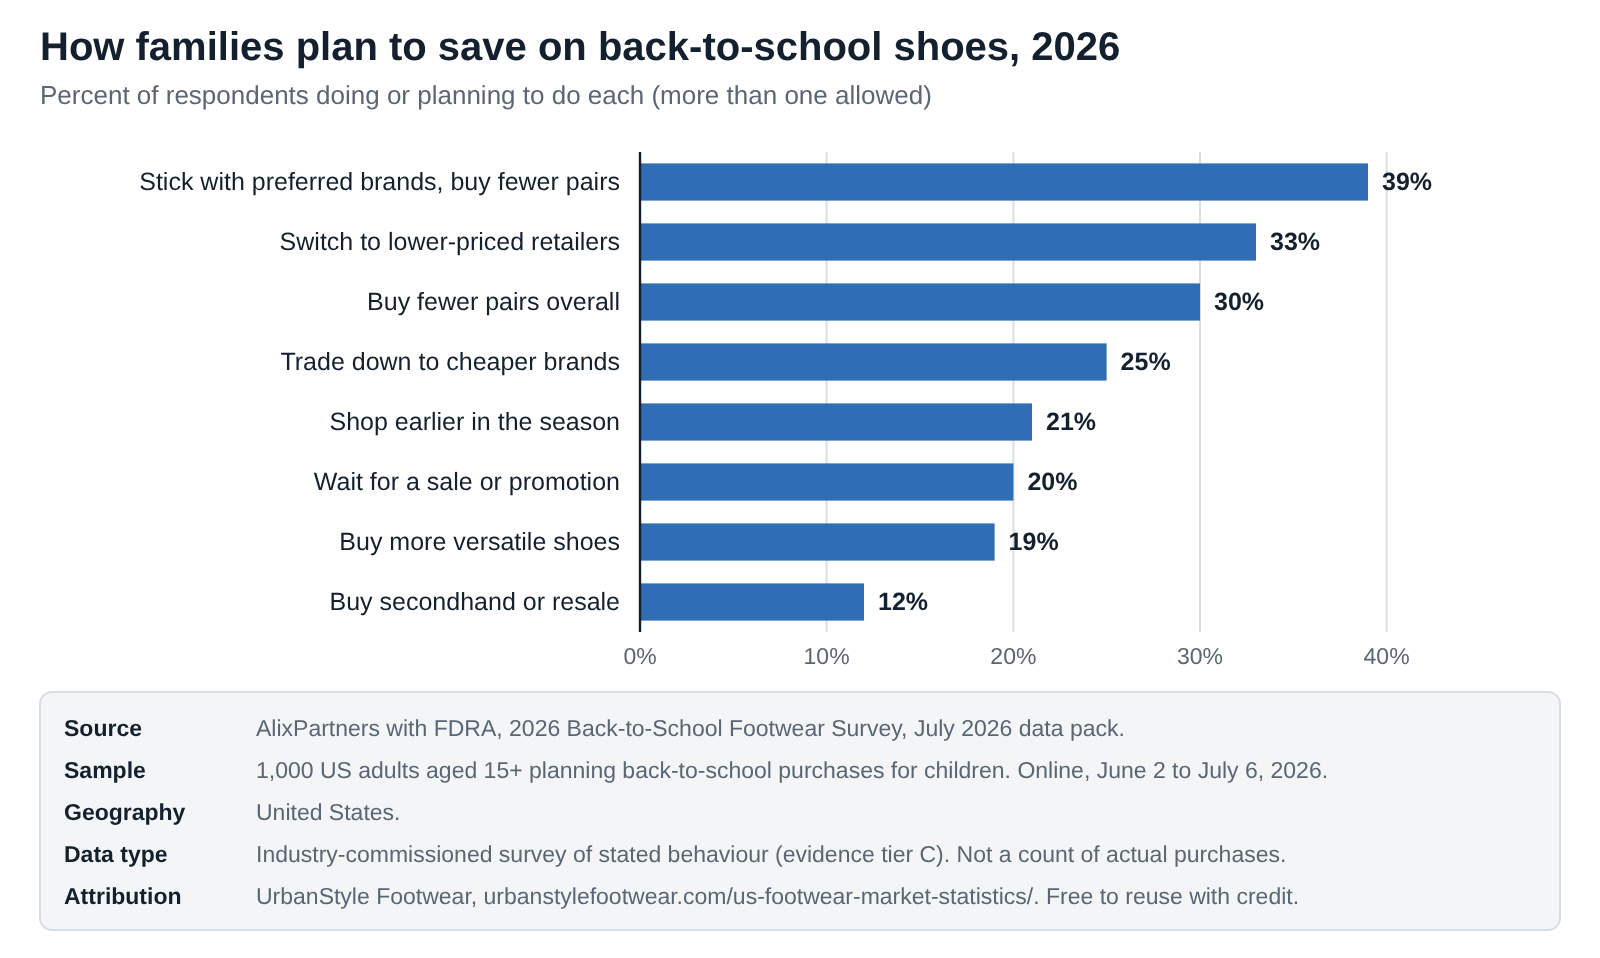
The AlixPartners and FDRA 2026 Back-to-School Footwear Survey (1,000 US adults aged 15 and over, online, June 2 to July 6, 2026) shows families adjusting to higher prices. C
- 44% planned to spend under $100 per child, up from 40% in 2025.
- 78% said children’s and teen shoe prices felt higher than last year (39% noticeably, 39% slightly).
- Median planned spend per child fell about 10% for households earning under $25,000 (from $99.51 to $89.54) and rose about 4% for households earning $150,000 or more (from $143.09 to $148.75).
- Comfort or fit (41%) and durability (39%) were the top reasons to spend more, ahead of brand (29%).
- 64% planned to shop Prime Day or competing events, 34% as replacement purchases and 30% as additional ones.
Embed this chart
<figure style="margin:0"><a href="https://urbanstylefootwear.com/us-footwear-market-statistics/"><img src="https://urbanstylefootwear.com/wp-content/uploads/2026/10/usf-back-to-school-shoe-saving-tactics-2026.png" alt="Horizontal bar chart of survey answers: 39 percent buy fewer pairs of preferred brands, 33 percent switch to lower-priced retailers, 30 percent buy fewer pairs, 25 percent trade down, down to 12 percent buying secondhand" width="800" style="max-width:100%;height:auto"></a><figcaption>Source: UrbanStyle Footwear, based on AlixPartners and FDRA, July 2026. <a href="https://urbanstylefootwear.com/us-footwear-market-statistics/">US Footwear Market Statistics 2026</a></figcaption></figure>Click the code, press Ctrl+C (Cmd+C on Mac), and paste it into any web page. Please keep the attribution link.
View as table
| Behaviour | Share of respondents (%) | Source |
|---|---|---|
| Stick with preferred brands, buy fewer pairs | 39 | AlixPartners and FDRA, July 2026 |
| Switch to lower-priced retailers | 33 | AlixPartners and FDRA, July 2026 |
| Buy fewer pairs overall | 30 | AlixPartners and FDRA, July 2026 |
| Trade down to cheaper brands | 25 | AlixPartners and FDRA, July 2026 |
| Shop earlier in the season | 21 | AlixPartners and FDRA, July 2026 |
| Wait for a sale or promotion | 20 | AlixPartners and FDRA, July 2026 |
| Buy more versatile shoes | 19 | AlixPartners and FDRA, July 2026 |
| Buy secondhand or resale | 12 | AlixPartners and FDRA, July 2026 |
Tariffs and trade policy affecting footwear in 2026
Because almost every pair is imported, trade policy matters to the footwear market. The rules changed repeatedly in 2026. The table below lists the main steps, each with its source. These actions applied across imports, not to footwear alone, and footwear also carries ordinary customs duties that are not covered here. D
| Date | What happened |
|---|---|
| Feb 20, 2026 | The Supreme Court ruled 6-3 that IEEPA does not give the President authority to impose tariffs, in a case heard with Learning Resources v. Trump. |
| Feb 24, 2026 | A 10% Section 122 surcharge took effect, and collection of IEEPA duties stopped. Section 122 allows up to 15% for no more than 150 days. |
| Mar 2026 | The US Trade Representative opened Section 301 investigations, including one on forced-labor enforcement covering 60 economies. On March 4 the Court of International Trade ordered refunds of IEEPA duties on unliquidated entries. |
| May 7 to Jun 16, 2026 | The Court of International Trade ruled the Section 122 surcharges unlawful for the named plaintiffs; the Federal Circuit stayed that ruling on June 16, so the surcharge stayed in place. |
| Jul 24, 2026 | The Section 122 surcharge expired and Section 301 forced-labor tariffs took effect: 10% for India, Indonesia, Cambodia and Bangladesh, and a flat 12.5% for China and Vietnam (one table in the source lists 13%). |
What the data cannot tell you. Footwear prices rose faster than overall prices from April to June 2026 and then converged. FDRA links price pressure to the supply chain, but no index separates tariffs from freight, labour and other costs, so we do not publish a “tariff cost per pair”. Treat any such figure with caution unless it names its method.
2026 outlook: what the forecasts say
We do not forecast. These are the published views, each with its source.
- Circana: full-year 2026 footwear sales relatively flat, with price gains offsetting lower unit demand. C
- FDRA: 2026 on course for the third-fastest annual rise in footwear prices in 34 years. In FDRA’s Q2 2026 survey, about one in three executives expected retail prices to rise as much as 5% this year, and over half expected landed costs to rise as much as 10%. D
- AlixPartners: consumer sentiment was very negative in April and improved by July, and consumers expected relatively stable spending over the next six months. C
The next data points to watch are the monthly BLS price index, the next Census retail estimates, and Circana’s later-year readings. We refresh this page when new figures are published and record each change in the freshness log.
What existing footwear market articles get wrong
Most footwear market content shares the same weaknesses. This page is built to avoid each one.
- Problem 1They quote a market size without saying what it counts.
- Problem 2They mix dollar growth with volume growth.
- Problem 3They present forecasts as results.
- Problem 4They quote a percentage without saying year over year, year to date or month to month.
- Problem 5They use superseded numbers, for example the older $116.174 billion for 2024.
- Problem 6They treat global company growth as US market growth.
- Problem 7They treat all-import tariffs as footwear-specific.
- Problem 8They multiply per-household averages to get a market total.
- Problem 9They cite surveys of intentions as sales data.
What these findings mean for shoppers
The data explains why shoe shopping feels more expensive in 2026. These steps are practical advice, separate from the research above.
- Compare before you pay full price. Prices are higher than a year ago and nearly half of consumers in Circana’s data are delaying purchases or trading down, so it pays to compare models. If you need a pair, start with our best running shoes under $100 and podiatrist-recommended shoes under $100.
- Time your purchase. Footwear prices follow a seasonal pattern, and retail promotions such as Prime Day shift when people buy. Our Prime Day shoe deals guide tracks current offers.
- Buy the right size the first time. Returns and wrong sizes waste money. Use our measuring guide, the brand’s own chart, and our shoe size statistics to understand why sizes vary.
- Make shoes last. If prices are rising, longer life is the cheapest saving. Read how long walking shoes last and our shoe care guide.
- Check where a review comes from. See how we test shoes for our approach.
Sources and evidence tiers
Evidence hierarchy
- APrimary peer-reviewed research. Original data in a peer-reviewed journal. None of the market statistics on this page are in this tier, which is normal for market data.
- BOfficial statistics. Government data such as BEA, BLS and Census, read through the FRED database where noted. Strongest evidence for market size, spending and prices.
- CIndustry research and surveys. Trade association summaries, retail tracking and commissioned surveys. Useful, but the publisher may have a commercial interest.
- DSecondary reporting. A publication summarising someone else’s data, including trade press and law-firm analyses.
- EEstimates and calculations. Our own arithmetic on published data is labelled E, with the method stated.
Primary versus secondary data
Primary source: the organisation that collected or published the original data. Secondary source: a publication summarising someone else’s data. We read BEA, BLS and Census series on the FRED database, which republishes the official numbers with series IDs and update dates. Where we could only read a secondary summary, the table says so.
Source table
| Source | Year | Sample | Geography | Finding used | Tier | Series ID | Primary source |
|---|---|---|---|---|---|---|---|
| US Bureau of Economic Analysis, Personal consumption expenditures: Footwear (NIPA Table 2.5.5), read through FRED | 2025 | National accounts estimate, annual, current dollars | United States | Household spending on footwear: $121.150 billion in 2025, $116.061 billion in 2024 | B | FRED series DFTWRC1A027NBEA (updated Sept 30, 2026) | FRED series page |
| US Bureau of Economic Analysis, Real personal consumption expenditures: Footwear (chained 2017 dollars), read through FRED | 2025 | National accounts estimate, annual, inflation-adjusted | United States | Price-adjusted footwear spending of $113.333 billion (chained 2017 dollars) in 2025, up from $108.699 billion in 2024 | B | FRED series DFTWRX1A020NBEA (updated Sept 30, 2026) | FRED series page |
| US Bureau of Economic Analysis, Personal consumption expenditures: Footwear, chain-type price index (2017=100), read through FRED | 2025 | National accounts price index, annual | United States | Footwear price index of 106.898 in 2025 against 106.773 in 2024 | B | FRED series DFTWRG3A086NBEA (updated Sept 30, 2026) | FRED series page |
| US Bureau of Economic Analysis, Population, read through FRED | 2025 | National accounts population, January 1 of each year | United States | Population of 341.944 million (2025) used for per-person figures | B | FRED series B230RC0A052NBEA (updated Feb 20, 2026) | FRED series page |
| US Bureau of Labor Statistics, Consumer Expenditure Survey: Footwear, all consumer units, read through FRED | 2024 | Household survey, average annual spending per consumer unit | United States | Average footwear spending of $461 per consumer unit in 2024 | B | FRED series CXUFOOTWEARLB0101M (updated Dec 19, 2025) | FRED series page |
| US Bureau of Labor Statistics, Consumer Expenditures 2024 news release | 2024 | Household survey, all spending categories | United States | Total average annual expenditures of $78,535 per consumer unit in 2024; apparel and services $2,001 | B | Released Dec 19, 2025 | BLS news release |
| US Bureau of Labor Statistics, CPI for All Urban Consumers: Footwear, US city average, read through FRED | 2026 | Price index (1982-84=100), not seasonally adjusted, monthly | United States | Footwear index of 151.979 in August 2026 against 146.675 in August 2025 | B | FRED series CUUR0000SEAE (updated Sept 11, 2026) | FRED series page |
| US Bureau of Labor Statistics, CPI for All Urban Consumers: All items, read through FRED | 2026 | Price index (1982-84=100), not seasonally adjusted, monthly | United States | All-items index of 334.980 in August 2026 against 323.976 in August 2025 | B | FRED series CPIAUCNS (updated Sept 11, 2026) | FRED series page |
| US Census Bureau, Monthly Retail Trade: Shoe stores (NAICS 4482), read through FRED | 2026 | Monthly retail sales of shoe-store establishments, not seasonally adjusted | United States | Shoe-store sales summed to $38.72 billion for 2025 (UrbanStyle sum of 12 months) | B | FRED series MRTSSM4482USN (updated Sept 16, 2026) | FRED series page |
| US Census Bureau, Quarterly E-Commerce Retail Sales as a percent of total sales, read through FRED | 2026 | All retail, seasonally adjusted, quarterly | United States | E-commerce was 17.1% of total retail sales in the second quarter of 2026 (not footwear specific) | B | FRED series ECOMPCTSA (updated Aug 18, 2026) | FRED series page |
| Footwear Distributors and Retailers of America (FDRA), footwear industry facts on fdra.org (read Sept 21, 2026) | 2025 | Trade association summary figures | United States | $121 billion personal spending (2025), about 237,000 footwear jobs, 6 imported pairs per person, about 25 million pairs made in the US | C | n/a | fdra.org |
| FDRA monthly footwear inflation analysis of BLS data, as reported by SGB Online (June 10 and July 14, 2026) | 2026 | Men's, women's and children's footwear CPI, year over year | United States | May 2026: women's +6.2%, men's +5.4%; June 2026: men's +3.4%, women's +4.3%, children's +4.7% | D | n/a | SGB Online (May data) |
| FDRA June 2026 footwear inflation, as reported by SGB Online (July 14, 2026) | 2026 | Men's, women's and children's footwear CPI, year over year | United States | June 2026: men's +3.4%, women's +4.3%, children's +4.7%, the fastest children's rate in nearly four years | D | n/a | SGB Online (June data) |
| FDRA 2025 US footwear imports by supplier (citing US International Trade Commission data), as reported by World Footwear (April 9, 2026) | 2025 | Imported pairs by supplying country | United States | China 964 million pairs, Vietnam 574 million, Indonesia 194 million, Cambodia 105 million in 2025 | D | n/a | World Footwear article |
| Circana, "Performance shoe sales pick up the pace amid selective US consumer spending in the footwear market" (Aug 17, 2026) | 2026 | Retail tracking, first half 2026 against first half 2025, dollar sales | United States | Total footwear +1%, performance +6%, running +13% in dollars; units fell overall | C | n/a | Circana release |
| SGB Online, "Circana: running footwear delivers double-digit gains in first half" (Aug 17, 2026) | 2026 | Trade-press roundup of company quarterly results | United States and global | Hoka +7.7% to $703.5 million; On +21.6% (constant currency); Asics North America +33.8%; Saucony +9.9% | D | n/a | SGB Online article |
| AlixPartners with FDRA, 2026 US Back-to-School Footwear Survey, July 2026 data pack | 2026 | Online survey of 1,000 US adults aged 15+ planning back-to-school footwear purchases for children, June 2 to July 6, 2026 | United States | 44% plan to spend under $100 per child; 78% say children's and teen shoe prices feel higher | C | n/a | Data pack (PDF) |
| IBISWorld, Online Shoe Sales in the US (industry page) | 2025 | Industry revenue estimate for internet shoe retailers | United States | Industry revenue of $47.9 billion in 2025, up 3.6% | D | n/a | IBISWorld page |
| APICCAPS, World Footwear Yearbook 2026 (sample report) | 2025 | Country consumption ranking | World | US consumption of about 1,950 million pairs, third after China and India | C | n/a | Sample report (PDF) |
| Steptoe, "US Supreme Court strikes down IEEPA tariffs" (law-firm analysis of the Feb 20, 2026 ruling) | 2026 | Legal summary of a 6-3 Supreme Court ruling | United States | IEEPA does not give the President authority to impose tariffs; ruling issued Feb 20, 2026 | D | n/a | Steptoe post |
| Kroll, "A tale of tariff substitution" (timeline of IEEPA, Section 122 and Section 301 actions) | 2026 | Law and trade analysis timeline | United States | Section 122 10% surcharge from Feb 24 to Jul 24, 2026, replaced by Section 301 forced-labor tariffs | D | n/a | Kroll article |
| Holland & Knight, "And the (tariff) beat goes on" (July 30, 2026 analysis of the Section 301 forced-labor action) | 2026 | Law-firm summary of a USTR final action | United States | Section 301 rates effective July 24, 2026: 10% for India, Indonesia, Cambodia, Bangladesh; 12.5% stated for China and Vietnam (one table shows 13%) | D | n/a | Holland & Knight article |
| UrbanStyle Footwear calculations from the tier B series above | 2026 | Derived figures: per-person spending, growth rates, shares, year-over-year price changes | United States | Arithmetic on published series; method stated beside each figure | E | n/a | Methodology |
Methodology and limitations
How we built this page. Every statistic was traced to its original source and read there wherever possible. We recorded the source, publication date, data year, sample or population and what kind of evidence it is. Where we calculate a number (per-person spending, growth rates, shares, year-over-year price changes), it is labelled E and the method is in the dataset.
What we left out. We did not use market-size figures from paid research whose public pages mask the numbers, brand market-share claims we could not trace, or estimates of tariff cost per pair that do not name a method.
Limitations you should know about
- BEA values are revised. We read the series on October 8, 2026. Earlier years may change in future releases.
- BLS household data lag. The latest Consumer Expenditure Survey year in the series we read is 2024.
- Price indexes are not seasonally adjusted. We compare each month with the same month a year earlier. The index has no October 2025 value.
- Shoe-store sales are summed and may be revised. We added twelve monthly, not seasonally adjusted Census values. Census published revised estimates on September 28, 2026, after the FRED update we read.
- Shoe stores are not the whole market. The 32% share compares series with different definitions and is a rough guide only.
- Import figures come from trade press. They report FDRA analysis of USITC data. We did not download the raw customs files, and no total import count was given.
- Circana publishes growth rates, not dollar totals. We cannot say how many pairs or dollars sit behind the percentages.
- The AlixPartners survey has 1,000 online respondents aged 15 and over, was commissioned with FDRA, and reports intentions.
- Company results are global or regional and come from trade-press summaries.
- Tariff entries come from law-firm and advisory analyses, not the court opinions or USTR notices. Rates for China and Vietnam appear as 12.5% in text and 13% in one table, so check the USTR notice.
- FDRA’s footwear statistics page gives rounded figures without a stated method (for example $121 billion, 6 pairs per person, 25 million pairs).
Data freshness
| Date | Change |
|---|---|
| October 8, 2026 | First publication. Data read from BEA, BLS, Census, FDRA, Circana, AlixPartners and trade-press reports. Downloadable dataset, charts and calculations with stated methods. |
| January 2027 | Next scheduled review. |
Last full source review: October 8, 2026. Next scheduled review: January 2027. We review this page quarterly and update the price figures when the Bureau of Labor Statistics publishes new data.
Corrections. If you find an error or have better data, email info@urbanstylefootwear.com with the subject “Data correction”. We will review it and note any change in the table above. How we test and review products is explained in our methodology.
For journalists and researchers
Looking for US footwear data for an article, report or research project? You can use the statistics and charts on this page with attribution to UrbanStyle Footwear. Whenever possible, please cite the original source listed with each statistic. Our own calculations are marked tier E and can be cited to us.
Media kit
All figures with value, unit, geography, segment, basis, period, source and evidence tier.
Seven charts with source, definition, geography and data type printed on each image. SVG versions are under each chart above.
The 15 citable statistics on one printable PDF.
Every source with year, sample, geography, tier, series ID and link.
Ready-made citations below. Media and research enquiries go to info@urbanstylefootwear.com.
Cite this page
Suggested citation
UrbanStyle Footwear. “US Footwear Market Statistics 2026: Spending, Prices, Imports and Trends.” Updated October 8, 2026. https://urbanstylefootwear.com/us-footwear-market-statistics/
APA style
Vahith, A. (2026, October 8). US footwear market statistics 2026: Spending, prices, imports and trends. UrbanStyle Footwear. https://urbanstylefootwear.com/us-footwear-market-statistics/
Link (HTML)
<a href="https://urbanstylefootwear.com/us-footwear-market-statistics/">US Footwear Market Statistics 2026 by UrbanStyle Footwear</a>Click any citation, then press Ctrl+C (Cmd+C on Mac) to copy it.
For individual statistics, UrbanStyle recommends citing the original source listed in the source table whenever possible.
Data requests. Data correction or dataset request: info@urbanstylefootwear.com
Frequently asked questions
How big is the US footwear market?
Households spent $121.15 billion on footwear in 2025, according to the Bureau of Economic Analysis. That is the broadest official measure. Narrower figures exist, such as $38.7 billion through shoe stores, but they count different things. See how big the market is.
How much do Americans spend on shoes each year?
About $354 per person in 2025 (BEA spending divided by BEA population, an UrbanStyle calculation). The Bureau of Labor Statistics reports $461 per household in 2024.
How many pairs of shoes are sold in the US each year?
There is no official sales count we could verify. FDRA says the US imported an average of 6 pairs per person in 2025 and made about 25 million pairs. That implies roughly 2 billion pairs. An industry yearbook puts consumption near 1.95 billion pairs.
What share of shoes sold in the US are imported?
Almost all. Using FDRA’s rounded figures, domestic production is about 1.2% of pairs, so about 98.8% are imported. That is our rough arithmetic, not a published statistic.
Which countries supply the most shoes to the US?
China (964 million pairs) and Vietnam (574 million) in 2025, followed by Indonesia (194 million) and Cambodia (105 million), according to FDRA data reported by World Footwear.
How much have shoe prices risen in 2026?
Footwear prices were 3.6% higher in August 2026 than a year earlier. Inflation peaked at 5.2% in May. These are calculated from BLS index values.
Are shoe prices rising faster than inflation?
In August 2026, only slightly (3.6% against 3.4% for all items). In spring the gap was wider: 5.2% against 4.2% in May. Over six years the opposite holds, with footwear up 7.0% and all items up 26.1% from December 2019 to December 2025.
How much do tariffs add to the price of shoes?
No public index isolates the effect, so we do not give a figure. We list the 2026 tariff actions with sources in the tariffs section.
Is the US footwear market growing in 2026?
Barely, in dollars. Circana reports US footwear dollar sales up 1% in the first half of 2026 with fewer units sold, and expects a relatively flat year.
Which footwear category is growing fastest?
Running footwear, up 13% in both dollars and units in the first half of 2026, according to Circana. Performance footwear was up 6%.
How much footwear is bought online?
No official footwear-specific figure exists. E-commerce was 17.1% of all US retail sales in the second quarter of 2026 (Census). In a July 2026 survey, 35% of back-to-school shoppers said they shop mostly online and 34% mostly in store.
How many people work in the US footwear industry?
About 237,000, according to FDRA.
How much do families spend on back-to-school shoes?
In the AlixPartners and FDRA July 2026 survey, 44% planned to spend under $100 per child, up from 40% in 2025. See consumers under pressure.
Why do different websites give different market sizes?
They count different things: household spending, shoe-store sales, online retailer revenue or modelled market values. Our reconciliation table shows what each counts and leaves out.
Can I use this data in my article?
Yes, with attribution to UrbanStyle Footwear and, where possible, the original source. Download the dataset and charts from the media kit and see the citation formats.