
Global Footwear Market Size 2026: How Big Is the Shoe Industry Really?
Research firms say the world footwear market is worth anything from $401 billion to $704 billion. I checked their figures against official data, found where they break down, and built my own estimate from the ground up: official spending where it exists, and the pairs people buy everywhere else, priced with stated assumptions, then forecast it to 2033 the same way. Every input is on this page and in the free dataset, so you can check the number or change it.
Six headline numbers on the size of the footwear market. Select one to see what it counts and where it comes from.
Select a topic above, for example “Published”, to see what the number counts.
$570BMy estimate of world footwear spending is about $570 billion a year (around 2025), with a range of $412 billion to $741 billion. 41% of it is official spending; the rest is modelled (UrbanStyle estimate, tier E).
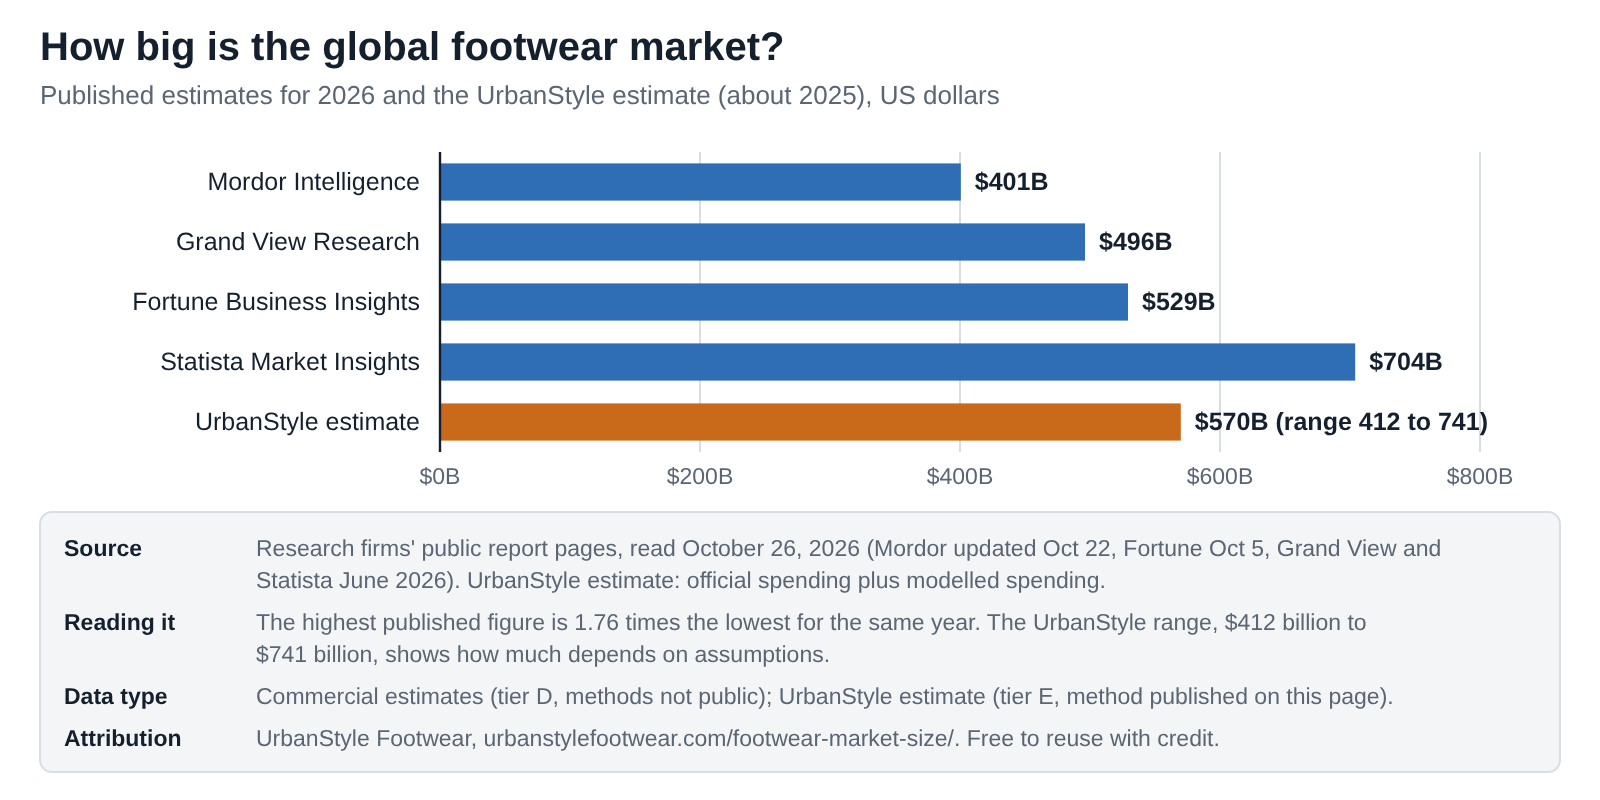
$401B to $704BFour research firms put the 2026 market between $401 billion and $704 billion. The highest is 1.76 times the lowest (their free pages, tier D).
$233BOfficial household spending on footwear in the 31 countries that publish it adds up to $233 billion. Those countries buy about 20% of the world's shoes (national accounts, my sum).
$757BMy forecast puts the market at about $757 billion by 2033 (3.6% a year), with a range of $627 billion to $827 billion, built from UN population projections and price trends (UrbanStyle forecast, tier E).
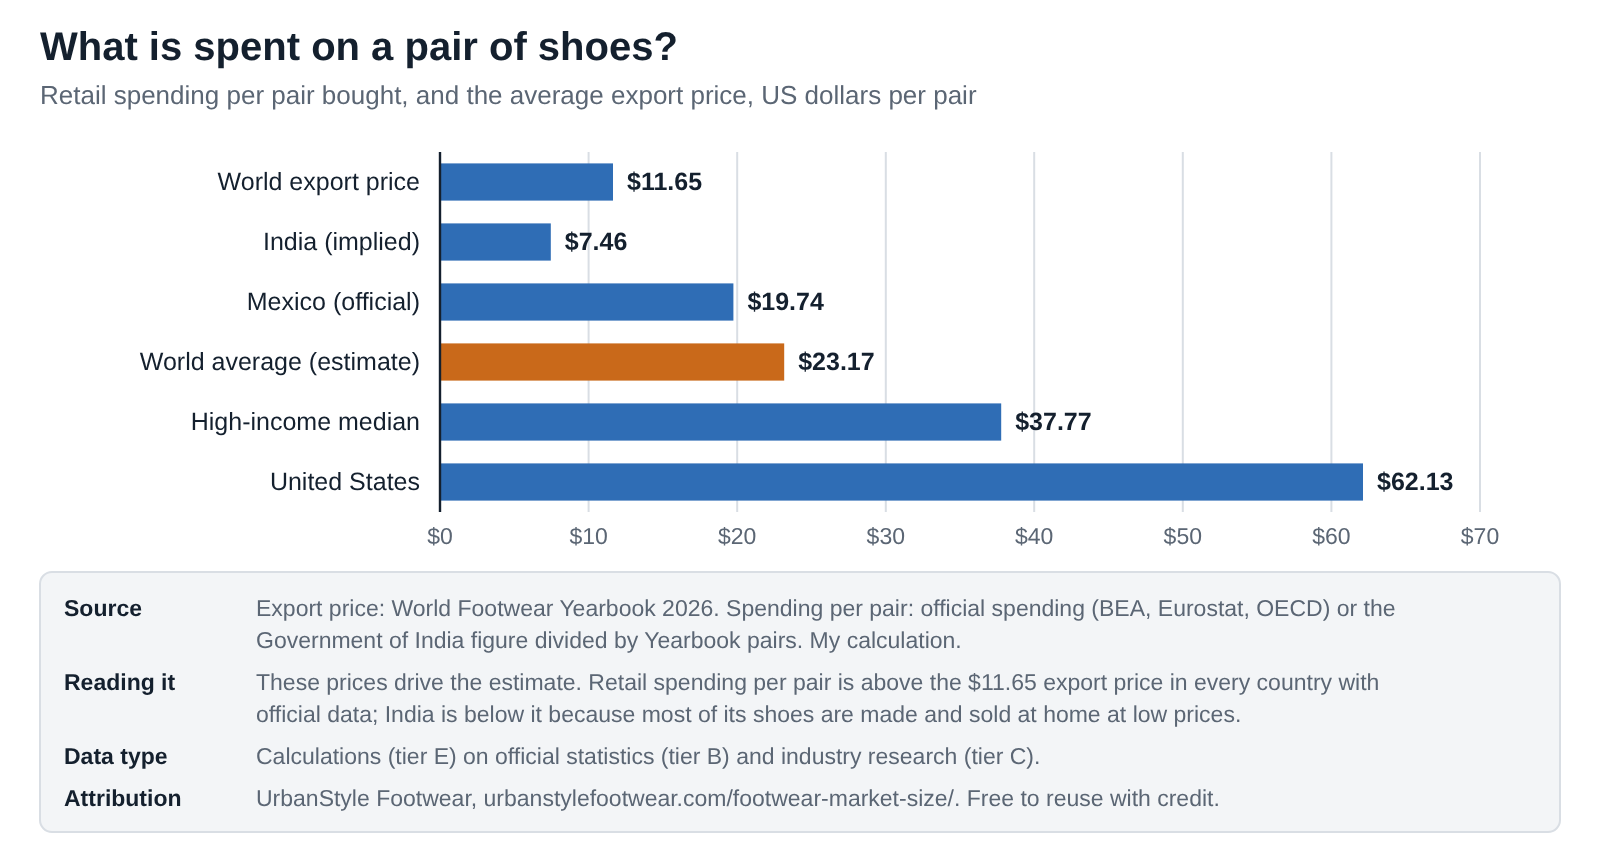
about $23Spread over 24.6 billion pairs, my estimate works out to about $23 a pair. Americans spend about $62 a pair; in India the implied figure is about $7.5.
US, then ChinaThe US is the largest market by value at $121 billion (official, 2025). My estimate puts China second at about $95 billion.
Each number names its source and evidence tier. All fifteen of my citable statistics are further down this page.
Global footwear market size at a glance
Quick answer. The global footwear market is worth about $570 billion a year by my estimate (around 2025), with a plausible range of $412 billion to $741 billion. Published estimates for 2026 run from $401 billion (Mordor Intelligence) to $704 billion (Statista), with Grand View Research at $496 billion and Fortune Business Insights at $529 billion. Only $233 billion of world spending is measured officially, in countries that buy about 20% of the world’s 24.6 billion pairs; everything else, in every estimate, is modelled. My forecast reaches about $757 billion by 2033 (3.6% a year).
Key findings
- About $570 billion a year. My estimate is official spending in 31 countries ($233 billion) plus the pairs bought everywhere else, priced by income group. The range is $412 billion to $741 billion.
- Published figures disagree by $303 billion. For 2026 the four research firms I checked range from $400.6 billion to $704 billion; the top one is 1.76 times the bottom one.
- Most of the world is unmeasured. Countries with official footwear spending buy only about 20% of the world’s pairs. China, India, Japan and Brazil publish no footwear spending figure.
- Some published country figures fail basic checks. One firm puts all of North America below official US spending alone; another lists France at $0.015 billion.
- The US and China are the two biggest markets: the US at $121.15 billion (official, 2025) and China at about $95 billion (my estimate). Japan and India follow at about $24 billion and $20.67 billion.
- About $23 per pair on average, from about $62 in the US to $7.46 implied for India.
- About $757 billion by 2033. My forecast grows 3.6% a year from population (UN projections) and footwear price trends, within $627 billion to $827 billion. Published forecasts assume 3.1% to 7.04% a year.
- Women’s shoes are the biggest end-user segment in the US, with 46% of footwear spending weights against 33% for men’s and 21% for children’s (BLS).
- Nike and adidas footwear together bring in about $46 billion, roughly 8% of the world estimate at their own revenue prices.
Footwear market report scope at a glance
Everything a paid market report summary lists, in one table, with the difference that every number here is free and sourced.
| Attribute | Details |
|---|---|
| Market definition | Household spending on footwear at retail prices, including taxes (COICOP 03.2) |
| Market size, about 2025 | $570 billion (range $412 billion to $741 billion); 41% measured |
| Forecast | $757 billion in 2033; 3.6% a year (2026 to 2033) |
| Volume | 24.6 billion pairs (2025); about 3 per person |
| Units | US dollars (nominal), pairs |
| Segments | Type of footwear (customs codes), end user (US), channel (US), income group |
| Geography | World, 5 regions, 79 countries |
| Companies | Nike, adidas, On, Deckers (HOKA), Yue Yuen |
| Sources | BEA, Eurostat, OECD, UN, World Bank, BLS, US Census Bureau, UN Comtrade, World Footwear Yearbook, company filings |
| Data and price | Free: CSV and XLSX (371 rows), 5 charts, method published |
| Updated | October 26, 2026; next review January 2027 |
What I noticed while putting this together
I expected the big research firms to roughly agree on the size of the footwear market. They don’t. Four of them, all updated in 2026, give 2026 figures from $401 billion to $704 billion. That’s not rounding; it’s a difference bigger than the whole US market.
So I checked their free pages against the official numbers I’d already collected for my market size by country page. Some figures hold up. Others don’t: one firm’s North America total is smaller than official US spending alone, and another lists France at $15 million, which looks like a units mistake. One firm’s own topic page says 2025 revenue was “almost 500 billion”, while its market model implies about $678 billion for the same year.
The deeper problem is coverage. Official footwear spending exists for about 31 countries, and they buy about one pair in five. Everything else has to be modelled, by the firms and by me. The difference is that I show you my model. If you think China’s shoes cost more or less than I assume, you can change one number in the spreadsheet and see what happens.
What footwear market data can and can’t tell you
Here is where the evidence stands as of October 2026.
| Question | Evidence status | Why |
|---|---|---|
| Spending in the US, EU, UK, Canada, Mexico | Official data | National accounts, same international category |
| Pairs made and bought worldwide | Industry estimate | World Footwear Yearbook, consistent across countries |
| Spending in China, Japan, Brazil | No official figure | Not published separately in national accounts |
| World market in dollars | Estimates only | Research firms (methods not public) and my estimate (method published) |
| Segment shares (athletic, women’s) | No official figure | Only research-firm estimates, which disagree |
| Forecasts | Published forecasts | Shown labelled, never mixed with measured data |
Four kinds of figure exist for market size. Pick one to see what it measures and where it falls short.
See what each kind of market figure measures and where it falls short
Choose one to see what it records and how I would read it.
Select a source above.
Official spending. 2024 and 2025. National statistics offices measure what households spend on footwear (COICOP 03.2). About 31 countries publish it in a form I can compare. How to read it: The most reliable money figure there is (tier B), but it covers countries that buy only about 20% of the world's pairs.
Research-firm estimates. 2025 to 2034. Firms such as Mordor, Grand View, Fortune and Statista sell modelled market sizes and forecasts. How to read it: One headline number each, but the methods are not public, the numbers differ by up to $303 billion for the same year, and some country figures clash with official data (tier D).
Pairs. 2025. The World Footwear Yearbook estimates pairs made and bought in each country. How to read it: Covers the whole world in one consistent unit, but it counts shoes, not money (tier C).
My estimate. About 2025. Official spending where it exists, plus pairs bought elsewhere priced by income group, with every input shown. How to read it: Transparent and checkable, but still an estimate (tier E). The range matters as much as the central number.
15 global footwear market statistics you can cite
Each card has one number, one sentence of context and its source. “Copy text” opens a box with the sentence, the source and a link back here. Cards marked E are my calculations or my estimate; please call the estimate an estimate.
The world spends about $570 billion a year on footwear (around 2025), with a plausible range of $412 billion to $741 billion (UrbanStyle Footwear estimate from official spending and World Footwear Yearbook pairs).
Copy text
$570B world footwear market, UrbanStyle estimate: The world spends about $570 billion a year on footwear (around 2025), with a plausible range of $412 billion to $741 billion (UrbanStyle Footwear estimate from official spending and World Footwear Yearbook pairs). Source: UrbanStyle estimate. Via UrbanStyle Footwear: https://urbanstylefootwear.com/footwear-market-size/
Four research firms value the 2026 footwear market at between $400.6 billion (Mordor Intelligence) and $704 billion (Statista), a gap of $303 billion (their public report pages, October 2026).
Copy text
$401B to $704B published estimates for 2026: Four research firms value the 2026 footwear market at between $400.6 billion (Mordor Intelligence) and $704 billion (Statista), a gap of $303 billion (their public report pages, October 2026). Source: UrbanStyle estimate. Via UrbanStyle Footwear: https://urbanstylefootwear.com/footwear-market-size/
The 31 countries that publish official household footwear spending add up to $233 billion, led by the US at $121.15 billion in 2025 (BEA, Eurostat, OECD; sum and conversion my calculation).
Copy text
$233B measured footwear spending, 31 countries: The 31 countries that publish official household footwear spending add up to $233 billion, led by the US at $121.15 billion in 2025 (BEA, Eurostat, OECD; sum and conversion my calculation). Source: UrbanStyle estimate. Via UrbanStyle Footwear: https://urbanstylefootwear.com/footwear-market-size/
The countries with official footwear spending data buy only about 20% of the world's pairs, so most of any world total is modelled (my calculation from the Yearbook).
Copy text
20% of pairs bought where spending is measured: The countries with official footwear spending data buy only about 20% of the world's pairs, so most of any world total is modelled (my calculation from the Yearbook). Source: UrbanStyle estimate. Via UrbanStyle Footwear: https://urbanstylefootwear.com/footwear-market-size/
The world made 24.6 billion pairs of shoes in 2025, up 0.1% on 2024 (World Footwear Yearbook 2026).
Copy text
24.6B pairs made in 2025: The world made 24.6 billion pairs of shoes in 2025, up 0.1% on 2024 (World Footwear Yearbook 2026). Source: World Footwear Yearbook 2026. Via UrbanStyle Footwear: https://urbanstylefootwear.com/footwear-market-size/
My central estimate works out to about $23 for each pair bought worldwide, against about $62 in the US and $7.46 implied for India (UrbanStyle calculation).
Copy text
about $23 average retail spend per pair, world: My central estimate works out to about $23 for each pair bought worldwide, against about $62 in the US and $7.46 implied for India (UrbanStyle calculation). Source: UrbanStyle estimate. Via UrbanStyle Footwear: https://urbanstylefootwear.com/footwear-market-size/
US households spent $121.15 billion on footwear in 2025, the largest market in the world (BEA).
Copy text
$121.15B US footwear spending, 2025: US households spent $121.15 billion on footwear in 2025, the largest market in the world (BEA). Source: BEA (via FRED) (DFTWRC1A027NBEA). Via UrbanStyle Footwear: https://urbanstylefootwear.com/footwear-market-size/
China's footwear market is about $95 billion by my estimate (4,817 million pairs at Mexico's official spend per pair), against $43 billion to $92 billion in published figures (UrbanStyle estimate).
Copy text
$95B China footwear market, estimate: China's footwear market is about $95 billion by my estimate (4,817 million pairs at Mexico's official spend per pair), against $43 billion to $92 billion in published figures (UrbanStyle estimate). Source: UrbanStyle estimate. Via UrbanStyle Footwear: https://urbanstylefootwear.com/footwear-market-size/
The Government of India put the Indian footwear market at $20.67 billion in 2025, about $7.46 for each of the 2,772 million pairs Indians bought (PIB; per pair my calculation).
Copy text
$20.67B India footwear market, 2025: The Government of India put the Indian footwear market at $20.67 billion in 2025, about $7.46 for each of the 2,772 million pairs Indians bought (PIB; per pair my calculation). Source: Government of India (PIB). Via UrbanStyle Footwear: https://urbanstylefootwear.com/footwear-market-size/
One published estimate puts North America at about $120.5 billion in 2025, less than official US spending alone ($121.15 billion) (Grand View Research share applied to its total; my calculation).
Copy text
$120.5B North America in one published estimate: One published estimate puts North America at about $120.5 billion in 2025, less than official US spending alone ($121.15 billion) (Grand View Research share applied to its total; my calculation). Source: UrbanStyle estimate. Via UrbanStyle Footwear: https://urbanstylefootwear.com/footwear-market-size/
Women's footwear carries 46% of the footwear weight in the US consumer price index, men's 33% and children's 21%, which reflects what households spend (BLS relative importance, December 2025; shares my calculation).
Copy text
46% of US footwear spending is women's: Women's footwear carries 46% of the footwear weight in the US consumer price index, men's 33% and children's 21%, which reflects what households spend (BLS relative importance, December 2025; shares my calculation). Source: BLS CPI relative importance (CPI-U, U.S. city average). Via UrbanStyle Footwear: https://urbanstylefootwear.com/footwear-market-size/
Footwear exports were worth $172 billion in 2025, $11.65 a pair; my retail estimate is about 3.3 times that (World Footwear Yearbook 2026; ratio my calculation).
Copy text
$172B world footwear exports, 2025: Footwear exports were worth $172 billion in 2025, $11.65 a pair; my retail estimate is about 3.3 times that (World Footwear Yearbook 2026; ratio my calculation). Source: World Footwear Yearbook 2026. Via UrbanStyle Footwear: https://urbanstylefootwear.com/footwear-market-size/
NIKE Brand footwear revenue was $29.5 billion in the year to May 2026, 64% of Nike's total revenue (Nike results; share my calculation).
Copy text
$29.5B Nike footwear revenue, FY2026: NIKE Brand footwear revenue was $29.5 billion in the year to May 2026, 64% of Nike's total revenue (Nike results; share my calculation). Source: Nike FY2026 results. Via UrbanStyle Footwear: https://urbanstylefootwear.com/footwear-market-size/
Nike and adidas footwear revenue together, about $46 billion, equals roughly 8% of my world estimate; at retail prices their share would be higher (my calculation from company results).
Copy text
8% Nike plus adidas, share of world footwear: Nike and adidas footwear revenue together, about $46 billion, equals roughly 8% of my world estimate; at retail prices their share would be higher (my calculation from company results). Source: UrbanStyle estimate. Via UrbanStyle Footwear: https://urbanstylefootwear.com/footwear-market-size/
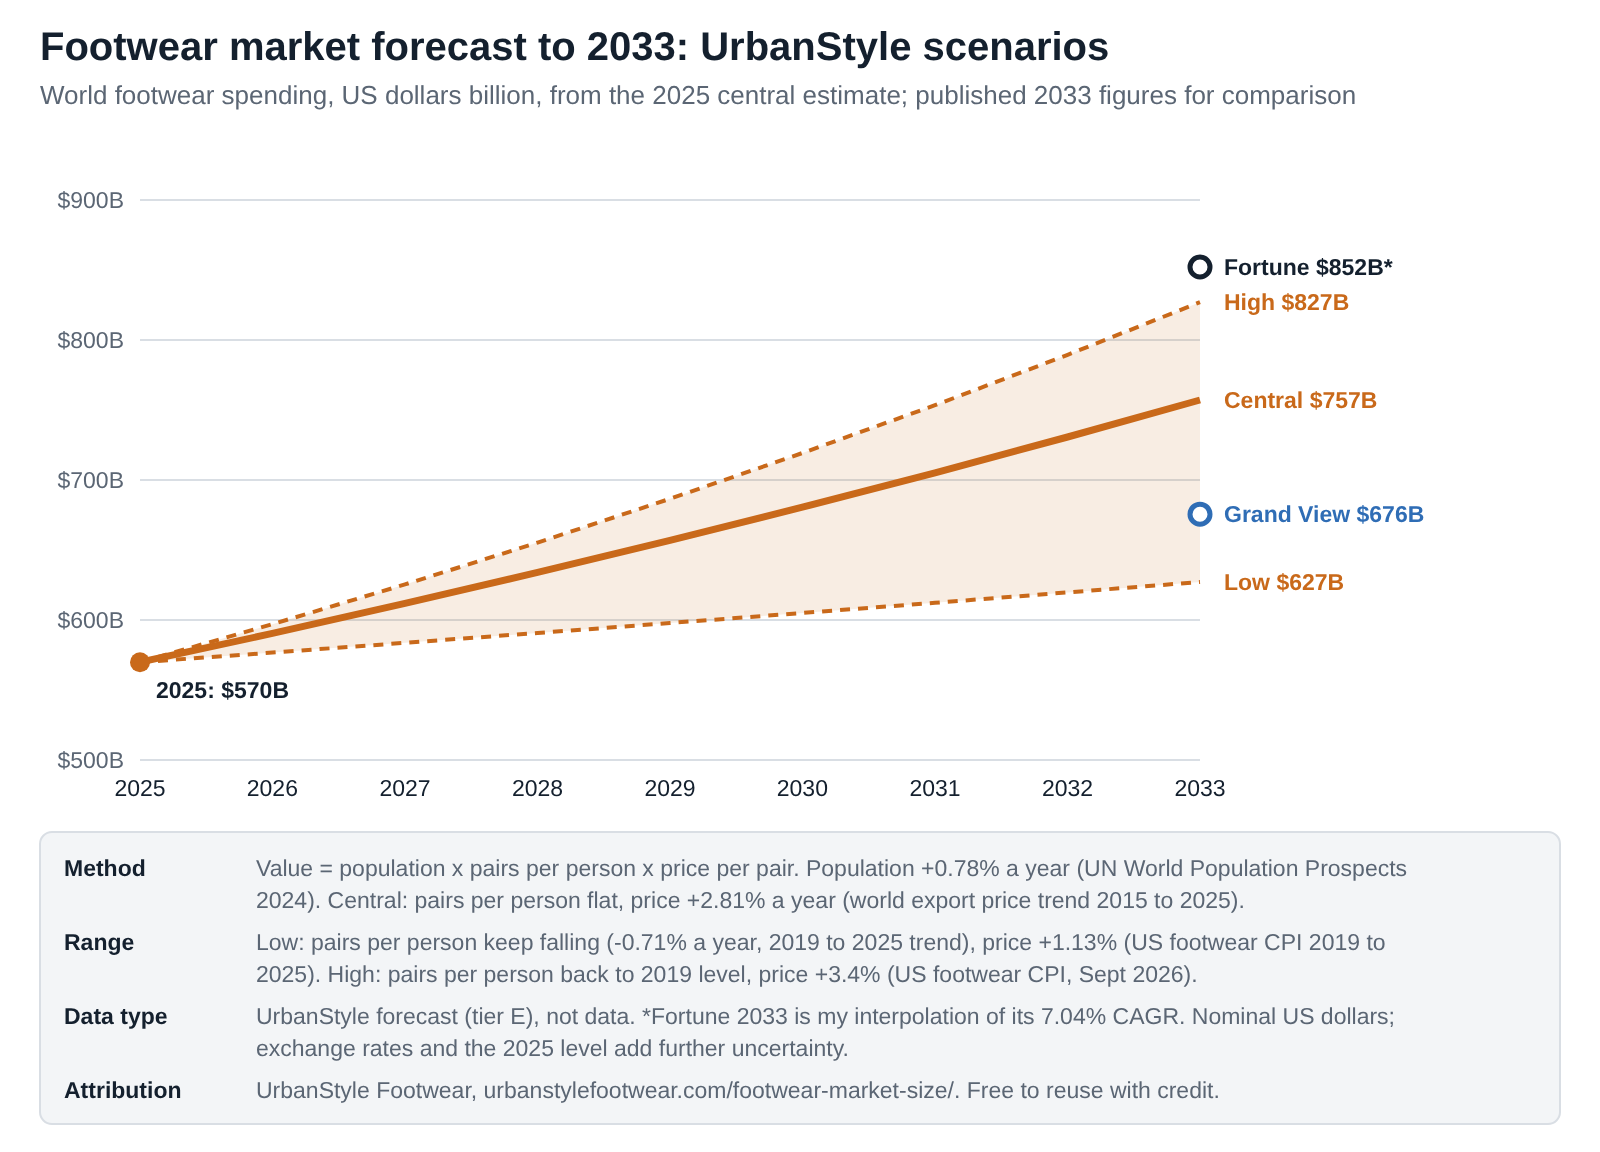
The footwear market could reach about $757 billion by 2033, growing 3.6% a year, within a range of $627 billion to $827 billion (UrbanStyle forecast from UN population projections and footwear price trends).
Copy text
$757B footwear market in 2033, UrbanStyle forecast: The footwear market could reach about $757 billion by 2033, growing 3.6% a year, within a range of $627 billion to $827 billion (UrbanStyle forecast from UN population projections and footwear price trends). Source: UrbanStyle estimate. Via UrbanStyle Footwear: https://urbanstylefootwear.com/footwear-market-size/
How big is the global footwear market?
Short answer. About $570 billion a year by my estimate, with a range of $412 billion to $741 billion. That is consumer spending on footwear at retail prices, including taxes, around 2025. (UrbanStyle estimate)
Embed this chart
<figure style="margin:0"><a href="https://urbanstylefootwear.com/footwear-market-size/"><img src="https://urbanstylefootwear.com/wp-content/uploads/2026/10/usf-global-footwear-market-size-estimates-2026.png" alt="Chart of footwear market size estimates: Mordor $401B, Grand View $496B, Fortune $529B, Statista $704B, ours $570B" width="800" style="max-width:100%;height:auto"></a><figcaption>Source: UrbanStyle Footwear, based on research firms' public pages and the UrbanStyle estimate. <a href="https://urbanstylefootwear.com/footwear-market-size/">Global Footwear Market Size 2026</a></figcaption></figure>Click the code, press Ctrl+C (Cmd+C on Mac), and paste it into any web page. Please keep the attribution link.
View as table
| Estimate | Year | USD billion |
|---|---|---|
| Mordor Intelligence | 2026 | 400.6 |
| Grand View Research | 2026 | 496.2 |
| Fortune Business Insights | 2026 | 529.2 |
| Statista Market Insights | 2026 | 704.0 |
| UrbanStyle (central) | about 2025 | 569.9 |
| UrbanStyle (low) | about 2025 | 411.6 |
| UrbanStyle (high) | about 2025 | 741.0 |
That is about $69 per person on Earth (Statista’s model says $89.11). My central figure sits between Fortune Business Insights ($529 billion) and Statista ($704 billion), and my range covers three of the four published figures. Mordor’s $401 billion is below my low case, which already prices high-income shoes at France’s level and most of the world at India’s.
Sources: research firms’ public pages (tier D); UrbanStyle estimate (tier E). Method in how I built my estimate.What do the published footwear market estimates say?
Short answer. For 2026: Mordor $400.6 billion, Grand View $496.2 billion, Fortune $529.3 billion and Statista $704 billion. They also disagree on growth (3.1% to 7.04%), the largest region and the largest segment.
| Source | 2026 | 2025 | Forecast | Growth rate | Largest region | Segments |
|---|---|---|---|---|---|---|
| Mordor Intelligence Updated October 22, 2026 | $400.6B | not shown | $482.1B (2032) | 3.1% (2027 to 2032) | North America, 31.2% | Non-athletic 56.7%; women 48.8% |
| Grand View Research Updated June 2026 | $496.2B | $476.8B | $675.6B (2033) | 4.5% (2026 to 2033) | Asia Pacific, 40.7% | Non-athletic 66.1%; women 48.0% |
| Fortune Business Insights Updated October 5, 2026 | $529.2B | $495.5B | $912.1B (2034) | 7.04% (2026 to 2034) | Asia Pacific, 32.4% | Casual 46% (2024); men 47.0% |
| Statista Market Insights Updated June 2026 | $704.0B | not shown | not shown (2031) | 4.37% (2026 to 2031) | United States leads ($149B) | Boots largest ($188B); non-luxury 94% |
| UrbanStyle estimate Updated October 26, 2026 | $570B (about 2025) | same | no forecast | n/a | Asia and Pacific, 33% | not estimated |
Do published footwear market figures match official data?
Short answer. Not always. Where a firm publishes a figure I can check against official statistics or its own other numbers, several fail by wide margins.
| Published figure | What official data or arithmetic says | Verdict |
|---|---|---|
| Grand View: North America 25.27% of $476.8 billion = about $120.5 billion (2025) | US household spending alone was $121.15 billion in 2025 (BEA); Canada and Mexico add about $14 billion | Too low |
| Fortune: US $92.67 billion (2026) | US spending was already $121.15 billion in 2025, and Circana expected 2026 sales to end roughly flat | Too low |
| Fortune: North America $144.59 billion minus US $92.67 billion = $51.9 billion for Canada and Mexico (2026) | Official Canada ($7.3 billion, 2025) plus Mexico ($6.7 billion, 2024) is about $14 billion | Too high |
| Fortune: France $0.015 billion (2025) | French household footwear spending was EUR 7.5 billion in 2024, about $8.2 billion (Eurostat) | Units error |
| Fortune: India $35.56 billion (2026) | The Government of India put the market at $20.67 billion in 2025 | Far above |
| Fortune: UK $16.7 billion (2026) | UK spending was GBP 12.3 billion in 2025, about $16.3 billion (OECD) | Close |
| Statista: $704 billion (2026), up 3.8% | That implies about $678 billion in 2025; Statista’s own topic page says 2025 revenue was “almost 500 billion” | Inconsistent |
| Statista: 2.37 pairs per person and $89.11 per person (2026) | Implies 7.9 billion people and about 18.7 billion pairs; the World Bank counts 8.22 billion people and the world made 24.6 billion pairs in 2025 | Low on volume |
| Statista: US $149 billion (2026) | Would need US spending to rise about 23% from $121.15 billion in 2025, while 2026 sales tracked roughly flat | Far above |
| Mordor: North America 31.23% of $400.6 billion = about $125.1 billion (2026) | Leaves about $4 billion for Canada and Mexico, against about $14 billion official | Too low |
| China: Fortune $43.3 billion (2026), Grand View about $74 billion (2025), Statista $91.5 billion (year not shown) | No official figure. My estimate: about $95 billion | Wide spread |
How I estimated the size of the world footwear market
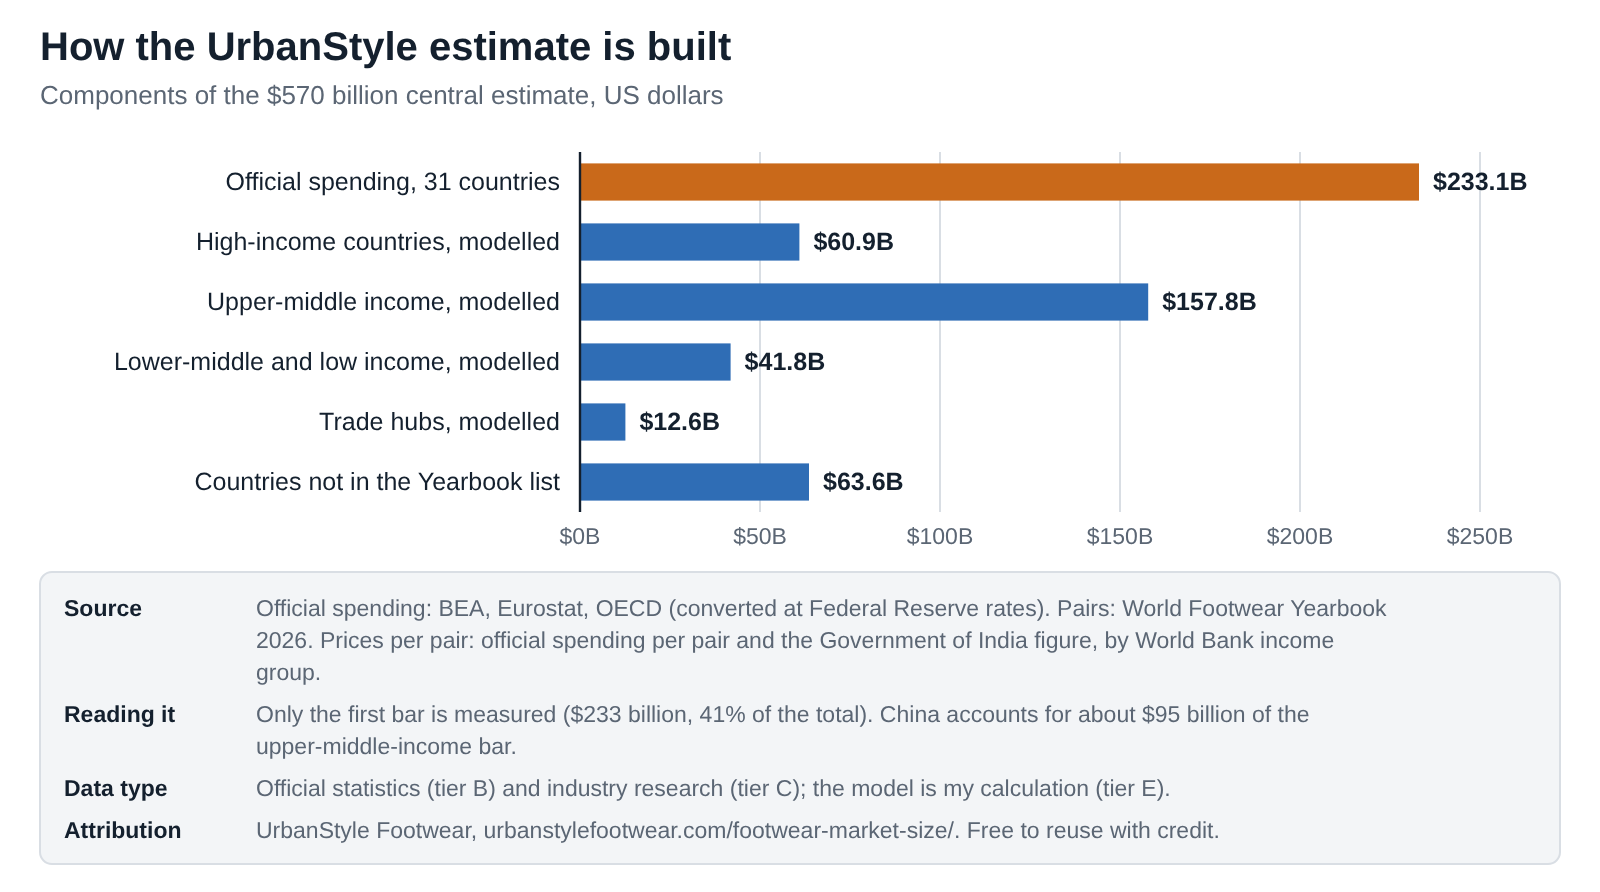
Short answer. Official spending where it exists ($233 billion in 31 countries), plus every other pair bought in the world priced by its country’s World Bank income group, using prices taken from official data. Total: about $570 billion.
- Measured spending. I took official household spending on footwear for the 31 countries that publish it (BEA, Eurostat, OECD): 2025 for the US, UK and Canada, 2024 for the EU countries and Mexico, converted at Federal Reserve average rates. Total $233 billion.
- Pairs everywhere else. The World Footwear Yearbook gives pairs bought in 2025 for 62 countries. The world made 24.6 billion pairs. Countries with official spending account for about 4,930 million of them (I estimate 17 smaller EU countries at Europe’s 4.1 pairs per person). That leaves about 19,670 million pairs to price.
- Prices per pair, from official data. Dividing official spending by pairs gives what people spend per pair. I use the median of the high-income countries ($37.77), Mexico for upper-middle income ($19.74), and India’s government figure for lower-middle and low income ($7.46).
- Price each country by income group. China, Brazil and Indonesia get Mexico’s price; Japan, Korea and Russia the high-income median; India, Pakistan and Nigeria India’s price.
- Trade hubs and the rest. Five trade hubs (UAE, Panama, Singapore, Togo, Chile) and the 3,716 million pairs in countries the Yearbook doesn’t list are priced at the average of the other modelled countries, $17.12 a pair.
Embed this chart
<figure style="margin:0"><a href="https://urbanstylefootwear.com/footwear-market-size/"><img src="https://urbanstylefootwear.com/wp-content/uploads/2026/10/usf-global-footwear-market-estimate-components.png" alt="Bar chart of the estimate: official spending $233B, upper-middle income $158B, high income $61B, lower income $42B" width="800" style="max-width:100%;height:auto"></a><figcaption>Source: UrbanStyle Footwear, based on official spending, the World Footwear Yearbook and World Bank income groups (UrbanStyle estimate). <a href="https://urbanstylefootwear.com/footwear-market-size/">Global Footwear Market Size 2026</a></figcaption></figure>Click the code, press Ctrl+C (Cmd+C on Mac), and paste it into any web page. Please keep the attribution link.
View as table
| Component | USD billion | Type |
|---|---|---|
| Official spending, 31 countries | 233.1 | measured |
| High-income countries, modelled | 60.9 | modelled |
| Upper-middle income, modelled | 157.8 | modelled |
| Lower-middle and low income, modelled | 41.8 | modelled |
| Trade hubs, modelled | 12.6 | modelled |
| Countries not in the Yearbook list | 63.6 | modelled |
| Total | 569.9 |
| Group (modelled countries) | Pairs, 2025 (million) | Price per pair | Value | Examples |
|---|---|---|---|---|
| High income | 1,613 | $37.77 | $60.9B | Japan, South Korea, Russia, Australia, Saudi Arabia |
| Upper-middle income | 7,994 | $19.74 | $157.8B | China, Brazil, Indonesia, Türkiye, South Africa |
| Lower-middle and low income | 5,611 | $7.46 | $41.8B | Pakistan, Bangladesh, Nigeria, Egypt, Ethiopia |
| Trade hubs | 736 | $17.12 | $12.6B | UAE, Panama, Singapore, Togo, Chile |
| Countries not listed | 3,716 | $17.12 | $63.6B | About 140 smaller countries |
How sure is the estimate? Low, central and high
Short answer. Between $412 billion and $741 billion, depending on what shoes cost in the countries without official data. Each $1 change in the average price of those pairs moves the total by about $20 billion.
| Price per pair used, or total | Low | Central | High |
|---|---|---|---|
| High income | $22.77 | $37.77 | $62.13 |
| Upper-middle income | $7.46 | $19.74 | $22.77 |
| Lower-middle and low income | $7.46 | $7.46 | $19.74 |
| Measured official spending | $233.1B | $233.1B | $233.1B |
| Modelled spending | $178.6B | $336.8B | $508.0B |
| World footwear market | $412B | $570B | $741B |
The low case prices high-income shoes at France’s level and everything else at India’s. The high case prices high-income shoes at US levels, upper-middle income at France’s level and lower-income countries at Mexico’s. My central case uses the middle anchor for each group. I think the central case is the most reasonable, but the range is the honest answer.
UrbanStyle estimate (tier E). The measured $233 billion is the same in all three cases.What are the largest footwear markets by value?
Short answer. 1. United States $121.2 billion (official), 2. China about $95 billion (estimate), 3. Japan about $24 billion (estimate), 4. India $20.7 billion (government), 5. Germany $18.3 billion (official), then the UK, Brazil and Russia.
Each row says whether the value is official spending, a government figure or my estimate. Filter by region.
| # | Country | Market, $B | Type | Pairs, 2025 (M) |
|---|---|---|---|---|
| 1 | United States | 121.2 | Official | 1,950 |
| 2 | China | 95.1 | Estimate | 4,817 |
| 3 | Japan | 24.1 | Estimate | 639 |
| 4 | India | 20.7 | Government | 2,772 |
| 5 | Germany | 18.3 | Official | 412 |
| 6 | United Kingdom | 16.3 | Official | 326 |
| 7 | Brazil | 15.5 | Estimate | 787 |
| 8 | Russia | 14.1 | Estimate | 373 |
| 9 | Italy | 10.9 | Official | 289 |
| 10 | Spain | 8.6 | Official | 261 |
| 11 | France | 8.2 | Official | 358 |
| 12 | South Korea | 7.9 | Estimate | 208 |
| 13 | Indonesia | 7.3 | Estimate | 370 |
| 14 | Canada | 7.3 | Official | 163 |
| 15 | Mexico | 6.7 | Official | 340 |
| 16 | Romania | 6.7 | Official | 58 |
| 17 | Türkiye | 5.6 | Estimate | 283 |
| 18 | Australia | 5.2 | Estimate | 137 |
| 19 | United Arab Emirates | 4.7 | Estimate, hub | 273 |
| 20 | Pakistan | 4.6 | Estimate | 620 |
| 21 | Philippines | 4.5 | Estimate | 226 |
| 22 | Thailand | 4.1 | Estimate | 210 |
| 23 | Iraq | 4.1 | Estimate | 206 |
| 24 | Taiwan | 4.0 | Estimate | 106 |
| 25 | South Africa | 3.9 | Estimate | 198 |
| 26 | Netherlands | 3.9 | Official | 79 |
| 27 | Poland | 3.9 | Official | 143 |
| 28 | Saudi Arabia | 3.8 | Estimate | 100 |
| 29 | Belgium | 3.5 | Official | n/a |
| 30 | Vietnam | 3.5 | Estimate | 177 |
| 31 | Iran | 3.4 | Estimate | 173 |
| 32 | Bangladesh | 3.4 | Estimate | 455 |
| 33 | Chile | 3.1 | Estimate, hub | 180 |
| 34 | Argentina | 2.6 | Estimate | 133 |
| 35 | Malaysia | 2.6 | Estimate | 133 |
| 36 | Colombia | 2.3 | Estimate | 118 |
| 37 | Austria | 2.2 | Official | 59 |
| 38 | Portugal | 2.2 | Official | 73 |
| 39 | Peru | 2.1 | Estimate | 107 |
| 40 | Panama | 2.0 | Estimate, hub | 118 |
| 41 | Nigeria | 1.9 | Estimate | 258 |
| 42 | Switzerland | 1.9 | Estimate | 50 |
| 43 | Togo | 1.8 | Estimate, hub | 108 |
| 44 | Greece | 1.8 | Official | 67 |
| 45 | Denmark | 1.6 | Official | n/a |
| 46 | Ghana | 1.5 | Estimate | 201 |
| 47 | Sweden | 1.4 | Official | n/a |
| 48 | Czechia | 1.3 | Official | n/a |
| 49 | Ireland | 1.3 | Official | n/a |
| 50 | Tanzania | 1.1 | Estimate | 150 |
| 51 | Finland | 1.1 | Official | n/a |
| 52 | Algeria | 1.1 | Estimate | 56 |
| 53 | Kenya | 1.0 | Estimate | 132 |
| 54 | Singapore | 1.0 | Estimate, hub | 57 |
| 55 | Slovakia | 0.9 | Official | n/a |
| 56 | Cameroon | 0.8 | Estimate | 111 |
| 57 | Morocco | 0.8 | Estimate | 101 |
| 58 | Hungary | 0.7 | Official | n/a |
| 59 | Croatia | 0.7 | Official | n/a |
| 60 | Senegal | 0.7 | Estimate | 93 |
| 61 | Ethiopia | 0.6 | Estimate | 87 |
| 62 | Guinea | 0.6 | Estimate | 87 |
| 63 | Egypt | 0.6 | Estimate | 84 |
| 64 | Mozambique | 0.6 | Estimate | 76 |
| 65 | Bulgaria | 0.5 | Official | n/a |
| 66 | Lithuania | 0.5 | Official | n/a |
| 67 | Yemen | 0.5 | Estimate | 63 |
| 68 | Angola | 0.5 | Estimate | 62 |
| 69 | Slovenia | 0.4 | Official | n/a |
| 70 | Somalia | 0.4 | Estimate | 53 |
| 71 | DR Congo | 0.4 | Estimate | 53 |
| 72 | Myanmar | 0.4 | Estimate | 51 |
| 73 | Venezuela | 0.4 | Estimate | 51 |
| 74 | Cambodia | 0.4 | Estimate | 51 |
| 75 | Cyprus | 0.3 | Official | n/a |
| 76 | Latvia | 0.3 | Official | n/a |
| 77 | Estonia | 0.2 | Official | n/a |
| 78 | Luxembourg | 0.2 | Official | n/a |
| 79 | Malta | 0.1 | Official | n/a |
Which region has the largest footwear market?
Short answer. Asia and Pacific, at about $189 billion (33% of my estimate), then the Americas ($163 billion) and Europe ($114 billion). By pairs, Asia’s lead is far bigger: 56% of the world’s shoes.
| Region | Footwear market (central estimate) | Share |
|---|---|---|
| Asia and Pacific | $188.7B | 33% |
| Europe | $113.9B | 20% |
| Americas | $163.2B | 29% |
| Middle East and North Africa | $24.5B | 4% |
| Sub-Saharan Africa | $15.9B | 3% |
| Countries not in the Yearbook list | $63.6B | 11% |
| World | $570B | 100% |
Published estimates can’t agree on this either: Grand View says Asia Pacific has 40.7%, Fortune 32.4%, and Mordor names North America the largest region at 31.2%. Asia buys most of the world’s shoes, but at lower prices per pair, so its share of spending is much smaller than its share of pairs.
Regions are my grouping of the Yearbook countries (Asia and Pacific includes Australia; Middle East and North Africa includes Türkiye). Sources as above (tier E).How big is the footwear market by volume?
Short answer. 24.6 billion pairs were made in 2025, up 0.1%, about 3 pairs per person. China buys 4,817 million pairs, India 2,772 million and the US 1,950 million. (World Footwear Yearbook 2026)
Volume is the one part of the market measured the same way everywhere, which is why I build the estimate on it. More detail is on my shoe ownership statistics page (pairs per person in 62 countries) and my largest footwear-producing countries page.
Source: World Footwear Yearbook 2026 (tier C).How much is spent on each pair of shoes?
Short answer. About $23 per pair on average worldwide by my estimate: about $62 in the US, $38 in a typical high-income country, $19.74 in Mexico and $7.46 implied for India.
Embed this chart
<figure style="margin:0"><a href="https://urbanstylefootwear.com/footwear-market-size/"><img src="https://urbanstylefootwear.com/wp-content/uploads/2026/10/usf-footwear-spending-per-pair-by-market.png" alt="Bar chart of spending per pair: export price $11.65, India $7.46, Mexico $19.74, world $23, US $62.13" width="800" style="max-width:100%;height:auto"></a><figcaption>Source: UrbanStyle Footwear, based on official spending, the Government of India and the World Footwear Yearbook (UrbanStyle calculation). <a href="https://urbanstylefootwear.com/footwear-market-size/">Global Footwear Market Size 2026</a></figcaption></figure>Click the code, press Ctrl+C (Cmd+C on Mac), and paste it into any web page. Please keep the attribution link.
View as table
| Measure | USD per pair |
|---|---|
| World export price | 11.65 |
| India (implied, government) | 7.46 |
| Mexico (official) | 19.74 |
| World average (UrbanStyle) | 23.17 |
| High-income median (official) | 37.77 |
| United States (official) | 62.13 |
Romania is the outlier among the official figures, at about $115 a pair. Its 2024 spending is provisional and rose 85% from 2019, so I use the median of the high-income countries rather than the average.
Sources: BEA, Eurostat, OECD, Government of India (tier B); World Footwear Yearbook (tier C). Per pair is my calculation (tier E).How does a $172 billion trade become a $570 billion market?
Short answer. Exports are valued at factory prices: $172 billion in 2025, $11.65 a pair. Shipping, duty, brand costs, the retailer’s costs and margin and sales tax take that to retail. My estimate is about 3.3 times world export value. Many pairs never cross a border, so treat that ratio as a rough guide.
For a single shoe, my cost of a shoe page shows the chain: a $100 US sneaker lands at about $25.59 including duty and freight, and the rest goes to the brand, the retailer and the tax office. Trade flows by country are on my imports and exports page.
Sources: World Footwear Yearbook 2026 (tier C); UrbanStyle cost and trade pages (tiers B to E).Which types of footwear sell the most?
Short answer. By pairs, rubber and plastic shoes dominate: 61% of China’s exported pairs and 38% of US imported pairs in 2025. By value, leather shoes lead US imports with 42% of the money but only 22% of the pairs. (UN Comtrade customs records)
Customs records split every pair by what it’s made of, using the same international codes everywhere. Research firms split by “athletic” and “non-athletic”, which no official source measures. Here are the two biggest flows in the world, counted pair by pair.
US footwear imports by type, 2025
| HS code | Type | Share of value | Share of pairs | USD per pair |
|---|---|---|---|---|
| 6401 | Waterproof rubber or plastic footwear | 0.6% | 1.0% | $7.68 |
| 6402 | Other rubber or plastic footwear | 23.8% | 37.8% | $8.51 |
| 6403 | Leather uppers | 42.5% | 22.4% | $25.70 |
| 6404 | Textile uppers | 29.5% | 29.7% | $13.46 |
| 6405 | Other footwear | 3.6% | 9.0% | $5.48 |
China footwear exports by type, 2025
| HS code | Type | Share of value | Share of pairs | USD per pair |
|---|---|---|---|---|
| 6401 | Waterproof rubber or plastic footwear | 1.6% | 1.3% | $5.45 |
| 6402 | Other rubber or plastic footwear | 53.2% | 61.5% | $3.99 |
| 6403 | Leather uppers | 16.9% | 5.4% | $14.30 |
| 6404 | Textile uppers | 25.9% | 27.1% | $4.42 |
| 6405 | Other footwear | 2.4% | 4.7% | $2.33 |
The gap in price per pair is the story: a leather-upper pair imported into the US cost about $25.70, a rubber or plastic pair about $8.51. Most sneakers fall under textile (6404) or rubber and plastic (6402), depending on the upper. More on materials is in my shoe materials guide.
Source: UN Comtrade, US-reported imports and China-reported exports, HS 6401 to 6405, value and pairs (tier B). Shares and prices per pair are my calculation (tier E). US values include freight and insurance (CIF).Who buys the most footwear: women, men or children?
Short answer. Women. In the US consumer price index, women’s footwear carries 46% of the footwear weight, men’s 33% and children’s 21%. Applied to 2025 spending, that is about $56 billion on women’s shoes, $40 billion on men’s and $26 billion on children’s. (BLS, December 2025; dollar split my calculation)
| End user | CPI weight (Dec 2025) | Share of footwear | About, of 2025 spending |
|---|---|---|---|
| Women's footwear | 0.269 | 46% | $55.8B |
| Men's footwear | 0.191 | 33% | $39.6B |
| Boys' and girls' footwear | 0.124 | 21% | $25.7B |
The BLS sets these weights from what households actually spend, which makes them the only official end-user split I could find for any large market. Research firms disagree with each other here: Grand View and Mordor put women’s footwear at 48.0% and 48.8% of the world market, while Fortune Business Insights puts men’s at 47.0% and calls it the largest.
Source: BLS relative importance of CPI components, December 2025 (tier B); BEA (tier B). The dollar split applies the weights to BEA spending and is an approximation (tier E).What do research firms say about segments?
Short answer. Research firms say non-athletic footwear is larger than athletic, but put its share anywhere from 57% to 66%. They split women’s and men’s footwear differently too. No official statistic splits world spending this way.
| Firm | Product split | End-user split | Channel |
|---|---|---|---|
| Mordor Intelligence | Non-athletic 56.7% (2026) | Women 48.8% | Specialty stores 57.4% |
| Grand View Research | Non-athletic 66.1% (2025) | Women 48.0% | not shown |
| Fortune Business Insights | Casual 46% (2024), athletic 32.8% | Men 47.0% (2026) | Supermarkets 39.1% |
| Statista | Boots largest ($188 billion) | not shown | not shown |
What is measured: in the US, running shoe sales rose 13% in the first half of 2026 while total footwear rose 1% (Circana). The detail is in my running shoe statistics and footwear industry trends report.
Sources: firms’ public pages (tier D); Circana via the trends report (tier C).How much of the footwear market do the biggest brands have?
Short answer. Nike brought in $29.5 billion from footwear in the year to May 2026 and adidas EUR 14.2 billion (about $16.1 billion) in 2025. Together that is about 8% of my world estimate.
Brand revenue mixes wholesale sales (at prices retailers pay) and direct sales (at retail prices), so their share of what shoppers spend is higher than 8%. Footwear was 64% of Nike’s revenue and 57% of adidas’s. The point stands either way: even the two largest brands sell a small share of the world’s shoes, because most of the 24.6 billion pairs are unbranded or local.
Sources: Nike FY2026 results; adidas Annual Report 2025 (tier B); shares are my calculation (tier E).Key companies in the footwear market
The research reports list company names. Here are the latest figures those companies actually reported. A full ranking by footwear revenue is coming in a separate page.
| Company | Latest reported figure | Period | Latest move |
|---|---|---|---|
| Nike (US) | NIKE Brand footwear $29.5B; total revenue $46.4B | Fiscal year to May 2026 | Q1 FY2027 revenue -5% currency-neutral; FY2027 guided down high single digits |
| adidas (Germany) | Footwear EUR 14.2B (about $16.1B); total EUR 24.8B | 2025 | Q2 2026 +14% currency-neutral; 2026 guidance +9% to +10% |
| On (Switzerland) | Net sales CHF 850.3M in one quarter | Q2 2026 | +21.6% at constant currency; 45.7% direct to consumer |
| Deckers / HOKA (US) | Guidance $5.86B to $5.91B for the year | FY to March 2027 | HOKA +7.7% in Q1 FY2027 |
| Yue Yuen (Hong Kong listed; maker) | 252.2M pairs made; average $21.00 a pair | 2025 | Large contract maker for Nike, adidas and ASICS |
How much of the footwear market is online?
Short answer. There is no official world figure. In the US, e-commerce was 17.1% of all retail sales in Q2 2026, with no shoe-only split. Research firms disagree on channels: one says specialty stores have 57%, another that supermarkets lead with 39%.
Shoe stores are only part of the picture. US shoe stores sold $38.72 billion in 2025 (Census), about 32% of US household footwear spending; the rest is sold by department stores, sporting goods and clothing stores, discounters and online retailers. The published estimates for online footwear shares are compared in my online shoe shopping statistics, and the cost of online returns in my shoe return statistics.
Sources: US Census Bureau, e-commerce and monthly retail trade (tier B); firms’ public pages (tier D). The shoe-store share is my calculation (tier E); shoe stores also sell some non-footwear items.How fast is the footwear market growing?
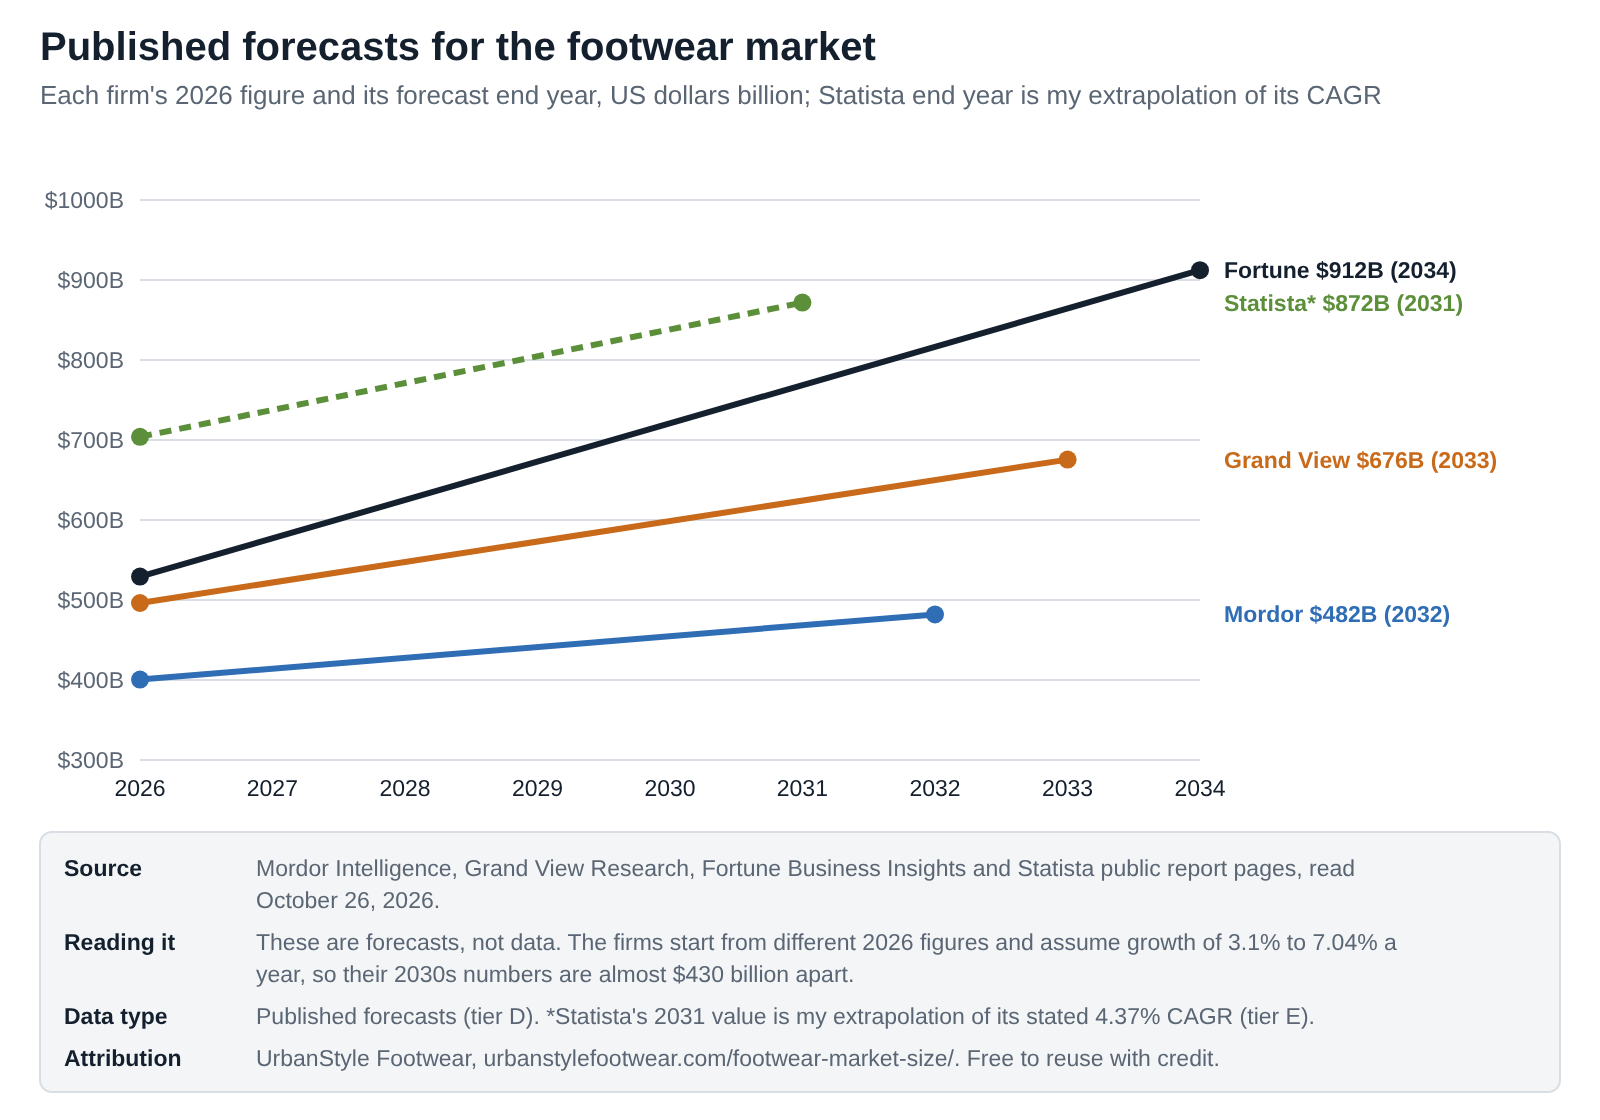
Short answer. Measured growth is slow: world production +0.1% in 2025 and US footwear sales +1% in the first half of 2026 with fewer pairs sold. Published forecasts assume 3.1% to 7.04% a year, mostly from higher prices.
Embed this chart
<figure style="margin:0"><a href="https://urbanstylefootwear.com/footwear-market-size/"><img src="https://urbanstylefootwear.com/wp-content/uploads/2026/10/usf-footwear-market-forecasts-compared.png" alt="Line chart of footwear market forecasts: Mordor $482B by 2032, Grand View $676B by 2033, Fortune $912B by 2034" width="800" style="max-width:100%;height:auto"></a><figcaption>Source: UrbanStyle Footwear, based on research firms' public pages. <a href="https://urbanstylefootwear.com/footwear-market-size/">Global Footwear Market Size 2026</a></figcaption></figure>Click the code, press Ctrl+C (Cmd+C on Mac), and paste it into any web page. Please keep the attribution link.
View as table
| Forecaster | Start year | Start value, USD billion | End year | End value, USD billion | CAGR |
|---|---|---|---|---|---|
| Mordor Intelligence | 2026 | 400.6 | 2032 | 482.1 | 3.1% |
| Grand View Research | 2026 | 496.2 | 2033 | 675.6 | 4.5% |
| Fortune Business Insights | 2026 | 529.2 | 2034 | 912.1 | 7.04% |
| Statista Market Insights | 2026 | 704.0 | 2031 | 871.9 (my extrapolation) | 4.37% |
US household footwear spending rose 4.4% in 2025 to $121.15 billion (BEA), and US shoe prices were 3.4% higher in September 2026 than a year earlier. The full picture, with every forecast labelled, is in my footwear industry trends report 2027.
Sources: firms’ public pages (tier D, forecasts); World Footwear Yearbook (tier C); BEA and BLS (tier B).Footwear market forecast to 2033
Short answer. About $681 billion in 2030 and $757 billion in 2033 in my central case, growing 3.6% a year. The low case reaches $627 billion (1.2% a year) and the high case $827 billion (4.8% a year). World pairs reach about 26.2 billion by 2033. (UrbanStyle forecast)
Embed this chart
<figure style="margin:0"><a href="https://urbanstylefootwear.com/footwear-market-size/"><img src="https://urbanstylefootwear.com/wp-content/uploads/2026/10/usf-footwear-market-forecast-2033.png" alt="Line chart of the UrbanStyle footwear market forecast: $570B in 2025 to $757B in 2033, range $627B to $827B" width="800" style="max-width:100%;height:auto"></a><figcaption>Source: UrbanStyle Footwear, based on UN population projections and footwear price trends (UrbanStyle forecast). <a href="https://urbanstylefootwear.com/footwear-market-size/">Global Footwear Market Size 2026</a></figcaption></figure>Click the code, press Ctrl+C (Cmd+C on Mac), and paste it into any web page. Please keep the attribution link.
View as table
| Year | Low, USD billion | Central, USD billion | High, USD billion |
|---|---|---|---|
| 2025 | 569.9 | 569.9 | 569.9 |
| 2026 | 576.7 | 590.5 | 597.0 |
| 2027 | 583.7 | 611.8 | 625.5 |
| 2028 | 590.7 | 633.9 | 655.3 |
| 2029 | 597.8 | 656.8 | 686.5 |
| 2030 | 605.1 | 680.6 | 719.2 |
| 2031 | 612.3 | 705.2 | 753.5 |
| 2032 | 619.7 | 730.7 | 789.4 |
| 2033 | 627.2 | 757.1 | 827.0 |
How I built it. The market is people times pairs per person times price per pair, so I forecast each part from published data instead of picking a growth rate:
- People: the UN projects world population to grow from 8.23 billion in 2025 to 8.76 billion in 2033, about 0.78% a year.
- Pairs per person: 3.12 in 2019 and 2.99 in 2025. The central case holds it flat; the low case continues the decline (-0.7% a year); the high case returns to the 2019 level by 2033.
- Price per pair: the world export price rose 2.8% a year from 2015 to 2025 (central case). US footwear prices rose 1.1% a year from 2019 to 2025 (low case) and 3.4% in the year to September 2026 (high case).
| Year | Low | Central | High | Pairs (central) |
|---|---|---|---|---|
| 2025 (estimate) | $570B | $570B | $570B | 24.6B |
| 2026 | $577B | $590B | $597B | 24.8B |
| 2027 | $584B | $612B | $625B | 25.0B |
| 2028 | $591B | $634B | $655B | 25.2B |
| 2029 | $598B | $657B | $687B | 25.4B |
| 2030 | $605B | $681B | $719B | 25.6B |
| 2031 | $612B | $705B | $753B | 25.8B |
| 2032 | $620B | $731B | $789B | 26.0B |
| 2033 | $627B | $757B | $827B | 26.2B |
| Growth a year | 1.2% | 3.6% | 4.8% | 0.8% |
Published growth rates by region and segment
| Market or segment | Published growth rate |
|---|---|
| World | Grand View 4.5% (2026 to 2033); Fortune 7.04% (2026 to 2034); Mordor 3.1% (2027 to 2032); Statista 4.37% (2026 to 2031) |
| North America / US | Grand View: US 3.9%, Canada 4.3% |
| Europe | Grand View: Europe 3.8%, UK 4.1%, Germany 4.3% |
| Asia Pacific | Grand View: Asia Pacific 5.1% (fastest), India 5.9% |
| Latin America | Grand View: 4.4% |
| Middle East and Africa | Grand View: 4.7% |
| Athletic footwear | Grand View: 5.2% |
| Children's footwear | Grand View: 4.4% |
| Women's footwear | Fortune: 6.79% |
| Online channel | Fortune: 8.27% (fastest channel) |
My central rate (3.6%) sits between Grand View’s 4.5% and Mordor’s 3.1%, and well below Fortune’s 7.04%. Almost all of it is price: volume grows only with population unless people start buying more pairs each, which they haven’t since 2019.
Sources: UN World Population Prospects 2024 (tier B); World Footwear Yearbooks and BLS CPI (tiers B and C); research firms’ public pages (tier D). The forecast is mine (tier E): a projection, not data, in nominal US dollars from my 2025 central estimate.What drives and holds back the footwear market?
Short answer. Growth comes from population and prices, plus strong demand for running and comfort shoes. It is held back by flat pairs per person, price-sensitive shoppers, tariffs and new regulation. Each line below has a number behind it.
| Factor | Type | Evidence |
|---|---|---|
| Population growth | Driver | World population +0.78% a year to 2033 (UN) |
| Rising prices | Driver | Export price per pair +2.8% a year 2015 to 2025; US footwear prices +3.4% in the year to September 2026 (Yearbook, BLS) |
| Running and performance | Driver | US running shoe sales +13% in H1 2026 against +1% for all footwear (Circana) |
| Room to grow in low-consumption markets | Opportunity | Africa buys 1.6 pairs per person and India 1.9, against 4.6 in North America (Yearbook) |
| Online selling | Opportunity | E-commerce 17.1% of all US retail in Q2 2026 (Census); Fortune expects online to grow fastest (8.27% a year) |
| Flat volume per person | Restraint | World pairs per person 3.12 in 2019, 2.99 in 2025 (Yearbook, World Bank) |
| Price-sensitive shoppers | Restraint | Nearly half of US consumers delayed shoe purchases or traded down because of prices (Circana, 2026) |
| Tariffs and trade disruption | Restraint | US footwear imports -18.0% in value and -11.8% in pairs in Q1 2026; three US tariff regimes in 2026 |
| Regulation | Challenge | EU ban on destroying unsold footwear for large companies from 19 July 2026 |
| Environmental footprint | Challenge | No reliable current figure for footwear’s share of world emissions. One report cites about 1.4% from a footwear company; the best-known study, from 2018, acknowledged significant data gaps |
What changed in the footwear industry in 2026?
- February 20: the US Supreme Court struck down the IEEPA tariffs; a temporary 10% surcharge applied from February 24 to July 24.
- Q1 2026: US footwear imports fell 18.0% in value and 11.8% in pairs; China’s footwear exports fell 17.6%.
- July 19: the EU ban on destroying unsold clothing and footwear started for large companies.
- July 24: Section 301 tariffs of 12.5% on Vietnam and China and 10% on Indonesia and India replaced the surcharge.
- Summer: adidas grew 14% in Q2 and raised its 2026 guidance to 9% to 10%; On grew 21.6% at constant currency.
- August: the World Footwear Yearbook 2026 reported 24.6 billion pairs made in 2025; Circana reported US running sales up 13% in the first half.
- October 1: Nike reported revenue down 5% currency-neutral and expects fiscal 2027 revenue to fall by a high single-digit percentage.
How did 2020 change the footwear market?
Short answer. World production fell 15.8% in 2020. Household footwear spending fell 11.4% in the US, 16.7% in the EU and 23.3% in the UK, and all three were above 2019 levels by 2022.
The 2020 drop is why 2019 is still the reference year for pairs per person, and why forecasts that start from a pandemic-depressed year can look faster than the market really is. Details are on my market size by country and producing countries pages.
Sources: World Footwear Yearbook 2021 via World Footwear; BEA, Eurostat, OECD (tiers B and D); changes as calculated on those pages (tier E).Why do footwear market size estimates differ so much?
Short answer. They measure different things, cover different products, and fill the same big gap (countries with no official data) with different, unpublished assumptions.
| What is counted | Example | Typical size |
|---|---|---|
| Consumer spending at retail prices | National accounts; my estimate | $570 billion (my estimate) |
| Modelled retail revenue | Research firms | $401 billion to $704 billion |
| Brand revenue | Nike, adidas results | Partly wholesale prices; lower |
| Exports at factory prices | World Footwear Yearbook | $172 billion |
| Pairs | World Footwear Yearbook | 24.6 billion pairs |
Scope differs too. Statista counts sales of four segments (sneakers, athletic, leather, and textile and other footwear) to private customers only. Fortune Business Insights describes its market as sandals, boots, shoes, flip-flops and slippers. Grand View splits athletic and non-athletic. None publishes enough to reconcile them, and exchange rates, the base year and whether sales tax is included all move the totals.
Who measures the footwear market?
Select a step to see each source and how I use it.
1Shops and householdsRetail sales and household surveys
Every pair bought is a sale somewhere. Statistics offices combine retail and survey data to estimate household spending.
2National statistics officesBEA, Eurostat, OECD
Publish household spending on footwear (COICOP 03.2) for about 31 countries. This is the measured part of my estimate.
3Industry yearbookAPICCAPS, World Footwear Yearbook
Estimates pairs made and bought in every major country. This is how I size the rest of the world.
4Research firmsMordor, Grand View, Fortune, Statista
Sell modelled market sizes and forecasts with methods that are not public. I compare and check them, but don’t build on them.
5My estimateUrbanStyle Footwear
Official spending plus the remaining pairs priced by income group, with every input in the dataset.
How good is the evidence behind footwear market size figures?
Short answer. Strong for the measured part, weaker for the modelled part. Of the 371 rows in this page’s dataset, 31% are official statistics (tier B), 17% industry research (tier C), 5% research-firm figures (tier D) and 47% my calculations (tier E).
| Evidence tier | Rows | Share |
|---|---|---|
| A Peer-reviewed research | 0 | 0% |
| B Official statistics | 114 | 31% |
| C Industry research | 64 | 17% |
| D Research-firm estimates | 19 | 5% |
| E UrbanStyle calculations | 174 | 47% |
| Total | 371 | 100% |
Where other footwear market reports go wrong
These are problems I saw on the public pages of the reports compared above. This is not an audit of their full, paid reports.
- Problem 1One headline number with no range, though the method is not public.
- Problem 2Regional and country figures that fall below official spending.
- Problem 3Obvious unit errors left on the page.
- Problem 4Two different figures for the same year on the same company’s website.
- Problem 5Volume figures below the number of pairs the world actually makes.
- Problem 6Forecasts to 2033 or 2034 presented with the same certainty as past data.
- Problem 7Brand share data last updated years ago, still on the page.
- Problem 8Segment splits (athletic, women’s) with no official data behind them, and no agreement between firms.
- Problem 9Growth rates with no stated inputs, so you can’t tell how much is price and how much is volume.
- Problem 10No downloadable data, so nobody can check the numbers.
How to use footwear market size numbers well
- Quote a range, and say what it measures. “About $570 billion of consumer spending, range $412 billion to $741 billion” is more honest than any single figure.
- Name the source and year for any research-firm figure; they differ by up to $303 billion.
- Use official data for the US, EU and UK. It is free, current and consistent.
- Use pairs for China and India, and say any dollar figure is an estimate.
- Treat forecasts as scenarios. Measured growth in 2025 and 2026 has been close to flat in volume.
- Check a figure against something you know. If a region comes out smaller than one country in it, something is wrong.
Sources and evidence tiers
Evidence hierarchy
- APeer-reviewed research. Not used on this page.
- BOfficial statistics and company filings. BEA, Eurostat, OECD, Federal Reserve, World Bank, US Census Bureau, Government of India, Nike and adidas.
- CIndustry research. The World Footwear Yearbook 2026.
- DResearch-firm estimates. Mordor Intelligence, Grand View Research, Fortune Business Insights and Statista, as shown on their public pages.
- EUrbanStyle calculations and estimate. Conversions, checks and the market model, with the method stated.
Source table
| Source | Year | Sample | Geography | Finding used | Tier | Series ID | Primary source |
|---|---|---|---|---|---|---|---|
| US Bureau of Economic Analysis, personal consumption expenditures on footwear, via FRED (DFTWRC1A027NBEA, updated September 30, 2026) | 2025 | US national accounts | United States | US household footwear spending $121.150 billion in 2025 | B | DFTWRC1A027NBEA | FRED series |
| Eurostat, household final consumption expenditure by purpose (COICOP 2018), nama_10_cp18, footwear (CP032), current prices (updated July 30, 2026) | 2024 | National accounts of the 27 EU member states | European Union | EU27 household footwear spending EUR 75,257.7 million in 2024; member-state values | B | nama_10_cp18, CP032 | Eurostat data browser |
| OECD, annual household final consumption expenditure by purpose, DSD_NAMAIN10@DF_TABLE5_T501, footwear (CP032) | 2025 | National accounts reported to the OECD | United Kingdom, Canada, Mexico | UK GBP 12,327 million and Canada CAD 10,162 million in 2025; Mexico MXN 122,878 million in 2024 | B | DF_TABLE5_T501, CP032 | OECD Data Explorer |
| Federal Reserve, G.5A Foreign Exchange Rates (Annual), released January 5, 2026 | 2026 | Annual average exchange rates | Global | 2024 and 2025 averages used for conversions | B | G.5A | Federal Reserve G.5A |
| World Bank, population (SP.POP.TOTL) and country income classifications (read October 26, 2026) | 2025 | Official statistics and classifications | Global | Population 2025; income groups used to price pairs | B | SP.POP.TOTL; incomeLevel | World Bank data |
| United Nations, World Population Prospects 2024, medium variant, world population 2025 to 2033 (read via PopulationPyramid.net, which republishes it) | 2024 | Official UN projections | Global | World population 8,231,613,069 in 2025 and 8,761,449,080 in 2033 (medium variant) | B | WPP 2024, medium variant | UN WPP |
| APICCAPS, World Footwear Yearbook 2026, free sample report (PDF) | 2026 | Industry yearbook, 2025 data | Global | World production 24.6 billion pairs; consumption for 62 countries; Europe 4.1 pairs per person; exports $172 billion, $11.65 a pair | C | n/a | Yearbook sample (PDF) |
| United Nations Comtrade, 2025 US imports and China exports of HS 6401 to 6405, value and pairs (read October 25, 2026) | 2025 | Customs records | United States, China | US imports 1,986 million pairs and $26.9 billion by heading; China exports 9,016 million pairs by heading | B | HS 6401 to 6405 | UN Comtrade |
| US Bureau of Labor Statistics, relative importance of CPI components, December 2025 | 2025 | Official price-index expenditure weights | United States | Footwear 0.585; women's 0.269; men's 0.191; boys' and girls' 0.124 (percent of all items) | B | CPI-U, U.S. city average | BLS table |
| US Bureau of Labor Statistics, CPI footwear (CUUR0000SEAE), via FRED | 2026 | Official price index | United States | Footwear prices +7.0% from December 2019 to December 2025; +3.4% in the year to September 2026 | B | CUUR0000SEAE | FRED series |
| US Census Bureau, monthly retail trade, shoe stores (NAICS 4482), via FRED MRTSSM4482USN | 2025 | Official retail survey | United States | Shoe-store sales of $38.72 billion in 2025 (sum of 12 months) | B | MRTSSM4482USN | FRED series |
| Press Information Bureau (Government of India), blog by the Union Minister of Textiles (May 5, 2026) | 2026 | Government statement | India | Indian footwear market valued at $20.67 billion in 2025 | B | n/a | PIB blog |
| NIKE, Inc., fiscal 2026 fourth quarter and full year results (June 30, 2026) | 2026 | Company results | Global | NIKE Brand footwear revenue $29,525 million in fiscal 2026; total revenue $46,398 million | B | n/a | Nike release |
| adidas Annual Report 2025, income statement (net sales by product division) | 2026 | Company annual report | Global | Footwear net sales EUR 14,232 million in 2025; total EUR 24,811 million | B | n/a | adidas report |
| US Census Bureau, quarterly e-commerce report (FRED ECOMPCTSA) | 2026 | Official retail survey | United States | E-commerce 17.1% of all US retail sales in Q2 2026 | B | ECOMPCTSA | FRED series |
| Mordor Intelligence, "Footwear market" report page (updated October 22, 2026) | 2026 | Commercial research summary; method not public | Global | $400.6 billion in 2026; $482.1 billion in 2032; CAGR 3.1% (2027 to 2032); North America 31.23% | D | n/a | Mordor page |
| Grand View Research, "Footwear market (2026 to 2033)" report page (published June 2026) | 2026 | Commercial research summary; method not public | Global | $476.8 billion in 2025; $496.2 billion in 2026; $675.6 billion in 2033; CAGR 4.5%; Asia Pacific 40.7%; North America 25.27%; China 38.34% of Asia Pacific | D | GVR-3-68038-396-6 | Grand View page |
| Fortune Business Insights, "Footwear market" report page (updated October 5, 2026) | 2026 | Commercial research summary; method not public | Global | $495.46 billion in 2025; $529.25 billion in 2026; $912.13 billion in 2034; CAGR 7.04%; US $92.67 billion (2026); France $0.015 billion (2025) | D | FBI112088 | Fortune page |
| Statista Market Insights, "Footwear: Worldwide" (most recent update June 2026), and Statista topic page "Global footwear market" | 2026 | Commercial model; method described in general terms | Global | $704 billion in 2026; CAGR 4.37% (2026 to 2031); US $149 billion; $89.11 and 2.37 pairs per person; 21.94 billion pairs by 2031; topic page: 2025 revenue "almost 500 billion" | D | n/a | Statista page |
| UrbanStyle Footwear, Footwear Industry Trends Report 2027 (Circana, company results, US tariff timeline, EU destruction ban, each sourced there) | 2026 | Published page, fully sourced | Global | Running +13% in H1 2026; nearly half of shoppers delayed or traded down; tariff changes; EU ban from 19 July 2026; On, adidas, Nike results | E | n/a | Trends report |
| UrbanStyle Footwear research pages: market size by country, shoe ownership, producing countries, imports and exports, cost of a shoe, trends report (October 2026) | 2026 | Published pages, each fully sourced | Global | Figures carried into this page are sourced on those pages | E | n/a | Footwear statistics hub |
| UrbanStyle Footwear estimate and calculations on this page | 2026 | Official spending plus pairs priced by income group; method stated | Global | World footwear market estimate, range, country and regional estimates, checks against published estimates | E | n/a | Methodology |
Methodology and limitations
What the estimate measures. Household spending on footwear at retail prices including taxes, the same definition national accounts use (COICOP 03.2), for around 2025. It is a level estimate, not a forecast.
How I built it. Official spending for 31 countries (BEA, Eurostat, OECD) converted at Federal Reserve annual averages; Yearbook 2026 pairs for 62 countries and the world total of 24.6 billion; World Bank 2025 population and income groups; prices per pair from official spending divided by pairs (high-income median $37.77, Mexico $19.74) and from the Government of India’s $20.67 billion ($7.46). Countries are priced by income group; trade hubs and unlisted countries at the average of the rest. Low and high cases change only the prices. Everything was read on October 26, 2026.
The forecast. Value in each year = 2025 central estimate x population growth (UN WPP 2024 medium) x change in pairs per person x change in price per pair, with the three cases described in the forecast. It is in nominal US dollars and does not model exchange rates, recessions or tariffs.
Limitations you should know about
- It is an estimate. 41% is measured; the rest depends on price assumptions, shown in the range.
- Mixed years. US, UK and Canada spending is 2025; EU and Mexico 2024; pairs and population 2025.
- Income groups are broad. Prices vary within a group; Japan and Saudi Arabia get the same high-income price.
- India anchors the low-income price. Its government figure has no published method, and the poorest countries may spend less per pair.
- Pairs are estimates too. The Yearbook’s consumption figures are industry estimates, inflated in trade hubs.
- Research-firm figures are as shown on free pages; the paid reports may define the market differently.
- Taiwan is not in World Bank data; I treat it as high income.
- The forecast starts from the central 2025 level; the uncertainty in that level (the range above) adds to the forecast range.
- End-user split is for the US only; no official world split exists.
Data freshness
| Date | Change |
|---|---|
| October 26, 2026 | First publication. Official spending to 2025, Yearbook 2026 pairs, World Bank 2025 population and income groups, four research-firm pages read the same day, Nike FY2026 and adidas 2025 results. |
| When Eurostat publishes 2025 | Planned update of the measured part and the estimate. |
| January 2027 | Next scheduled full review, including fresh research-firm figures. |
Last full source review: October 26, 2026. Next scheduled review: January 2027.
Corrections. If you spot an error, have official spending data for another country, or think a price assumption is wrong, email info@urbanstylefootwear.com with the subject “Data correction”. How we review products is explained in our methodology.
For journalists and researchers
You can use the statistics and charts on this page with credit to UrbanStyle Footwear. Please cite original sources for single statistics, and describe my world figure as an estimate with its range.
A sentence you can use. “The world spends about $570 billion a year on footwear, according to an UrbanStyle Footwear estimate built from official spending data and World Footwear Yearbook pairs (range $412 billion to $741 billion); published research-firm estimates for 2026 range from $401 billion to $704 billion. On the same method, the market could reach about $757 billion by 2033.”
Media kit
All figures with value, unit, geography, segment, basis, period, source and evidence tier.
Five charts with source, scope and data type printed on each image. SVG versions are under each chart above.
The 15 citable statistics on one printable PDF.
Every source with year, sample, geography, tier, series ID and link.
All 79 countries: market value, type (official, government or estimate), pairs, income group and the price per pair used.
Ready-made citations below. Media and research enquiries go to info@urbanstylefootwear.com.
Cite this page
Suggested citation
UrbanStyle Footwear. “Global Footwear Market Size 2026: How Big Is the Shoe Industry Really?.” Updated October 26, 2026. https://urbanstylefootwear.com/footwear-market-size/
APA style
Vahith, A. (2026, October 26). Global footwear market size 2026: How big is the shoe industry really? UrbanStyle Footwear. https://urbanstylefootwear.com/footwear-market-size/
Link (HTML)
<a href="https://urbanstylefootwear.com/footwear-market-size/">Global Footwear Market Size by UrbanStyle Footwear</a>Click any citation, then press Ctrl+C (Cmd+C on Mac) to copy it.
For individual statistics, UrbanStyle recommends citing the original source listed in the source table whenever possible.
Data requests. Data correction or dataset request: info@urbanstylefootwear.com
Frequently asked questions
How big is the global footwear market?
About $570 billion a year by my estimate (around 2025), with a plausible range of $412 billion to $741 billion. Research firms put 2026 between $401 billion and $704 billion. See how I built the estimate.
Why do footwear market size estimates differ so much?
They define the market differently (retail sales, consumer spending, brand revenue or wholesale value), cover different products and countries, and fill gaps with unpublished models. Only about a fifth of the world’s pairs are bought in countries that publish official spending. See why estimates differ.
Which estimate should I quote?
If you need one number, quote a range and say what it measures. “About $570 billion (range $412 billion to $741 billion)” is my estimate with a published method. If you quote a research firm, name it and the year, because their figures differ by up to $303 billion.
What is the largest footwear market in the world?
The United States, with $121.15 billion of household spending in 2025 (BEA). China is second by my estimate, at about $95 billion, but it publishes no official footwear spending figure. Country rankings from official data are on my market size by country page.
How many pairs of shoes are sold worldwide each year?
About 24.6 billion pairs were made in 2025, about 3 per person (World Footwear Yearbook 2026). See my shoe ownership statistics for pairs per person by country.
How fast is the footwear market growing?
Published forecasts range from 3.1% to 7.04% a year. Measured data is slower: world production rose 0.1% in 2025, and US footwear sales rose 1% in the first half of 2026 with fewer pairs sold. See my trends report.
How big will the footwear market be in 2030 and 2033?
By my forecast, about $681 billion in 2030 and $757 billion in 2033, growing about 3.6% a year (range $627 billion to $827 billion in 2033). Published forecasts range from $482 billion (Mordor, 2032) to $912 billion (Fortune Business Insights, 2034). See my forecast.
Do women or men spend more on shoes?
Women. In the US consumer price index, women’s footwear carries 46% of the footwear weight, men’s 33% and children’s 21% (BLS, December 2025). Research firms disagree: two put women’s footwear at about 48% of the world market, one says men’s is the largest at 47%.
Which region has the biggest footwear market?
By my estimate, Asia and Pacific (about $189 billion), then the Americas (about $163 billion) and Europe (about $114 billion). Research firms disagree: two say Asia Pacific, one says North America.
How big is the footwear market in China and India?
India: $20.67 billion in 2025 by the Government of India. China: about $95 billion by my estimate; published figures range from $43 billion to $92 billion, and China publishes no official footwear spending figure.
Is athletic or non-athletic footwear bigger?
Research firms say non-athletic, but their shares range from about 57% to 66%, and one firm splits the market into casual, athletic and formal instead. No official statistic splits world spending this way. US retail tracking shows running shoes growing fastest in 2026.
What share of the footwear market do Nike and adidas have?
Their footwear revenue, about $46 billion together, equals roughly 8% of my world estimate. Brand revenue is partly at wholesale prices, so their share of retail spending is higher.
How much of the footwear market is online?
There is no official world figure. In the US, e-commerce was 17.1% of all retail sales in Q2 2026 (Census), with no shoe-only split. See my online shoe shopping statistics.
Why is your estimate different from the research firms?
Because I start from official spending where it exists ($233 billion) and price the remaining pairs with stated assumptions, and I show every step. Mine sits between the firms’ figures; the range of $412 billion to $741 billion covers most of theirs.
Can I use these statistics and download the data?
Yes, with credit to UrbanStyle Footwear. Please cite original sources for single statistics and name my estimate as an estimate. The CSV, XLSX, charts and key statistics are in the media kit, with citation formats.