
Footwear Market Size by Country: Global Rankings and Revenue
Most “footwear market size” rankings come from paywalled research with no published method, and different firms give very different numbers for the same country. I wanted a ranking anyone could check, so this one uses what statistics offices measure: how much households actually spend on shoes, from national accounts in 31 countries. For the big Asian markets that don’t publish spending, I show pairs bought instead, and keep commercial estimates in a separate, labelled table. The data is free to download.
Six headline footwear market numbers. Select one to see what it counts and where it comes from.
Select a topic above, for example “Per person”, to see what the number counts.
$116BUS households spent $116.1 billion on footwear in 2024 and $121.2 billion in 2025 (BEA, tier B), more than all 27 EU countries combined ($81.4 billion in 2024, my conversion).
$18.3BGermany is the largest market in Europe: EUR 16.9 billion in 2024, about $18.3 billion (Eurostat, my conversion, tier E). The UK is next at about $15.5 billion.
$341The average American spent about $341 on footwear in 2024, against about $181 for the average EU resident (my calculation from national accounts, tier E).
4.8 billionChina consumes the most pairs: about 4,817 million in 2025, against 1,950 million in the US (World Footwear Yearbook 2026, tier C). China publishes no official footwear spending figure.
+32%US footwear spending rose 32% from 2019 to 2025 in current dollars; EU spending rose 7.5% from 2019 to 2024 in euros (my calculation, tier E). Neither is adjusted for inflation.
about $62Dividing US footwear spending in 2025 by pairs consumed gives about $62 a pair (my calculation from BEA and the Yearbook, tier E).
Each number names its source and evidence tier. All fifteen of my citable statistics are further down this page.
Footwear market size by country at a glance
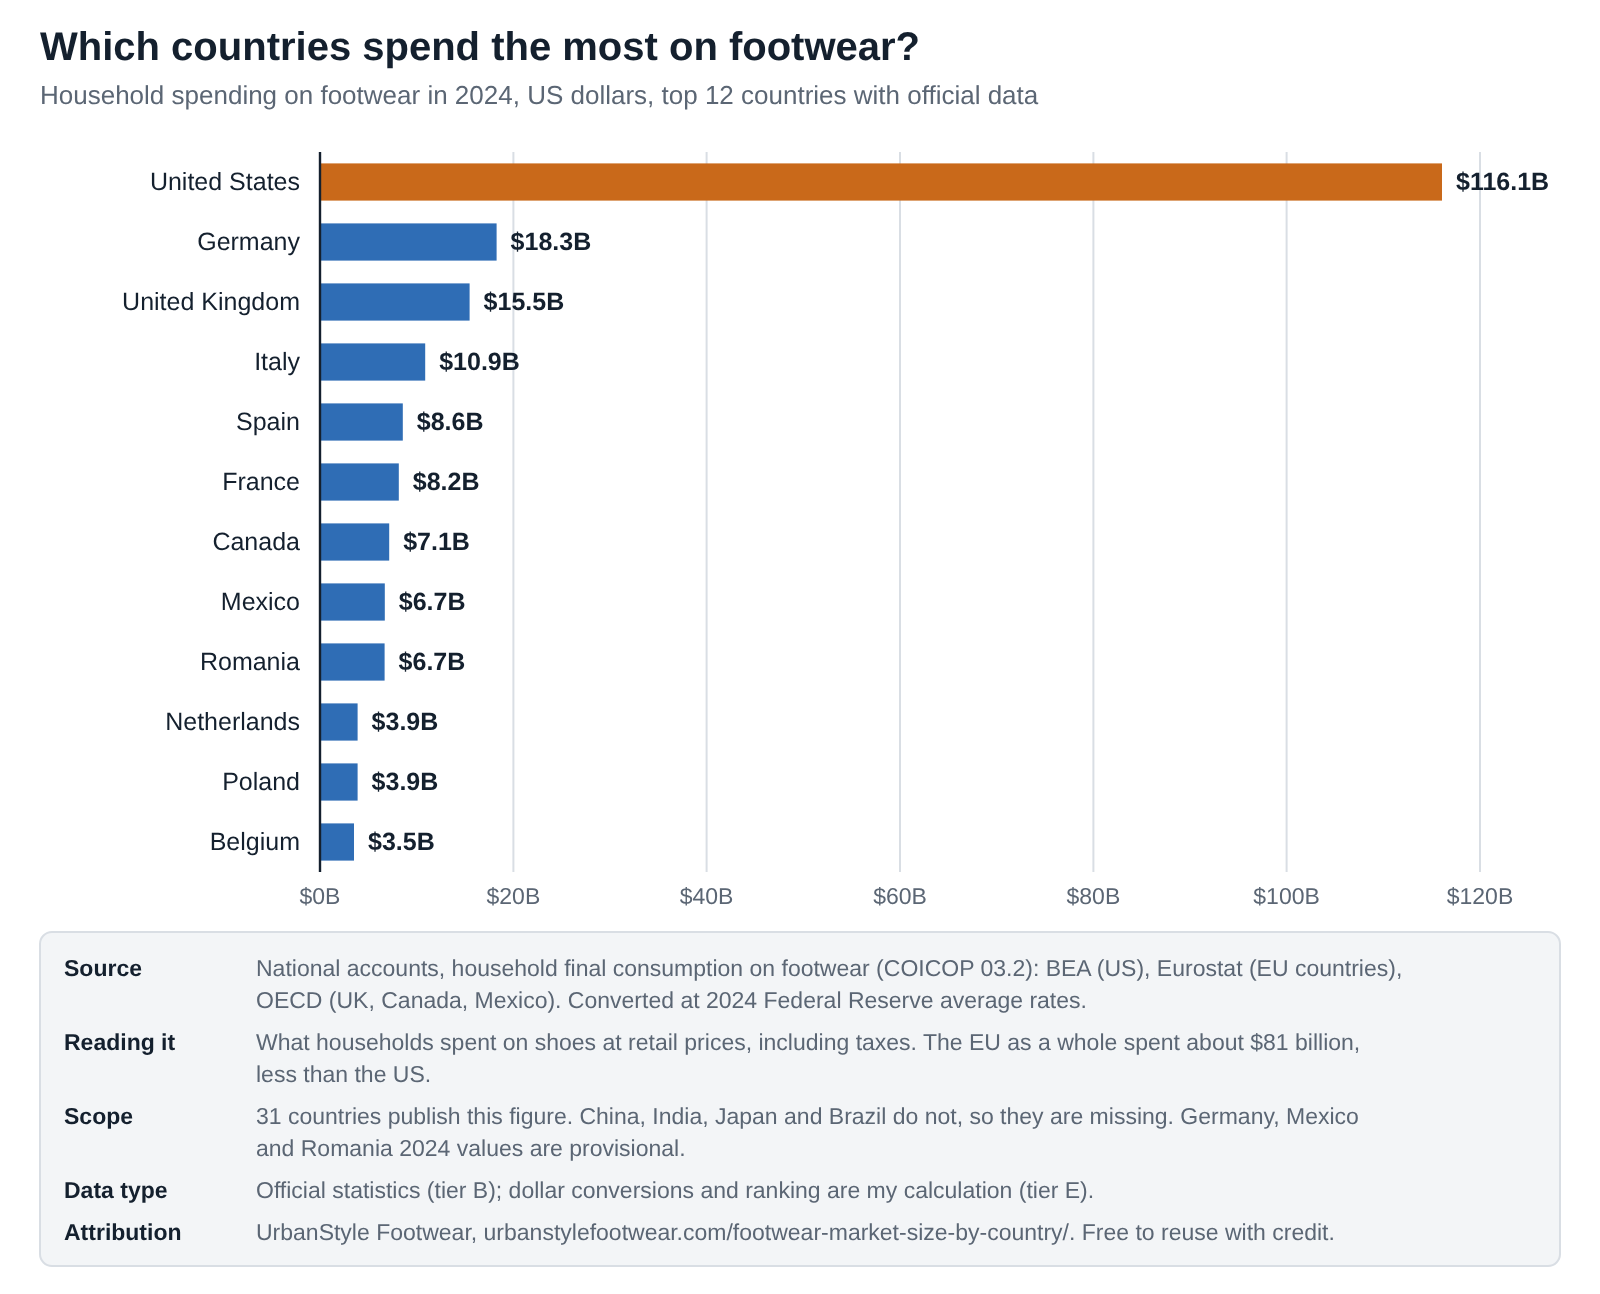
Quick answer. By official household spending, the United States is the world’s largest footwear market at $116.1 billion in 2024 ($121.2 billion in 2025). Next come Germany ($18.3 billion), the UK ($15.5 billion), Italy ($10.9 billion), Spain ($8.6 billion) and France ($8.2 billion). The 27 EU countries together spent about $81.4 billion. China, India, Japan and Brazil publish no official footwear spending figure; by pairs, China buys the most shoes (about 4.8 billion pairs in 2025), then India (2.8 billion) and the US (1.95 billion). Spending figures are national accounts converted at 2024 average exchange rates.
This page measures what consumers spend. It is the third in my footwear industry research: where shoes are made is on the largest footwear-producing countries page, and how they cross borders is on footwear imports and exports by country. For the US market in detail, see US footwear market statistics.
Key findings
- The US is the largest footwear market by spending: $116.1 billion in 2024 and $121.2 billion in 2025, up 4.4%. That is about 1.4 times the whole EU.
- The 27 EU countries spent EUR 75.3 billion on footwear in 2024, about $81.4 billion. Germany led with EUR 16.9 billion, then Italy, Spain and France.
- The top six markets with official data are the US, Germany, the UK, Italy, Spain and France. The US alone is about half the spending of all 31 countries combined.
- Per person, Americans spent about $341 on footwear in 2024, against $224 in the UK, $219 in Germany and $181 across the EU. Romania’s provisional figure, about $350, is the highest.
- Every market fell in 2020, the UK by 23%, the EU by 17% and the US by 11%, and all were back above 2019 levels by 2022.
- From 2019, US footwear spending rose 32% to 2025 in current dollars, Canada’s 25% and the EU’s 7.5% to 2024. Italy and Poland spent less in 2024 than in 2019.
- By pairs, China is the biggest market at about 4.8 billion pairs a year, followed by India (2.8 billion) and the US (1.95 billion).
- Americans bought about 5.7 pairs per person in 2025, the Chinese about 3.4 and Indians about 1.9. North America averages 4.6 pairs per person and Africa 1.6.
- US households spent about $62 per pair they bought in 2025, against an average import value of about $14 a pair at the border.
- Market size, production and trade are different things: the US spent $116 billion on footwear in 2024, imported about $28 billion and made about 25 million pairs.
What I noticed while putting this together
When I searched for footwear market size by country, almost every result led to a paywalled research report. The few free numbers didn’t agree with each other. India alone shows up as $10.9 billion in one commercial summary for 2022 and $20.67 billion in a government statement for 2025. That isn’t growth; it’s two different methods.
So I went to national accounts. Statistics offices measure household spending on footwear as part of GDP, under an international category called COICOP 03.2. Eurostat publishes it for every EU country, the OECD for the UK, Canada and Mexico, and the BEA for the US. I pulled all of them, converted to dollars at the Federal Reserve’s 2024 average rates and divided by population.
Two things surprised me. The first was how dominant the US is: one country spends more on shoes than all 27 EU countries put together. The second was Romania. Eurostat’s provisional 2024 figure puts Romanian footwear spending at EUR 6.2 billion, up 85% since 2019 and higher than Poland’s. I checked the full series and Romania’s clothing spending too, and both rise steadily, so I’ve kept it as published but flagged it.
The real gap is Asia. China, India, Japan and Brazil are huge shoe markets, but none publishes footwear spending in its national accounts. For them, the honest measure is pairs bought, which the industry yearbook estimates.
What footwear market data can and can’t tell you
Here is where the evidence stands as of October 2026.
| Question | Evidence status | Why |
|---|---|---|
| Household footwear spending, US, EU, UK, Canada, Mexico | Official data | National accounts, same international category |
| Spending per person | Calculation on official data | Spending divided by official population |
| Comparing countries in dollars | Depends on exchange rates | 2024 Federal Reserve averages; rates move |
| China, India, Japan, Brazil spending | No official figure | Not published separately in national accounts |
| Pairs bought by country | Industry estimate | World Footwear Yearbook, seven countries in the free sample |
| Global market size in dollars | No official figure | Commercial estimates only, with unpublished methods |
| Forecasts | Not used | I show measured years only |
Four kinds of source exist for market size. Pick one to see what it measures and where it falls short.
See what each data source covers and where it falls short
Choose a source to see what it records and how I would read it.
Select a source above.
National accounts. 2015 to 2025. Statistics offices measure what households spend on footwear as part of GDP, using the international COICOP category 03.2. I read them through Eurostat, the OECD and the BEA. How to read it: Official (tier B) and comparable across countries, but only for about 30 mostly rich countries, and the latest year is often provisional. It counts what households spend, not what shops sell to businesses.
World Footwear Yearbook. 2025. APICCAPS estimates the number of pairs each country consumes, for big markets that publish no spending data, such as China, India and Brazil. How to read it: Industry research (tier C). It measures pairs, not money, so it can't be added to the spending figures.
Commercial research. 2022 to 2027. Firms such as MarketLine and Statista sell market-size estimates for most countries. How to read it: Methods are not public and the figures are paywalled or partly shown. I show the few free figures I found, labelled, and don't rank with them.
Government statements. 2025. Some governments quote a market size in speeches or blogs, such as India's $20.67 billion for 2025. How to read it: An official voice, but often without a stated method or source, and not part of national accounts.
15 footwear market size statistics you can cite
Each card has one number, one sentence of context and its source. “Copy text” opens a box with the sentence, the source and a link back here. Please cite the original source for any single statistic. Cards marked E are my calculations, and the method is on the card or in the dataset.
US households spent $116.1 billion on footwear in 2024 and $121.2 billion in 2025, up 4.4% (BEA personal consumption expenditures).
Copy text
$116.1B US household footwear spending, 2024: US households spent $116.1 billion on footwear in 2024 and $121.2 billion in 2025, up 4.4% (BEA personal consumption expenditures). Source: BEA (via FRED) (DFTWRC1A027NBEA). Via UrbanStyle Footwear: https://urbanstylefootwear.com/footwear-market-size-by-country/
Households in the 27 EU countries spent EUR 75.3 billion on footwear in 2024, about $81.4 billion at the 2024 exchange rate (Eurostat; conversion my calculation).
Copy text
EUR 75.3B EU household footwear spending, 2024: Households in the 27 EU countries spent EUR 75.3 billion on footwear in 2024, about $81.4 billion at the 2024 exchange rate (Eurostat; conversion my calculation). Source: Eurostat nama_10_cp18 (nama_10_cp18, CP032, CP_MEUR). Via UrbanStyle Footwear: https://urbanstylefootwear.com/footwear-market-size-by-country/
The US spent about 1.4 times as much on footwear as the whole EU in 2024: $116.1 billion against about $81.4 billion (my calculation from BEA, Eurostat and Federal Reserve rates).
Copy text
1.4x US vs EU footwear spending: The US spent about 1.4 times as much on footwear as the whole EU in 2024: $116.1 billion against about $81.4 billion (my calculation from BEA, Eurostat and Federal Reserve rates). Source: UrbanStyle calculation. Via UrbanStyle Footwear: https://urbanstylefootwear.com/footwear-market-size-by-country/
German households spent EUR 16.9 billion on footwear in 2024, about $18.3 billion, the most in Europe, ahead of the UK at about $15.5 billion (Eurostat, OECD; conversions my calculation).
Copy text
$18.3B Germany, Europe's largest footwear market: German households spent EUR 16.9 billion on footwear in 2024, about $18.3 billion, the most in Europe, ahead of the UK at about $15.5 billion (Eurostat, OECD; conversions my calculation). Source: UrbanStyle calculation. Via UrbanStyle Footwear: https://urbanstylefootwear.com/footwear-market-size-by-country/
Americans spent about $341 each on footwear in 2024, against about $181 in the EU and $224 in the UK (my calculation from national accounts and population).
Copy text
$341 US footwear spending per person: Americans spent about $341 each on footwear in 2024, against about $181 in the EU and $224 in the UK (my calculation from national accounts and population). Source: UrbanStyle calculation. Via UrbanStyle Footwear: https://urbanstylefootwear.com/footwear-market-size-by-country/
Belgians spent about $297 each on footwear in 2024, the most in Western Europe, against $219 in Germany and $119 in France (my calculation from Eurostat).
Copy text
$297 per person in Belgium: Belgians spent about $297 each on footwear in 2024, the most in Western Europe, against $219 in Germany and $119 in France (my calculation from Eurostat). Source: UrbanStyle calculation. Via UrbanStyle Footwear: https://urbanstylefootwear.com/footwear-market-size-by-country/
China consumed about 4,817 million pairs of shoes in 2025, India 2,772 million and the US 1,950 million (World Footwear Yearbook 2026).
Copy text
4,817M pairs consumed in China, 2025: China consumed about 4,817 million pairs of shoes in 2025, India 2,772 million and the US 1,950 million (World Footwear Yearbook 2026). Source: World Footwear Yearbook 2026. Via UrbanStyle Footwear: https://urbanstylefootwear.com/footwear-market-size-by-country/
The US consumed about 5.7 pairs per person in 2025, China 3.4 and India 1.9 (my calculation from the Yearbook and World Bank population).
Copy text
5.7 pairs per American per year: The US consumed about 5.7 pairs per person in 2025, China 3.4 and India 1.9 (my calculation from the Yearbook and World Bank population). Source: UrbanStyle calculation. Via UrbanStyle Footwear: https://urbanstylefootwear.com/footwear-market-size-by-country/
North Americans bought about 4.6 pairs of shoes per person in 2025, Europeans 4.1, Asians 2.6 and Africans 1.6 (World Footwear Yearbook 2026).
Copy text
4.6 pairs per person in North America: North Americans bought about 4.6 pairs of shoes per person in 2025, Europeans 4.1, Asians 2.6 and Africans 1.6 (World Footwear Yearbook 2026). Source: World Footwear Yearbook 2026. Via UrbanStyle Footwear: https://urbanstylefootwear.com/footwear-market-size-by-country/
Dividing US footwear spending in 2025 ($121.15 billion, BEA) by pairs consumed (1,950 million, Yearbook) gives about $62 a pair (my calculation).
Copy text
about $62 US spending per pair: Dividing US footwear spending in 2025 ($121.15 billion, BEA) by pairs consumed (1,950 million, Yearbook) gives about $62 a pair (my calculation). Source: UrbanStyle calculation. Via UrbanStyle Footwear: https://urbanstylefootwear.com/footwear-market-size-by-country/
UK footwear spending fell 23.3% in 2020, the EU's 16.7% and the US's 11.4%; all three were above 2019 levels by 2022 (my calculation from national accounts).
Copy text
-23% UK footwear spending in 2020: UK footwear spending fell 23.3% in 2020, the EU's 16.7% and the US's 11.4%; all three were above 2019 levels by 2022 (my calculation from national accounts). Source: UrbanStyle calculation. Via UrbanStyle Footwear: https://urbanstylefootwear.com/footwear-market-size-by-country/
US household footwear spending rose from $81.0 billion in 2015 to $121.2 billion in 2025, up about 50% in current dollars (BEA; change my calculation).
Copy text
+50% US footwear spending, 2015 to 2025: US household footwear spending rose from $81.0 billion in 2015 to $121.2 billion in 2025, up about 50% in current dollars (BEA; change my calculation). Source: UrbanStyle calculation. Via UrbanStyle Footwear: https://urbanstylefootwear.com/footwear-market-size-by-country/
Romania's footwear spending rose 85% in euros between 2019 and 2024, to EUR 6.2 billion, the fastest growth among the 31 countries here; the 2024 figure is provisional (Eurostat; change my calculation).
Copy text
+85% Romania, 2019 to 2024: Romania's footwear spending rose 85% in euros between 2019 and 2024, to EUR 6.2 billion, the fastest growth among the 31 countries here; the 2024 figure is provisional (Eurostat; change my calculation). Source: Eurostat nama_10_cp18 (nama_10_cp18, CP032, CP_MEUR). Via UrbanStyle Footwear: https://urbanstylefootwear.com/footwear-market-size-by-country/
India's textiles minister put the Indian footwear market at $20.67 billion in 2025, with the average Indian buying about 2 pairs a year (PIB). India publishes no national-accounts footwear figure.
Copy text
$20.67B India footwear market, 2025 (government): India's textiles minister put the Indian footwear market at $20.67 billion in 2025, with the average Indian buying about 2 pairs a year (PIB). India publishes no national-accounts footwear figure. Source: Government of India (PIB), May 2026. Via UrbanStyle Footwear: https://urbanstylefootwear.com/footwear-market-size-by-country/
Of the countries I checked, 31 publish household footwear spending in national accounts available through Eurostat, the OECD or the BEA. China, India, Japan and Brazil are not among them (my count).
Copy text
31 countries with official footwear spending: Of the countries I checked, 31 publish household footwear spending in national accounts available through Eurostat, the OECD or the BEA. China, India, Japan and Brazil are not among them (my count). Source: UrbanStyle calculation. Via UrbanStyle Footwear: https://urbanstylefootwear.com/footwear-market-size-by-country/
Which countries have the largest footwear markets?
Short answer. By household spending in 2024: 1. United States $116.1 billion, 2. Germany $18.3 billion, 3. UK $15.5 billion, 4. Italy $10.9 billion, 5. Spain $8.6 billion, 6. France $8.2 billion, then Canada, Mexico and Romania at about $7 billion each.
This ranking covers the 31 countries that publish footwear spending in their national accounts. It is what households paid for shoes in shops and online, including sales taxes.
Embed this chart
<figure style="margin:0"><a href="https://urbanstylefootwear.com/footwear-market-size-by-country/"><img src="https://urbanstylefootwear.com/wp-content/uploads/2026/10/usf-footwear-market-size-by-country-2024.png" alt="Bar chart of 2024 footwear spending: US $116 billion, Germany $18.3 billion, UK $15.5 billion, Italy $10.9 billion" width="800" style="max-width:100%;height:auto"></a><figcaption>Source: UrbanStyle Footwear, based on BEA, Eurostat and OECD national accounts (UrbanStyle conversion). <a href="https://urbanstylefootwear.com/footwear-market-size-by-country/">Footwear Market Size by Country</a></figcaption></figure>Click the code, press Ctrl+C (Cmd+C on Mac), and paste it into any web page. Please keep the attribution link.
View as table
| Rank | Country | Footwear spending 2024, USD billion | National currency, million | Currency |
|---|---|---|---|---|
| 1 | United States | 116.06 | 116,061.0 | USD |
| 2 | Germany | 18.27 | 16,888.0 | EUR |
| 3 | United Kingdom | 15.49 | 12,116.0 | GBP |
| 4 | Italy | 10.89 | 10,064.4 | EUR |
| 5 | Spain | 8.57 | 7,921.0 | EUR |
| 6 | France | 8.15 | 7,533.2 | EUR |
| 7 | Canada | 7.15 | 9,794.0 | CAD |
| 8 | Mexico | 6.71 | 122,878.5 | MXN |
| 9 | Romania | 6.68 | 6,170.3 | EUR |
| 10 | Netherlands | 3.89 | 3,597.0 | EUR |
| 11 | Poland | 3.88 | 3,589.1 | EUR |
| 12 | Belgium | 3.51 | 3,243.7 | EUR |
The full table has all 31, with spending in the local currency, in dollars, per person and the change since 2019. Filter it by region.
| # | Country | 2024, local currency (M) | 2024, $B | $ per person | Change since 2019 |
|---|---|---|---|---|---|
| 1 | United States | USD 116,061 | 116.06 | 341 | +26.3% |
| 2 | Germany * | EUR 16,888 | 18.27 | 219 | +2.8% |
| 3 | United Kingdom | GBP 12,116 | 15.49 | 224 | +14.5% |
| 4 | Italy | EUR 10,064 | 10.89 | 185 | -11.9% |
| 5 | Spain | EUR 7,921 | 8.57 | 176 | +2.4% |
| 6 | France | EUR 7,533 | 8.15 | 119 | +1.5% |
| 7 | Canada | CAD 9,794 | 7.15 | 173 | +20.4% |
| 8 | Mexico * | MXN 122,878 | 6.71 | 51 | +15.7% |
| 9 | Romania * | EUR 6,170 | 6.68 | 350 | +84.7% |
| 10 | Netherlands | EUR 3,597 | 3.89 | 217 | +17.1% |
| 11 | Poland | EUR 3,589 | 3.88 | 106 | -4.5% |
| 12 | Belgium | EUR 3,244 | 3.51 | 297 | +22.3% |
| 13 | Austria * | EUR 2,060 | 2.23 | 243 | +11.5% |
| 14 | Portugal * | EUR 1,994 | 2.16 | 203 | -2.8% |
| 15 | Greece * | EUR 1,693 | 1.83 | 177 | +2.9% |
| 16 | Denmark | EUR 1,451 | 1.57 | 263 | +18.8% |
| 17 | Sweden | EUR 1,273 | 1.38 | 130 | -9.6% |
| 18 | Czechia | EUR 1,235 | 1.34 | 123 | +6.8% |
| 19 | Ireland * | EUR 1,227 | 1.33 | 248 | +59.9% |
| 20 | Finland | EUR 1,031 | 1.12 | 199 | +24.1% |
| 21 | Slovakia | EUR 839 | 0.91 | 167 | +24.3% |
| 22 | Hungary | EUR 689 | 0.75 | 78 | -3.9% |
| 23 | Croatia * | EUR 659 | 0.71 | 185 | +74.2% |
| 24 | Bulgaria | EUR 493 | 0.53 | 83 | +76.0% |
| 25 | Lithuania | EUR 460 | 0.50 | 172 | +15.5% |
| 26 | Slovenia | EUR 388 | 0.42 | 198 | +27.8% |
| 27 | Cyprus | EUR 237 | 0.26 | 266 | +51.5% |
| 28 | Latvia | EUR 231 | 0.25 | 133 | +0.8% |
| 29 | Estonia | EUR 200 | 0.22 | 157 | +18.9% |
| 30 | Luxembourg | EUR 178 | 0.19 | 287 | -4.2% |
| 31 | Malta | EUR 126 | 0.14 | 242 | +20.0% |
What you can safely say. “US households spent $116.1 billion on footwear in 2024, more than the 27 EU countries combined, according to national accounts data.” Say the dollar conversions use 2024 average exchange rates.
How much do people spend on shoes per person by country?
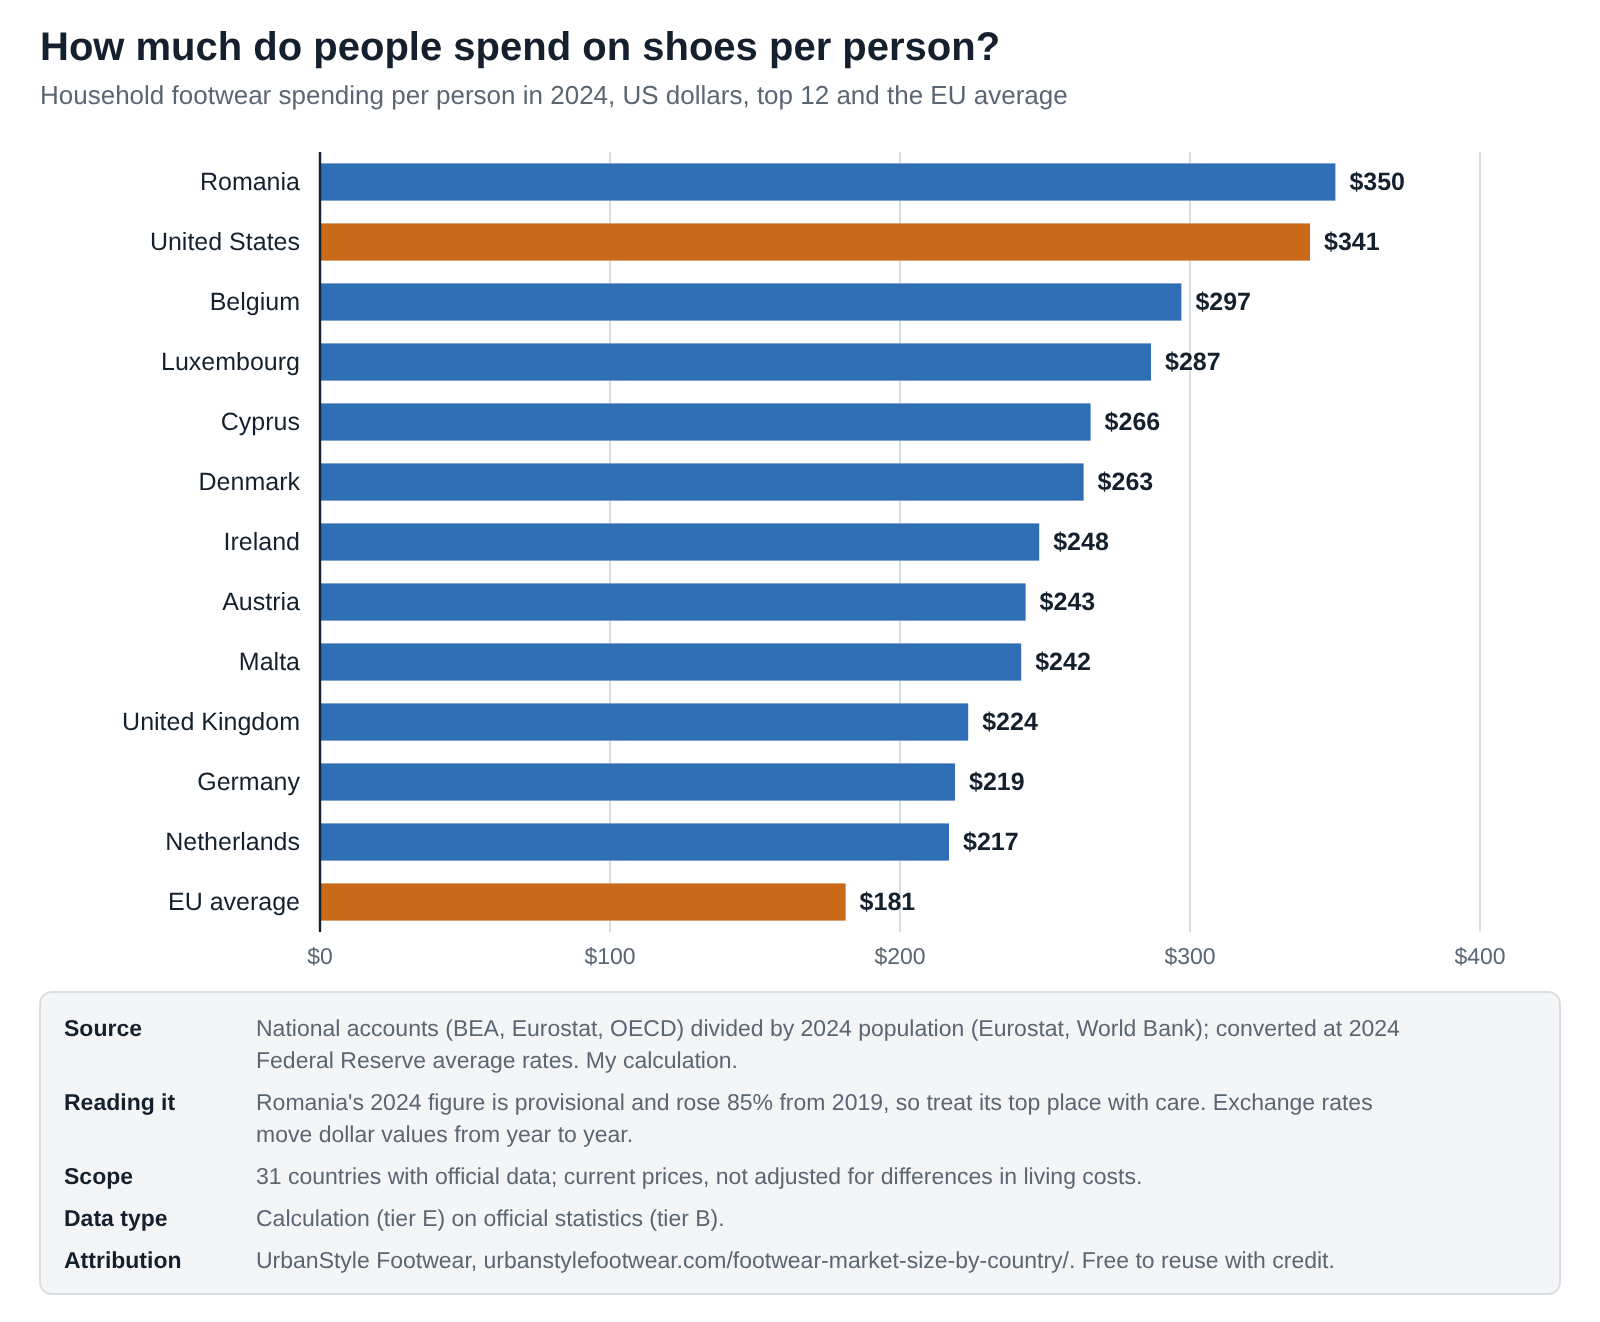
Short answer. In 2024 about $341 per person in the US, $224 in the UK, $219 in Germany and $181 on average in the EU. Within Europe, Belgium ($297) and Luxembourg ($287) are highest on settled figures; Romania’s provisional figure is about $350.
Embed this chart
<figure style="margin:0"><a href="https://urbanstylefootwear.com/footwear-market-size-by-country/"><img src="https://urbanstylefootwear.com/wp-content/uploads/2026/10/usf-footwear-spending-per-person-by-country-2024.png" alt="Bar chart of footwear spending per person in 2024: Romania $350, US $341, Belgium $297, EU average $181" width="800" style="max-width:100%;height:auto"></a><figcaption>Source: UrbanStyle Footwear, based on national accounts and population data (UrbanStyle calculation). <a href="https://urbanstylefootwear.com/footwear-market-size-by-country/">Footwear Market Size by Country</a></figcaption></figure>Click the code, press Ctrl+C (Cmd+C on Mac), and paste it into any web page. Please keep the attribution link.
View as table
| Country | Footwear spending per person 2024, USD |
|---|---|
| Romania | 350 |
| United States | 341 |
| Belgium | 297 |
| Luxembourg | 287 |
| Cyprus | 266 |
| Denmark | 263 |
| Ireland | 248 |
| Austria | 243 |
| Malta | 242 |
| United Kingdom | 224 |
| Germany | 219 |
| Netherlands | 217 |
| European Union (27) | 181 |
Spending per person tells a different story from totals. Mexico is the eighth-largest market but spends about $51 a person. France is the sixth-largest but spends about $119 a person, roughly half of Germany. These are current-price dollars, not adjusted for the cost of living, so a dollar of shoes buys more in some countries than others. For the US detail by age and income, see my footwear spending statistics.
Source: national accounts and population as above. Per-person figures are my calculations (tier E).How has footwear market size changed since 2015?
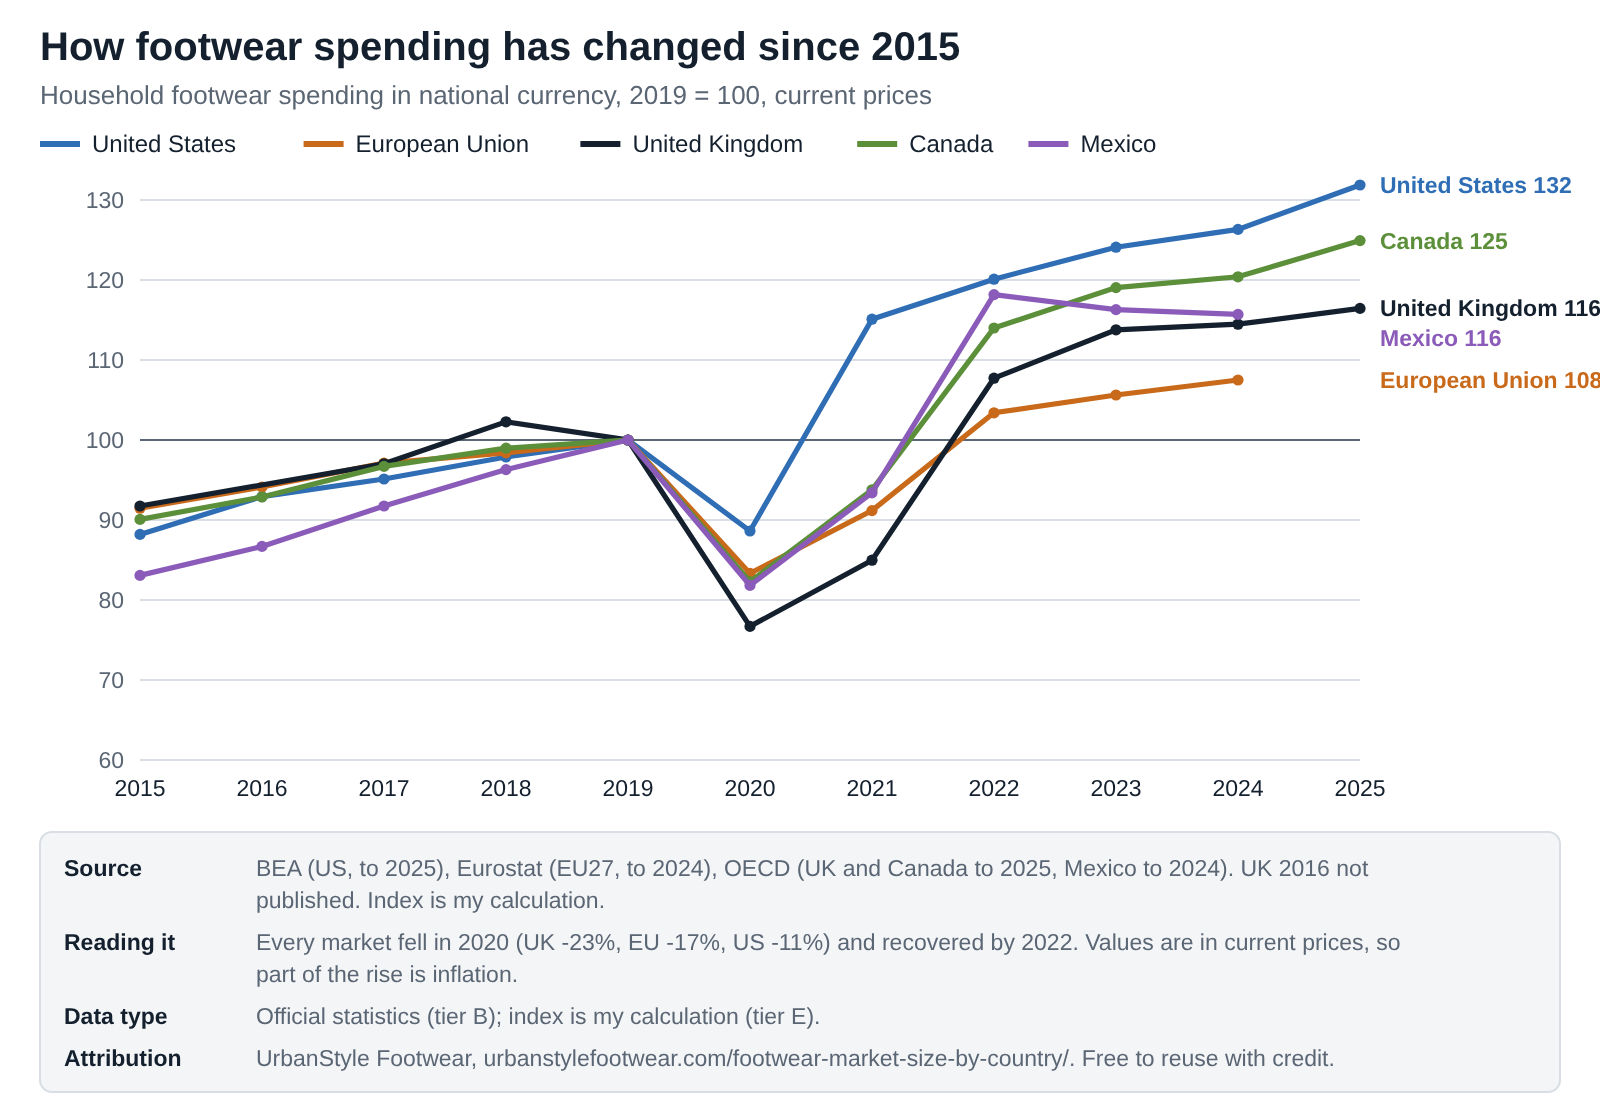
Short answer. All five big Western markets fell sharply in 2020 and recovered by 2022. Against 2019, US spending was up 32% by 2025, Canada’s 25%, the UK’s and Mexico’s about 16% and the EU’s 8% (to 2024), all in current prices.
Embed this chart
<figure style="margin:0"><a href="https://urbanstylefootwear.com/footwear-market-size-by-country/"><img src="https://urbanstylefootwear.com/wp-content/uploads/2026/10/usf-footwear-spending-growth-2015-2025.png" alt="Line chart of footwear spending indexed to 2019: all markets fell in 2020 and recovered by 2022; US 132 in 2025" width="800" style="max-width:100%;height:auto"></a><figcaption>Source: UrbanStyle Footwear, based on BEA, Eurostat and OECD national accounts (UrbanStyle index). <a href="https://urbanstylefootwear.com/footwear-market-size-by-country/">Footwear Market Size by Country</a></figcaption></figure>Click the code, press Ctrl+C (Cmd+C on Mac), and paste it into any web page. Please keep the attribution link.
View as table
| Year | United States | European Union | United Kingdom | Canada | Mexico |
|---|---|---|---|---|---|
| 2015 | 88.2 | 91.5 | 91.8 | 90.1 | 83.1 |
| 2016 | 92.9 | 94.1 | n/a | 92.9 | 86.7 |
| 2017 | 95.1 | 97.1 | 97.0 | 96.7 | 91.7 |
| 2018 | 97.9 | 98.4 | 102.3 | 99.0 | 96.3 |
| 2019 | 100.0 | 100.0 | 100.0 | 100.0 | 100.0 |
| 2020 | 88.6 | 83.3 | 76.7 | 82.3 | 81.8 |
| 2021 | 115.1 | 91.2 | 85.0 | 93.8 | 93.4 |
| 2022 | 120.1 | 103.4 | 107.7 | 114.0 | 118.2 |
| 2023 | 124.1 | 105.6 | 113.8 | 119.1 | 116.3 |
| 2024 | 126.3 | 107.5 | 114.5 | 120.4 | 115.7 |
| 2025 | 131.9 | n/a | 116.5 | 124.9 | n/a |
The US stands out. From $81.0 billion in 2015 it reached $121.2 billion in 2025, up about 50%. Europe grew far more slowly: EU spending was EUR 64.0 billion in 2015 and EUR 75.3 billion in 2024. Some large European markets shrank in euros between 2019 and 2024, including Italy (down 11.9%) and Poland (down 4.5%). None of these figures removes inflation, so real growth was lower everywhere.
Sources: BEA, Eurostat, OECD (tier B). Indexes and changes are my calculations (tier E).How do regions compare?
Short answer. North America spends the most and buys the most pairs per person (4.6). Europe spends less per person and buys about 4.1 pairs each. Asia buys the most pairs in total but about 2.6 per person, and Africa about 1.6.
| Region | Household footwear spending, 2024 | Spending per person | Pairs per person, 2025 |
|---|---|---|---|
| North America (US, Canada, Mexico) | $129.9B | $254 | 4.6 |
| European Union (27 countries) | $81.4B | $181 | 4.1 (Europe) |
| Asia | No official total | n/a | 2.6 |
| Africa | No official total | n/a | 1.6 |
How big are the footwear markets of China, India and Japan?
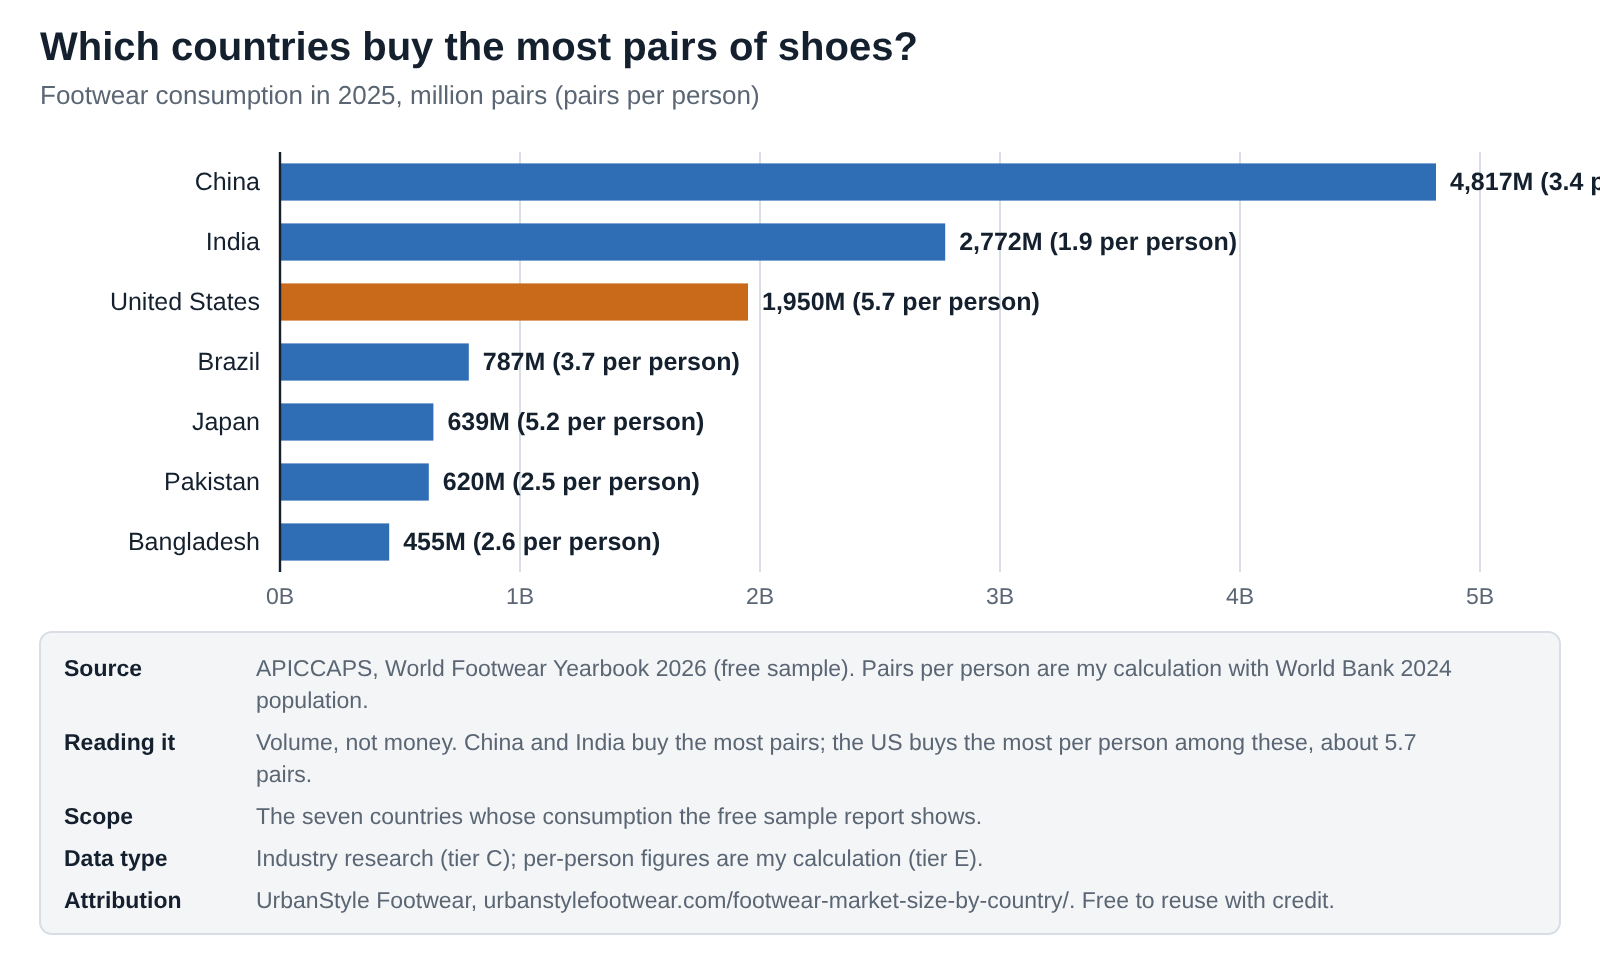
Short answer. In pairs: China about 4,817 million, India 2,772 million, US 1,950 million, Brazil 787 million, Japan 639 million, Pakistan 620 million and Bangladesh 455 million in 2025. None of China, India, Japan or Brazil publishes footwear spending separately.
Embed this chart
<figure style="margin:0"><a href="https://urbanstylefootwear.com/footwear-market-size-by-country/"><img src="https://urbanstylefootwear.com/wp-content/uploads/2026/10/usf-footwear-consumption-pairs-by-country-2025.png" alt="Bar chart of 2025 shoe consumption: China 4,817 million pairs, India 2,772, US 1,950, Brazil 787, Japan 639" width="800" style="max-width:100%;height:auto"></a><figcaption>Source: UrbanStyle Footwear, based on the World Footwear Yearbook 2026. <a href="https://urbanstylefootwear.com/footwear-market-size-by-country/">Footwear Market Size by Country</a></figcaption></figure>Click the code, press Ctrl+C (Cmd+C on Mac), and paste it into any web page. Please keep the attribution link.
View as table
| Country | Pairs consumed 2025, million | Pairs per person |
|---|---|---|
| China | 4,817 | 3.4 |
| India | 2,772 | 1.9 |
| United States | 1,950 | 5.7 |
| Brazil | 787 | 3.7 |
| Japan | 639 | 5.2 |
| Pakistan | 620 | 2.5 |
| Bangladesh | 455 | 2.6 |
Pairs and money tell different stories. China buys about 2.5 times as many pairs as the US, but per person it is 3.4 pairs against 5.7. India buys more pairs than the US in total but 1.9 per person. Dividing US spending by US pairs gives about $62 a pair; nobody publishes the equivalent for China or India.
Source: World Footwear Yearbook 2026 (tier C); World Bank population (tier B). Per-person and per-pair figures are my calculations (tier E).What do commercial estimates say for countries without official data?
For completeness, here are the free figures I found for markets without official spending data. I don’t rank with them, because their methods aren’t published and they disagree.
| Country | Value | Year | Source | Note |
|---|---|---|---|---|
| China | $70.5B | 2022 | MarketLine via Research and Markets | Commercial estimate; method not public |
| India | $10.9B | 2022 | MarketLine via Research and Markets | Commercial estimate; method not public |
| India | $20.67B | 2025 | Government of India (PIB blog) | Stated by the Union Minister of Textiles; underlying source not given |
| Mexico | $6.2B | 2022 | MarketLine via Research and Markets | Close to the official figure for the same year |
| Mexico (official, for comparison) | $6.24B | 2022 | OECD national accounts at the 2022 Fed rate (my conversion) | Official household spending |
The Mexico check is reassuring: MarketLine’s $6.2 billion for 2022 is close to Mexico’s official national-accounts figure for that year. The India figures are not: $10.9 billion and $20.67 billion are three years apart but far too different to be growth alone.
Sources: Research and Markets summary of a MarketLine report (tier D); Government of India PIB blog (tier B, method not stated).Market size vs production vs trade: why they don’t match
Short answer. Market size is what consumers spend at retail prices. Production is pairs made. Trade is shoes crossing borders at factory prices plus freight. They measure different things and must never be added or ranked together.
| Measure | United States | What it counts | Where to find it |
|---|---|---|---|
| Household spending (market size) | $116.1 billion (2024) | Retail spending, including tax | This page |
| Footwear imports | $28.4 billion (2024) | Import value with freight, before duty, brand and store costs | Imports and exports page |
| Production | About 25 million pairs | Shoes made in the country | Producing countries page |
| Consumption in pairs | 1,950 million pairs (2025) | Shoes bought, any origin | This page |
The gap between $28 billion of imports and $116 billion of spending is the journey from factory to shop: duties, the brand’s design and marketing, warehousing, and the store’s rent, staff and margin. I break that down for a single pair in how much it costs to make a shoe.
Sources: BEA (tier B), UN Comtrade (tier B), FDRA (tier C), World Footwear Yearbook 2026 (tier C).Why do footwear market size estimates disagree?
Short answer. They measure different things (consumer spending, retail sales, brand revenue or wholesale value), cover different products (all footwear or only some types), use different years and currencies, and often don’t publish a method.
| Reason | Example from my research | What to do |
|---|---|---|
| Different definitions | Household spending vs retail sales vs wholesale value | Say which one you mean |
| Unpublished methods | India at $10.9 billion (2022) and $20.67 billion (2025) | Prefer sources with a method |
| Currency and year | A euro figure converted at a different year’s rate | State the rate and year |
| Forecasts quoted as fact | Commercial summaries headline 2027 forecasts | Use measured years |
| Mixing measures | Exports or production presented as a market | Keep spending, production and trade apart |
| Combined categories | China reports clothing and footwear retail sales together | Don’t treat a combined figure as footwear |
| Revisions | Germany, Mexico and Romania 2024 values are provisional | Check for later releases |
Who measures footwear market size?
Select a step to see each source and how I use it.
1Shops and householdsRetailers, surveys, card and tax data
Every pair bought is a sale somewhere. Statistics offices combine retail and household survey data to estimate what households spend.
2National statistics officesBEA, ONS, Statistics Canada, INEGI, EU offices
Publish household spending on footwear (COICOP 03.2) in national accounts. This is the backbone of the ranking.
3International databasesEurostat, OECD
Collect the national figures in one format so countries can be compared. I read them directly.
4Industry yearbookAPICCAPS, World Footwear Yearbook
Estimates pairs consumed for big markets without spending data, such as China and India.
5Commercial researchMarketLine, Statista and others
Sell modelled estimates for most countries, with methods that are not public. I show the free figures separately and never rank with them.
How good is the evidence behind footwear market size rankings?
Short answer. Strong for the 31 countries with national accounts, weak elsewhere. Of the 194 rows in this page’s dataset, 37% are official statistics (tier B), 6% are industry research (tier C), 2% are commercial or secondary estimates (tier D) and 56% are my calculations (tier E).
| Evidence tier | Rows | Share |
|---|---|---|
| A Peer-reviewed research | 0 | 0% |
| B Official statistics | 71 | 37% |
| C Industry research | 11 | 6% |
| D Commercial and secondary estimates | 3 | 2% |
| E UrbanStyle calculations | 109 | 56% |
| Total | 194 | 100% |
- Tier B carries the ranking. Every spending figure comes from a statistics office.
- Tier E is conversion and arithmetic, mostly dollar conversions and per-person figures.
- Commercial estimates are kept apart, labelled tier D, and never ranked.
Where other footwear market size articles go wrong
I read the pages that rank for footwear market size searches, mostly research-firm summaries and data portals. Some of these problems I saw directly, and the rest are traps that are easy to fall into. This is not a complete audit of anyone’s work.
- Problem 1Country rankings behind a paywall, with no method you can check.
- Problem 2Forecast years headlined as if measured.
- Problem 3Export or production figures used as market size.
- Problem 4Very different figures for the same country from different firms, with no explanation.
- Problem 5Combined clothing and footwear figures quoted as footwear alone.
- Problem 6Dollar figures with no exchange rate or year stated.
- Problem 7No downloadable data, so nobody can check or reuse the numbers.
How to use footwear market data well
Practical advice for business owners, investors, analysts and writers.
- Start with national accounts wherever they exist. They are free, official and comparable.
- Compare per person as well as totals. Big markets aren’t always rich ones.
- Use pairs for China, India and other markets without official spending data, and say so.
- Treat commercial estimates as ranges, and check them against any official figure you can find.
- State the currency, year and exchange rate with every dollar figure.
- Separate price from volume. Spending rises with prices; pairs show whether people buy more.
Sources and evidence tiers
Evidence hierarchy
- APeer-reviewed research. Not used; market size comes from national accounts and industry data.
- BOfficial statistics. BEA, Eurostat, OECD national accounts, Federal Reserve exchange rates, Eurostat and World Bank population, and a Government of India statement.
- CIndustry research. The World Footwear Yearbook 2026.
- DCommercial estimates. A MarketLine report summary, shown separately.
- ECalculations. Conversions, per-person figures, changes and indexes, with the method stated.
Primary versus secondary data
Primary source: the organisation that collected the data. Secondary source: an article summarising someone else’s data. Where I could only read a secondary source, the table says so.
Source table
| Source | Year | Sample | Geography | Finding used | Tier | Series ID | Primary source |
|---|---|---|---|---|---|---|---|
| US Bureau of Economic Analysis, personal consumption expenditures on footwear, via FRED series DFTWRC1A027NBEA (updated September 30, 2026) | 2025 | US national accounts | United States | US household footwear spending $116.061 billion in 2024 and $121.150 billion in 2025 | B | DFTWRC1A027NBEA | FRED series |
| Eurostat, "Household final consumption expenditure by purpose (COICOP 2018)", dataset nama_10_cp18, footwear (CP032), current prices (updated July 30, 2026; read October 26, 2026) | 2024 | National accounts of the 27 EU member states | European Union | Household spending on footwear in million euros, 2015 to 2024; EU27 EUR 75,257.7 million in 2024 | B | nama_10_cp18, CP032, CP_MEUR | Eurostat data browser |
| OECD, "Annual household final consumption expenditure by purpose (COICOP)", DSD_NAMAIN10@DF_TABLE5_T501, footwear (CP032), current prices (read October 26, 2026) | 2025 | National accounts reported to the OECD | United Kingdom, Canada, Mexico, United States | Footwear spending in national currency, 2015 to 2025: UK GBP 12,116 million (2024); Canada CAD 9,794 million (2024); Mexico MXN 122,878 million (2024) | B | DF_TABLE5_T501, CP032 | OECD Data Explorer |
| Board of Governors of the Federal Reserve System, G.5A Foreign Exchange Rates (Annual), released January 5, 2026 | 2026 | Annual average exchange rates | Global | 2024 averages: USD 1.0820 per euro, USD 1.2781 per pound, CAD 1.3699 and MXN 18.3062 per dollar | B | G.5A | Federal Reserve G.5A |
| Eurostat population on 1 January 2024 (demo_pjan) and World Bank population 2024 (SP.POP.TOTL, updated October 8, 2026) | 2024 | Official population estimates | Global | Populations used for per-person figures | B | demo_pjan; SP.POP.TOTL | World Bank indicator |
| APICCAPS, World Footwear Yearbook 2026, free sample report (PDF) | 2026 | Industry yearbook, 2025 data | Global | Footwear consumption in 2025: China 4,817, India 2,772, United States 1,950, Brazil 787, Japan 639, Pakistan 620 and Bangladesh 455 million pairs; per capita North America 4.6, Europe 4.1, Asia 2.6, Africa 1.6 pairs | C | n/a | Yearbook sample (PDF) |
| Press Information Bureau (Government of India) blog by the Union Minister of Textiles (May 5, 2026) | 2026 | Government statement | India | The Indian footwear market was valued at $20.67 billion in 2025; the average Indian buys about 2 pairs a year | B | n/a | PIB blog |
| Research and Markets, "Top 5 Emerging Countries Footwear Retail Market" (MarketLine, August 2023), free summary | 2023 | Commercial market research report summary | Brazil, China, India, Mexico, South Africa | Footwear retail market value in 2022: China $70,530.4 million, India $10,911.9 million, Mexico $6,169.8 million; forecasts to 2027 | D | Report 5739256 | Research and Markets page |
| UrbanStyle Footwear calculations on this page | 2026 | Arithmetic on figures from the sources above; method stated | Global | Dollar conversions, rankings, per-person spending, changes and indexes on this page | E | n/a | Methodology |
Methodology and limitations
How I built this page. I took household final consumption expenditure on footwear (COICOP 03.2) in current prices from Eurostat’s nama_10_cp18 dataset for the 27 EU countries (updated July 30, 2026), from the OECD’s household consumption by purpose table for the UK, Canada and Mexico, and from the BEA for the US (updated September 30, 2026). I converted 2024 values to dollars at the Federal Reserve’s 2024 annual average rates and divided by 2024 population from Eurostat (January 1) and the World Bank. Pairs consumed come from the World Footwear Yearbook 2026 free sample. Everything was read on October 26, 2026.
Choices I made. I rank only official household spending, never commercial estimates, exports or production. 2024 is the common year, because it is the latest year for most EU countries; 2025 is shown where published. The 27 member states add up to EUR 75.5 billion, 0.3% above Eurostat’s EU total of EUR 75.3 billion; I use Eurostat’s total for the EU.
Limitations you should know about
- Coverage. 31 countries publish this figure. Most of Asia, Africa and Latin America don’t.
- Current prices. Nothing is adjusted for inflation or for differences in living costs.
- Exchange rates. Dollar values move with currencies. At 2025 rates, euro figures would be about 4.5% higher in dollars.
- Provisional figures. Germany, Austria, Portugal, Greece, Croatia, Ireland, Romania and Mexico have provisional 2024 values.
- Romania. Its spending rose 85% from 2019 to 2024; I show it as published.
- US vintages. The BEA revised 2024 to $116.061 billion; the OECD table still shows an earlier $116.174 billion. I use the BEA figure.
Data freshness
| Date | Change |
|---|---|
| October 26, 2026 | First publication. Eurostat, OECD and BEA national accounts to 2024 or 2025, Federal Reserve exchange rates, World Footwear Yearbook 2026 consumption. Downloadable dataset, four charts and calculations with stated methods. |
| When Eurostat publishes 2025 | Planned update of the ranking. |
| January 2027 | Next scheduled full review. |
Last full source review: October 26, 2026. Next scheduled review: January 2027.
Corrections. If you spot an error or have better data, especially official footwear spending for a country not listed, email info@urbanstylefootwear.com with the subject “Data correction”. How we review products is explained in our methodology.
For journalists and researchers
You can use the statistics and charts on this page with credit to UrbanStyle Footwear. Wherever you can, please cite the original source printed with each statistic. My own calculations are marked tier E and can be cited to me.
A sentence you can use. “US households spent $116.1 billion on footwear in 2024, about 1.4 times as much as all 27 EU countries combined, and about $341 per person against $181 in the EU.” (Sources: BEA, Eurostat; conversions by UrbanStyle Footwear at 2024 Federal Reserve exchange rates)
Media kit
All figures with value, unit, geography, segment, basis, period, source and evidence tier.
Four charts with source, scope and data type printed on each image. SVG versions are under each chart above.
The 15 citable statistics on one printable PDF.
Every source with year, sample, geography, tier, series ID and link.
All 31 countries: spending in local currency and dollars, per person, change since 2019 and source.
Ready-made citations below. Media and research enquiries go to info@urbanstylefootwear.com.
Cite this page
Suggested citation
UrbanStyle Footwear. “Footwear Market Size by Country: Global Rankings and Revenue.” Updated October 26, 2026. https://urbanstylefootwear.com/footwear-market-size-by-country/
APA style
Vahith, A. (2026, October 26). Footwear market size by country: global rankings and revenue. UrbanStyle Footwear. https://urbanstylefootwear.com/footwear-market-size-by-country/
Link (HTML)
<a href="https://urbanstylefootwear.com/footwear-market-size-by-country/">Footwear Market Size by Country by UrbanStyle Footwear</a>Click any citation, then press Ctrl+C (Cmd+C on Mac) to copy it.
For individual statistics, UrbanStyle recommends citing the original source listed in the source table whenever possible.
Data requests. Data correction or dataset request: info@urbanstylefootwear.com
Frequently asked questions
Which country has the largest footwear market?
The United States. US households spent $116.1 billion on footwear in 2024 and $121.2 billion in 2025, by BEA figures, more than the 27 EU countries combined. China consumes more pairs (about 4.8 billion a year) but publishes no official spending figure. See the ranking.
What is the largest footwear market in Europe?
Germany, with EUR 16.9 billion of household footwear spending in 2024 (about $18.3 billion), followed by the UK (about $15.5 billion), Italy, Spain and France (Eurostat, OECD).
How big is the global footwear market?
About $570 billion a year by my estimate, with a range of $412 billion to $741 billion; research firms put 2026 between $401 billion and $704 billion. Official spending for these 31 countries adds up to about $227 billion in 2024. The full estimate, method and checks are on my global footwear market size page.
How much does the average person spend on shoes per year?
In 2024, about $341 in the US, $224 in the UK and $181 in the EU on average, by national accounts. See spending per person and my footwear spending statistics for the US detail.
Which country spends the most on shoes per person?
Among the 31 countries with official data, Romania (about $350 a person in 2024, on a provisional figure) and the US (about $341) lead, followed by Belgium ($297) and Luxembourg ($287) (my calculation from national accounts).
How many pairs of shoes do people buy per year?
About 5.7 pairs per person in the US, 3.4 in China and 1.9 in India in 2025, by my calculation from the World Footwear Yearbook. By region, North America averages 4.6 pairs per person and Africa 1.6.
How big is the footwear market in China?
China consumed about 4,817 million pairs in 2025, the most of any country (World Footwear Yearbook 2026). It publishes retail sales for clothing, footwear and textiles together, not footwear alone. One commercial estimate put China’s footwear retail market at $70.5 billion in 2022.
How big is the footwear market in India?
India’s textiles minister put it at $20.67 billion in 2025. India consumed about 2,772 million pairs that year, second only to China (World Footwear Yearbook 2026). An older commercial estimate gave $10.9 billion for 2022, so estimates differ widely.
Is the footwear market growing?
In money terms, yes. US spending rose 4.4% in 2025 and about 50% since 2015 in current dollars; EU spending rose 7.5% from 2019 to 2024. These figures include price rises, so real growth is lower. See growth since 2015.
What is the difference between footwear market size and footwear imports?
Market size here is what households spend on shoes at retail prices. Imports measure shoes crossing the border at factory prices plus freight. US households spent $116 billion on footwear in 2024, while US footwear imports were about $28 billion. See my imports and exports page.
Why don't you rank countries by commercial market estimates?
Because their methods aren’t public and different firms give very different numbers for the same country, such as India at $10.9 billion (2022) or $20.67 billion (2025). I rank only official household spending and show other estimates separately, labelled.
Are these figures adjusted for inflation?
No. They are in current prices. Changes over time include price rises, and the dollar conversions use 2024 average exchange rates, which also move.
Why does Romania's footwear spending look so high?
Eurostat’s provisional 2024 figure for Romania is EUR 6.2 billion, up 85% from 2019, which puts it above Poland. It may be revised; I show it as published and flag it.
Can I use these statistics and download the data?
Yes, with credit to UrbanStyle Footwear, and cite the original source for any single statistic where you can. The CSV, XLSX, charts and a printable list of key statistics are in the media kit, with citation formats.