
World’s Largest Footwear-Producing Countries: Production Rankings
My great-grandfather made shoes, so “where are shoes actually made?” is a question I care about more than most. It is also one most rankings answer wrongly, by listing exporters. This page ranks countries by the number of pairs they make, using the footwear industry’s yearbook for 2025, then checks it against national figures, company filings and trade data. Exports, consumption and production stay in separate columns, and the data is free to download.
Six headline footwear production numbers. Select one to see what it counts and where it comes from.
Select a topic above, for example “Top three”, to see what the number counts.
13.7 billionChina made 13,660 million pairs in 2025, 55.6% of all the shoes made in the world (World Footwear Yearbook 2026, tier C).
3.0 billionIndia made about 3 billion pairs, 12.2% of world output, and its own people bought about 2.8 billion of them (Yearbook 2026, tier C).
24.6 billionThe world made about 24.6 billion pairs in 2025, up just 0.1% on a revised 24.5 billion in 2024 (Yearbook 2026, tier C). That is about three pairs for every person alive.
74.5%China, India and Vietnam together made 74.5% of the world's shoes, about three in every four pairs (my calculation from the Yearbook, tier E).
66% vs 9%China exported about 66% of the pairs it made in 2025. India exported about 9%, so the second-largest producer is a small exporter (my calculation, tier E).
16% ChinaChina made only about 16% of NIKE Brand footwear in fiscal 2026. Vietnam made 52% and Indonesia 27% (Nike 10-K, tier B).
Each number names its source and evidence tier. All fifteen of my citable statistics are further down this page.
Footwear production by country at a glance
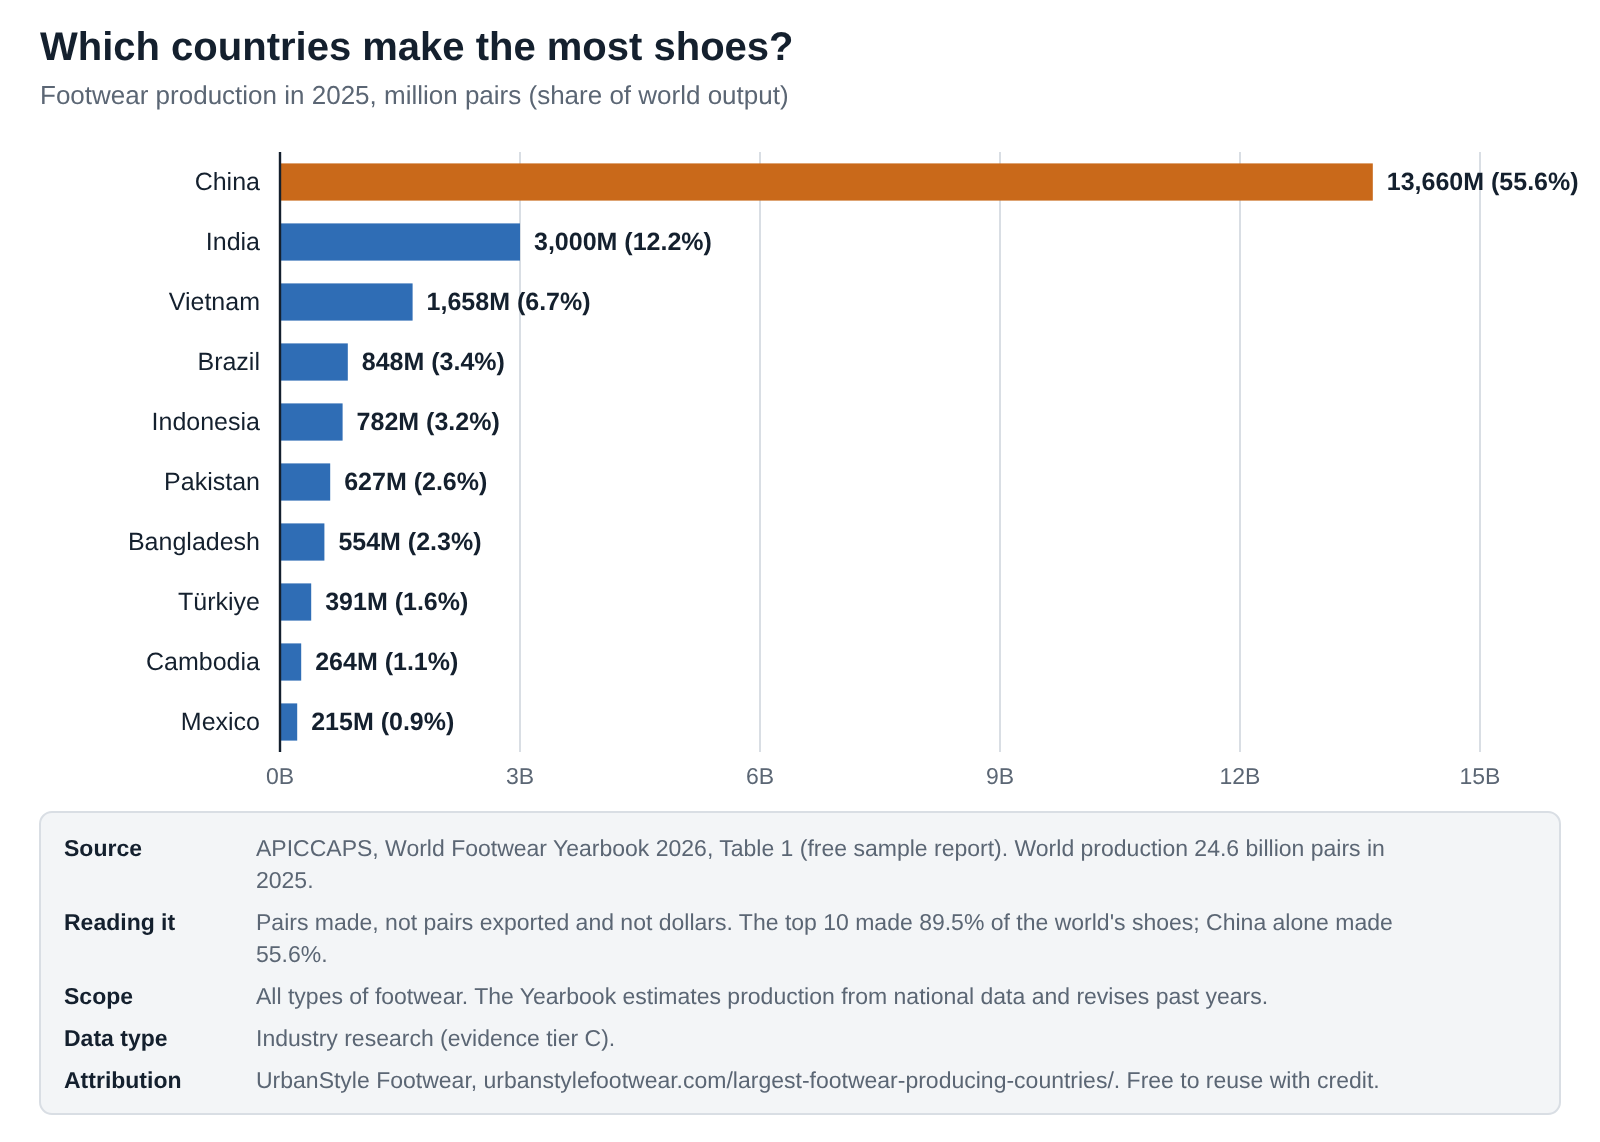
Quick answer. China is the world’s largest footwear producer, making 13,660 million pairs in 2025, 55.6% of the world’s 24.6 billion pairs. India is second with about 3,000 million pairs (12.2%) and Vietnam third with 1,658 million (6.7%). Brazil, Indonesia, Pakistan, Bangladesh, Türkiye, Cambodia and Mexico complete the top 10, which together make 89.5% of all shoes. Figures are pairs produced, from the World Footwear Yearbook 2026, not exports.
This is the production page in my footwear industry research. For shoes crossing borders, see footwear imports and exports by country. For the US market, see US footwear market statistics, and for everything else, the footwear statistics hub.
Key findings
- The world made about 24.6 billion pairs of shoes in 2025, up just 0.1% on a revised 24.5 billion in 2024. That is roughly three pairs for every person on Earth.
- China made 13,660 million pairs, 55.6% of the total, more than four times India. Its share has stayed around 54% to 56% since 2019.
- India is the second-largest producer at about 3 billion pairs (12.2%), and Vietnam third at 1,658 million (6.7%). China, India and Vietnam together make 74.5% of the world’s shoes.
- The top 10 producers make 89.5% of all shoes and Asia makes 88.7%. Brazil (848 million), Türkiye (391 million) and Mexico (215 million) are the only top-10 producers outside Asia.
- India and Vietnam are the clearest risers. Between 2019 and 2025 India’s share went from 10.7% to 12.2% and Vietnam’s from 5.8% to 6.7%. Indonesia’s fell from 5.1% to 3.2%.
- Big producers split into two kinds. China exports about 66% of what it makes and Cambodia about 96%, while India exports about 9% and Pakistan about 3%. India’s own people bought about 2.8 billion pairs.
- Big brands lean on Vietnam, not China. Nike made about 52% of its footwear in Vietnam, 27% in Indonesia and only 16% in China in fiscal 2026; adidas reports 41%, 31% and 14%.
- The West makes very few shoes. Italy made 118.4 million pairs in 2025 and the US about 25 million, against US consumption of about 1.95 billion pairs.
- Italy exported more pairs (205 million) than it made (118.4 million), which shows why export rankings can’t stand in for production rankings.
- Production figures are estimates and get revised. The Yearbook raised its 2024 world total from 23.9 to 24.5 billion pairs between editions.
What I noticed while putting this together
I expected production data to be as easy as trade data. It isn’t. Customs offices record every shipment, but very few governments count how many pairs their factories make. So nearly every production ranking you’ll see, including this one, rests on one source: the World Footwear Yearbook, published each year by APICCAPS, the Portuguese footwear association. I used its 2026 edition for 2025.
That made checking it the main job. I looked for any country that publishes its own count. Italy’s manufacturers’ association gives 118.4 million pairs. Brazil’s association says one state, Ceará, made 206.8 million pairs, 24.4% of the national total, which works out to about 848 million, exactly the Yearbook’s figure. India’s textiles minister gives about 2.9 billion. Mexico’s reported 2024 output of about 214 million sits next to the Yearbook’s 215 million for 2025. Where I could check, the Yearbook held up.
Two things surprised me. The first was India. It is the world’s second-largest producer, yet it exports only about 9% of the pairs it makes, because Indians buy almost as many shoes (about 2.8 billion pairs) as the country produces. The second was Italy, which exported more pairs than it made. That is re-export at work, and it is exactly why I kept exports out of the ranking.
The last surprise was in Nike’s annual report. China makes 55.6% of the world’s shoes but only about 16% of Nike’s. The shoes most people picture when they think “sneakers” mostly come from Vietnam and Indonesia.
What footwear production data can and can’t tell you
Here is where the evidence stands as of October 2026.
| Question | Evidence status | Why |
|---|---|---|
| Top 10 producers by pairs, 2025 | Good estimate | One consistent industry method, checked against national figures |
| World production total | Good estimate | 24.6 billion pairs; past years get revised |
| Countries outside the top 10 | Patchy | Full tables are in the paid Yearbook; national figures exist for a few, such as Italy |
| Production history | Edition by edition | Each edition revises earlier years, so the series isn’t perfectly consistent |
| Share of production exported | Calculation | Pairs exported divided by pairs made; Vietnam’s two figures are identical in the Yearbook |
| Where big brands make their shoes | Company filings | Nike’s annual 10-K gives exact shares; adidas’s come through a news report |
| Production value in dollars by country | Not comparable | No common source; I don’t rank by value |
Four kinds of source carry this page. Pick one to see what it records and where it falls short.
See what each data source covers and where it falls short
Choose a source to see what it records and how I would read it.
Select a source above.
World Footwear Yearbook. 2025 data, published 2026. APICCAPS, the Portuguese footwear association, estimates production, consumption and trade for every major country each year. It is the only source that ranks all countries by pairs made on one method. How to read it: Industry research (tier C). It is an estimate, not a census, and it gets revised: 2024 went from 23.9 to 24.5 billion pairs between editions. The full book is paid; I used the free sample and trade press summaries.
National associations. 2024 and 2025. Italy's Assocalzaturifici, Brazil's Abicalçados and Mexico's industry figures count factories at home, often with jobs and company numbers too. How to read it: Close to the factories (tier C or D), but each counts in its own way and some figures reach me through news reports. Where they exist, they agree with the Yearbook to within a few percent.
Government statements. 2025 and 2026. India's textiles ministry gives about 2.9 billion pairs a year. Vietnam's state media gives over 1.4 billion pairs. How to read it: Official voices, but India's figure repeats the Yearbook's earlier 12.5% of 23.9 billion, and Vietnam's has no stated year. I show both next to the Yearbook rather than replacing it.
Company filings. Nike FY2026, adidas 2025. Brands disclose where their contract factories are. Nike lists 95 footwear factories in 11 countries; Vietnam, Indonesia and China made about 52%, 27% and 16% of its shoes. How to read it: Precise for one company (Nike's 10-K is a regulated filing, tier B), but a brand's supply chain is not a country's output. Big sportswear brands lean on Vietnam far more than the world does.
15 footwear production statistics you can cite
Each card has one number, one sentence of context and its source. “Copy text” opens a box with the sentence, the source and a link back here. Please cite the original source for any single statistic. Cards marked E are my calculations, and the method is on the card or in the dataset.
World footwear production was about 24.6 billion pairs in 2025, up 0.1% on a revised 24.5 billion in 2024 (World Footwear Yearbook 2026).
Copy text
24.6 billion pairs of shoes made worldwide in 2025: World footwear production was about 24.6 billion pairs in 2025, up 0.1% on a revised 24.5 billion in 2024 (World Footwear Yearbook 2026). Source: World Footwear Yearbook 2026 (Tables 1 and 3). Via UrbanStyle Footwear: https://urbanstylefootwear.com/largest-footwear-producing-countries/
China made 13,660 million pairs in 2025, 55.6% of world output, keeping first place by a wide margin (World Footwear Yearbook 2026).
Copy text
55.6% of the world's shoes are made in China: China made 13,660 million pairs in 2025, 55.6% of world output, keeping first place by a wide margin (World Footwear Yearbook 2026). Source: World Footwear Yearbook 2026 (Tables 1 and 3). Via UrbanStyle Footwear: https://urbanstylefootwear.com/largest-footwear-producing-countries/
India made about 3 billion pairs in 2025, 12.2% of world output, ahead of Vietnam with 1,658 million (6.7%) (World Footwear Yearbook 2026).
Copy text
3.0 billion pairs made in India, second in the world: India made about 3 billion pairs in 2025, 12.2% of world output, ahead of Vietnam with 1,658 million (6.7%) (World Footwear Yearbook 2026). Source: World Footwear Yearbook 2026 (Tables 1 and 3). Via UrbanStyle Footwear: https://urbanstylefootwear.com/largest-footwear-producing-countries/
The top 10 producers (China, India, Vietnam, Brazil, Indonesia, Pakistan, Bangladesh, Türkiye, Cambodia and Mexico) made 89.5% of the world's shoes in 2025 (World Footwear Yearbook 2026).
Copy text
89.5% of world output from 10 countries: The top 10 producers (China, India, Vietnam, Brazil, Indonesia, Pakistan, Bangladesh, Türkiye, Cambodia and Mexico) made 89.5% of the world's shoes in 2025 (World Footwear Yearbook 2026). Source: World Footwear Yearbook 2026 (Tables 1 and 3). Via UrbanStyle Footwear: https://urbanstylefootwear.com/largest-footwear-producing-countries/
Asia made 88.7% of the world's footwear in 2025. Brazil, Mexico and Türkiye are the only top-10 producers outside East, South and Southeast Asia (World Footwear Yearbook 2026).
Copy text
88.7% of shoes are made in Asia: Asia made 88.7% of the world's footwear in 2025. Brazil, Mexico and Türkiye are the only top-10 producers outside East, South and Southeast Asia (World Footwear Yearbook 2026). Source: World Footwear Yearbook 2026 (Tables 1 and 3). Via UrbanStyle Footwear: https://urbanstylefootwear.com/largest-footwear-producing-countries/
The three largest producers made 18.3 billion of the world's 24.6 billion pairs in 2025, 74.5% of the total (my calculation from the World Footwear Yearbook 2026).
Copy text
74.5% from China, India and Vietnam: The three largest producers made 18.3 billion of the world's 24.6 billion pairs in 2025, 74.5% of the total (my calculation from the World Footwear Yearbook 2026). Source: UrbanStyle calculation. Via UrbanStyle Footwear: https://urbanstylefootwear.com/largest-footwear-producing-countries/
China exported about 9,016 million of the 13,660 million pairs it made in 2025, about 66%. Its own consumption of 4,817 million pairs equals about 35% of its output (my calculation from the Yearbook).
Copy text
66% of China's shoes are exported: China exported about 9,016 million of the 13,660 million pairs it made in 2025, about 66%. Its own consumption of 4,817 million pairs equals about 35% of its output (my calculation from the Yearbook). Source: UrbanStyle calculation. Via UrbanStyle Footwear: https://urbanstylefootwear.com/largest-footwear-producing-countries/
India exported 268 million of about 3,000 million pairs it made in 2025, about 9%, and consumed 2,772 million at home. The world's second-largest producer mostly makes for itself (my calculation from the Yearbook).
Copy text
9% of India's shoes are exported: India exported 268 million of about 3,000 million pairs it made in 2025, about 9%, and consumed 2,772 million at home. The world's second-largest producer mostly makes for itself (my calculation from the Yearbook). Source: UrbanStyle calculation. Via UrbanStyle Footwear: https://urbanstylefootwear.com/largest-footwear-producing-countries/
Applying the 2019 shares to that year's 24.3 billion pairs, India's output rose about 15% and Vietnam's about 18% by 2025, while China's was about flat (+1%) (my calculation from two Yearbook editions).
Copy text
+15% and +18% India and Vietnam output, 2019 to 2025: Applying the 2019 shares to that year's 24.3 billion pairs, India's output rose about 15% and Vietnam's about 18% by 2025, while China's was about flat (+1%) (my calculation from two Yearbook editions). Source: UrbanStyle calculation. Via UrbanStyle Footwear: https://urbanstylefootwear.com/largest-footwear-producing-countries/
Indonesia's share of world output fell from 5.1% in 2019 to 3.2% in 2025, from about 1239 million pairs to 782 million (my calculation from two Yearbook editions; estimates may have been revised).
Copy text
-37% Indonesia's production, 2019 to 2025: Indonesia's share of world output fell from 5.1% in 2019 to 3.2% in 2025, from about 1239 million pairs to 782 million (my calculation from two Yearbook editions; estimates may have been revised). Source: UrbanStyle calculation. Via UrbanStyle Footwear: https://urbanstylefootwear.com/largest-footwear-producing-countries/
The World Footwear Yearbook revised 2024 world production from 23.9 billion pairs to 24.5 billion, turning growth of 6.9% into almost 10% (World Footwear, August 2026).
Copy text
24.5 billion pairs in 2024, revised up: The World Footwear Yearbook revised 2024 world production from 23.9 billion pairs to 24.5 billion, turning growth of 6.9% into almost 10% (World Footwear, August 2026). Source: World Footwear, Aug 2026. Via UrbanStyle Footwear: https://urbanstylefootwear.com/largest-footwear-producing-countries/
Italy made 118.4 million pairs in 2025, down 5.4%, across about 3,200 companies with 68,300 employees (Assocalzaturifici).
Copy text
118.4 million pairs made in Italy in 2025: Italy made 118.4 million pairs in 2025, down 5.4%, across about 3,200 companies with 68,300 employees (Assocalzaturifici). Source: Assocalzaturifici. Via UrbanStyle Footwear: https://urbanstylefootwear.com/largest-footwear-producing-countries/
The US makes about 25 million pairs a year (FDRA) against consumption of about 1.95 billion pairs (Yearbook 2026), so roughly 1.3% of the shoes Americans buy are made at home (my calculation).
Copy text
25 million pairs made in the United States: The US makes about 25 million pairs a year (FDRA) against consumption of about 1.95 billion pairs (Yearbook 2026), so roughly 1.3% of the shoes Americans buy are made at home (my calculation). Source: FDRA. Via UrbanStyle Footwear: https://urbanstylefootwear.com/largest-footwear-producing-countries/
In fiscal 2026, factories in Vietnam, Indonesia and China made about 52%, 27% and 16% of NIKE Brand footwear, across 95 contract footwear factories in 11 countries (Nike Form 10-K).
Copy text
52% / 27% / 16% NIKE footwear from Vietnam, Indonesia, China: In fiscal 2026, factories in Vietnam, Indonesia and China made about 52%, 27% and 16% of NIKE Brand footwear, across 95 contract footwear factories in 11 countries (Nike Form 10-K). Source: Nike 10-K, FY2026 (Form 10-K, Item 1). Via UrbanStyle Footwear: https://urbanstylefootwear.com/largest-footwear-producing-countries/
World production fell 15.8% in 2020, almost 4 billion pairs, to about 20.5 billion, wiping out a decade of growth before recovering to 23.9 billion in 2022 (Yearbook summaries; 2020 total is my calculation).
Copy text
20.5 billion pairs in 2020, the pandemic low: World production fell 15.8% in 2020, almost 4 billion pairs, to about 20.5 billion, wiping out a decade of growth before recovering to 23.9 billion in 2022 (Yearbook summaries; 2020 total is my calculation). Source: World Footwear, Aug 2021. Via UrbanStyle Footwear: https://urbanstylefootwear.com/largest-footwear-producing-countries/
Which countries produce the most footwear?
Short answer. In 2025: 1. China 13,660 million pairs, 2. India 3,000 million, 3. Vietnam 1,658 million, 4. Brazil 848 million, 5. Indonesia 782 million, 6. Pakistan 627 million, 7. Bangladesh 554 million, 8. Türkiye 391 million, 9. Cambodia 264 million and 10. Mexico 215 million.
This is the core ranking, by pairs made. China’s bar is so long that everyone else looks small, which is the honest picture: it makes more shoes than every other country in the world put together (13.7 billion pairs against 10.9 billion).
Embed this chart
<figure style="margin:0"><a href="https://urbanstylefootwear.com/largest-footwear-producing-countries/"><img src="https://urbanstylefootwear.com/wp-content/uploads/2026/10/usf-largest-footwear-producing-countries-2025.png" alt="Bar chart of 2025 shoe production: China 13,660 million pairs, India 3,000, Vietnam 1,658, Brazil 848, Indonesia 782" width="800" style="max-width:100%;height:auto"></a><figcaption>Source: UrbanStyle Footwear, based on the World Footwear Yearbook 2026. <a href="https://urbanstylefootwear.com/largest-footwear-producing-countries/">World's Largest Footwear-Producing Countries</a></figcaption></figure>Click the code, press Ctrl+C (Cmd+C on Mac), and paste it into any web page. Please keep the attribution link.
View as table
| Rank | Country | Production 2025, million pairs | Share of world production |
|---|---|---|---|
| 1 | China | 13,660 | 55.6% |
| 2 | India | 3,000 | 12.2% |
| 3 | Vietnam | 1,658 | 6.7% |
| 4 | Brazil | 848 | 3.4% |
| 5 | Indonesia | 782 | 3.2% |
| 6 | Pakistan | 627 | 2.6% |
| 7 | Bangladesh | 554 | 2.3% |
| 8 | Türkiye | 391 | 1.6% |
| 9 | Cambodia | 264 | 1.1% |
| 10 | Mexico | 215 | 0.9% |
| Top 10 | 21,998 | 89.5% | |
| World | 24,600 | 100% |
The table adds what each country exports and consumes where the sources give it, plus Italy and the US for comparison. Filter it by region.
| Rank | Country | Made, M pairs | World share | Exported, M pairs | Share exported | Consumed, M pairs |
|---|---|---|---|---|---|---|
| 1 | China | 13,660 | 55.6% | 9,016 | 66% | 4,817 |
| 2 | India | 3,000 | 12.2% | 268 | 9% | 2,772 |
| 3 | Vietnam | 1,658 | 6.7% | 1,658 | 100% * | n/a |
| 4 | Brazil | 848 | 3.4% | 103.9 | 12% | 787 |
| 5 | Indonesia | 782 | 3.2% | 585 | 75% | n/a |
| 6 | Pakistan | 627 | 2.6% | 21.0 | 3% | 620 |
| 7 | Bangladesh | 554 | 2.3% | n/a | n/a | 455 |
| 8 | Türkiye | 391 | 1.6% | 184 | 47% | n/a |
| 9 | Cambodia | 264 | 1.1% | 253 | 96% | n/a |
| 10 | Mexico | 215 | 0.9% | n/a | n/a | n/a |
| Italy | 118.4 | n/a | 205 | 173% ** | n/a | |
| United States | about 25 | n/a | n/a | n/a | 1,950 |
What you can safely say. “China made 13,660 million pairs of shoes in 2025, 55.6% of world production, according to the World Footwear Yearbook 2026.” Say that it is an industry estimate of pairs produced, not exports.
How has world footwear production changed over time?
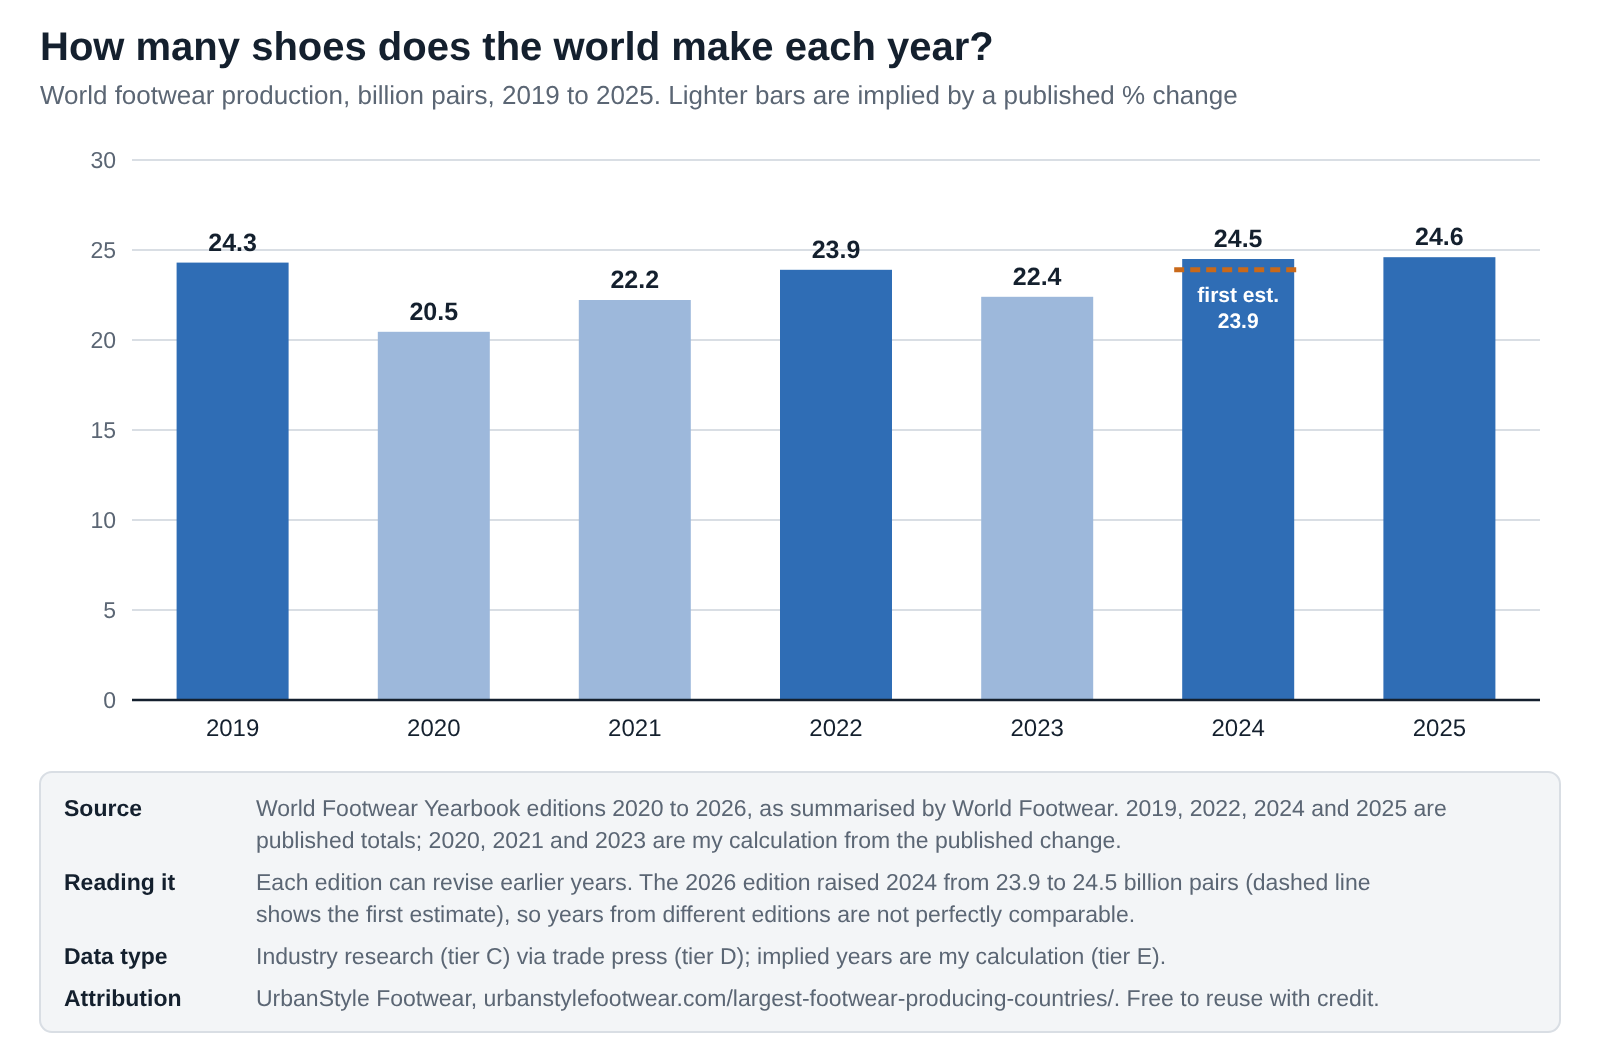
Short answer. It is back to its pre-pandemic level and flat. World output was a record 24.3 billion pairs in 2019, fell 15.8% to about 20.5 billion in 2020, recovered to 23.9 billion in 2022 and reached 24.6 billion in 2025, up just 0.1% on the year.
I rebuilt the series from each year’s Yearbook summary. Where an edition gave only a percentage change, I worked out the total and shaded the bar lighter.
Embed this chart
<figure style="margin:0"><a href="https://urbanstylefootwear.com/largest-footwear-producing-countries/"><img src="https://urbanstylefootwear.com/wp-content/uploads/2026/10/usf-world-footwear-production-2019-2025.png" alt="Bar chart of world shoe production: 24.3 billion pairs in 2019, about 20.5 in 2020, 23.9 in 2022 and 24.6 in 2025" width="800" style="max-width:100%;height:auto"></a><figcaption>Source: UrbanStyle Footwear, based on World Footwear Yearbook editions 2020 to 2026. <a href="https://urbanstylefootwear.com/largest-footwear-producing-countries/">World's Largest Footwear-Producing Countries</a></figcaption></figure>Click the code, press Ctrl+C (Cmd+C on Mac), and paste it into any web page. Please keep the attribution link.
View as table
| Year | World production, billion pairs | Published or implied | Basis |
|---|---|---|---|
| 2019 | 24.3 | Published | Yearbook 2020: a record 24.3 billion pairs |
| 2020 | 20.5 | Implied | Yearbook 2021: down 15.8%, almost 4 billion pairs |
| 2021 | 22.2 | Implied | Yearbook 2022: "over 22 billion", up 8.6% |
| 2022 | 23.9 | Published | Yearbook 2023: 23.9 billion, up 7.6% |
| 2023 | 22.4 | Implied | Yearbook 2025: 2023 fell by about 1.5 billion pairs |
| 2024 | 24.5 | Published | Yearbook 2026 revision (the 2025 edition first said 23.9 billion) |
| 2025 | 24.6 | Published | Yearbook 2026: up 0.1% |
The 2024 bar shows why I’m careful with this series. The 2025 edition first put 2024 at 23.9 billion pairs, up 6.9%. A year later, the 2026 edition revised it to 24.5 billion, growth of almost 10%. Neither is wrong; the second simply had more data. China’s share moved within a narrow band the whole time:
| Year | China's share of world production | Edition |
|---|---|---|
| 2019 | 55.5% | Yearbook 2020 |
| 2020 | 54.3% | Yearbook 2021 |
| 2021 | 54.1% | Yearbook 2022 |
| 2022 | 54.6% | Yearbook 2023 |
| 2024 | 54.0% (just over) | Yearbook 2025 |
| 2025 | 55.6% | Yearbook 2026 |
How concentrated is world footwear production?
Short answer. Very. One country makes 55.6% of the world’s shoes, three make 74.5% and ten make 89.5%. Every other country in the world combined makes about 2.6 billion pairs, less than India alone.
| Group | Pairs, 2025, million | Share of world |
|---|---|---|
| China | 13,660 | 55.6% |
| China, India and Vietnam | 18,318 | 74.5% |
| Top 10 countries | 21,998 | 89.5% |
| Asia | about 21,820 | 88.7% |
| Every country outside the top 10 | about 2,602 | 10.5% |
For anyone sourcing shoes, that concentration is the main risk to plan around. A factory shutdown, a tariff or a shipping problem in one or two countries reaches most of the world’s supply.
Source: World Footwear Yearbook 2026 (tier C). Group totals and the Asia pair count are my calculations from published shares (tier E).Which countries are emerging as footwear manufacturing hubs?
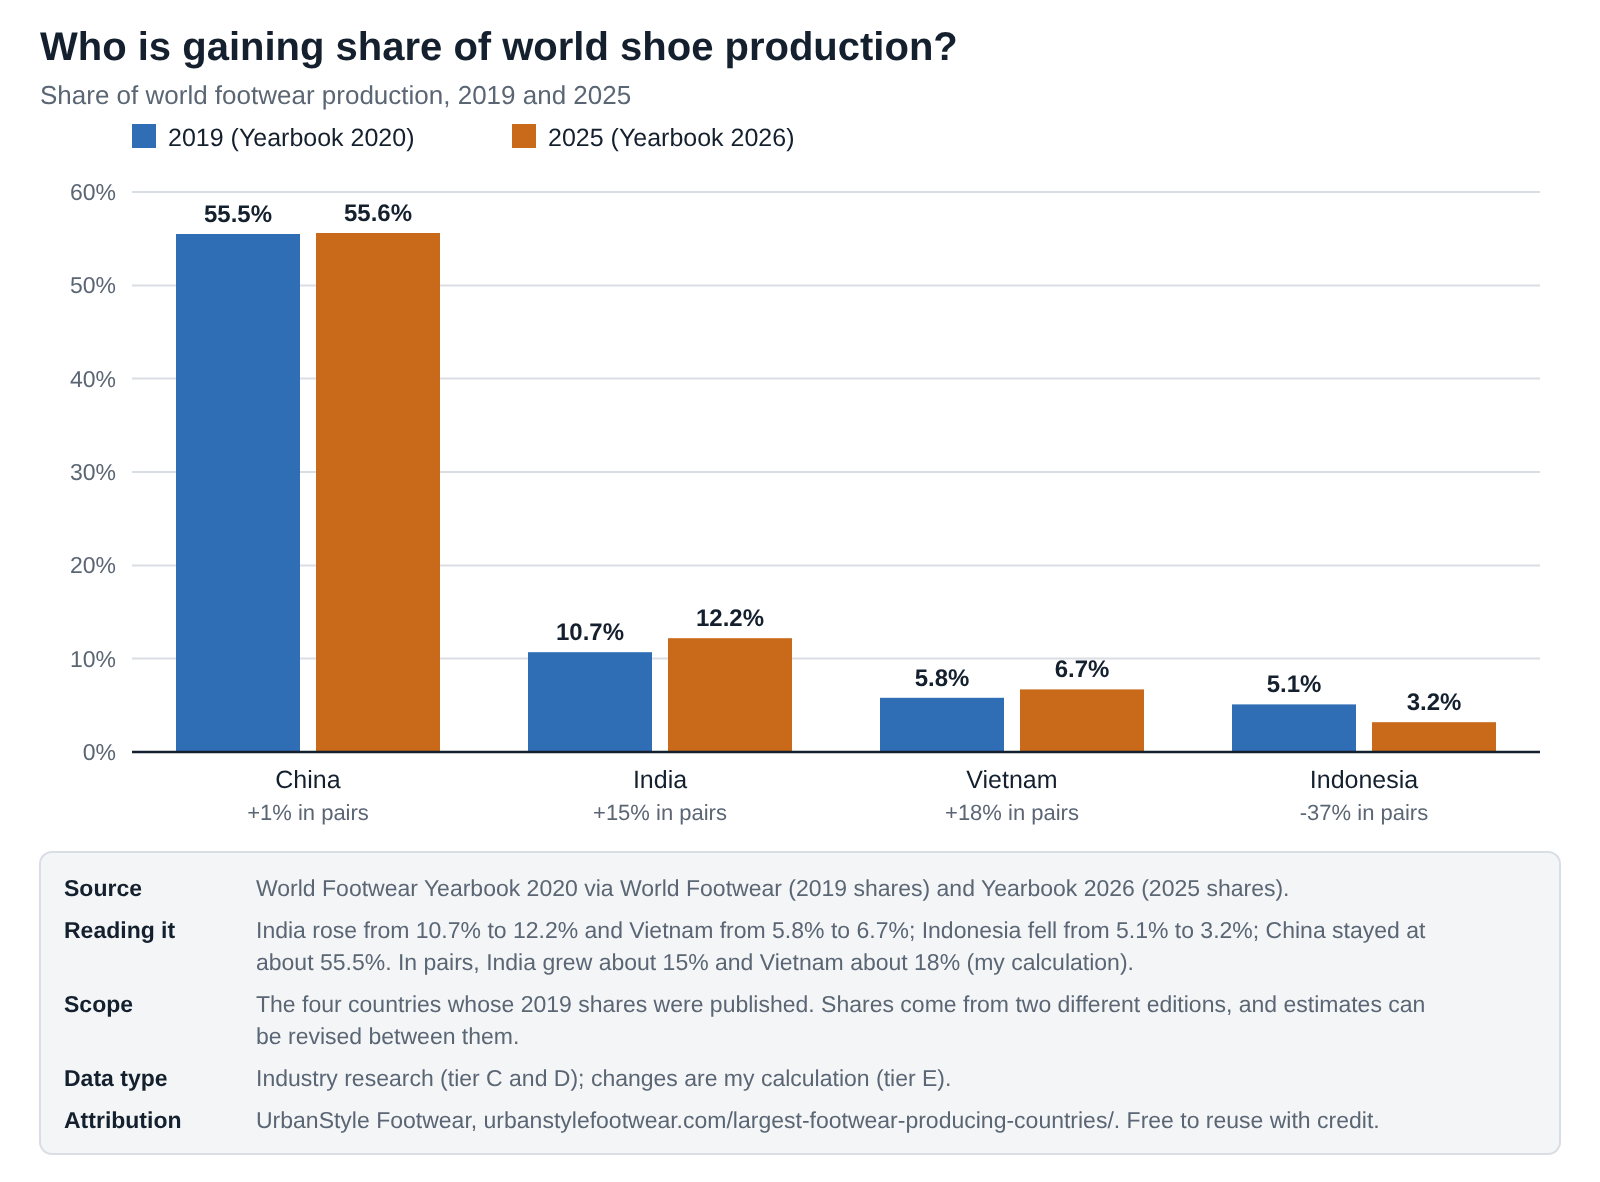
Short answer. India and Vietnam gained the most share from 2019 to 2025: India from 10.7% to 12.2% and Vietnam from 5.8% to 6.7%. The Yearbook also notes notable increases for Bangladesh and Cambodia in 2025. Indonesia lost ground, from 5.1% to 3.2%.
The Yearbook published 2019 shares for four countries, so I compared them with 2025.
Embed this chart
<figure style="margin:0"><a href="https://urbanstylefootwear.com/largest-footwear-producing-countries/"><img src="https://urbanstylefootwear.com/wp-content/uploads/2026/10/usf-footwear-production-share-2019-vs-2025.png" alt="Bars of world production share 2019 vs 2025: India 10.7% to 12.2%, Vietnam 5.8% to 6.7%, Indonesia 5.1% to 3.2%" width="800" style="max-width:100%;height:auto"></a><figcaption>Source: UrbanStyle Footwear, based on World Footwear Yearbooks 2020 and 2026. <a href="https://urbanstylefootwear.com/largest-footwear-producing-countries/">World's Largest Footwear-Producing Countries</a></figcaption></figure>Click the code, press Ctrl+C (Cmd+C on Mac), and paste it into any web page. Please keep the attribution link.
View as table
| Country | Share 2019 | Share 2025 | Pairs 2019 (implied), million | Pairs 2025, million | Change |
|---|---|---|---|---|---|
| China | 55.5% | 55.6% | 13,487 | 13,660 | +1% |
| India | 10.7% | 12.2% | 2,600 | 3,000 | +15% |
| Vietnam | 5.8% | 6.7% | 1,409 | 1,658 | +18% |
| Indonesia | 5.1% | 3.2% | 1,239 | 782 | -37% |
In pairs, India grew about 15% and Vietnam about 18% between 2019 and 2025, while China was about flat. Indonesia’s estimated output fell from about 1,239 million pairs to 782 million. A drop that large may partly reflect revised estimates rather than closed factories, so I’d quote the direction more confidently than the size.
Cambodia and Bangladesh are the smaller risers. Cambodia made 264 million pairs in 2025 and exported almost all of them; its footwear exports grew 24.5% in dollar terms in 2025, which I cover on the trade page. Bangladesh made 554 million pairs and ranks seventh.
What you can safely say. “India and Vietnam increased their shares of world footwear production between 2019 and 2025, while China’s share held at about 55%.” Name the two Yearbook editions.
Do the biggest producers make shoes for export or for home?
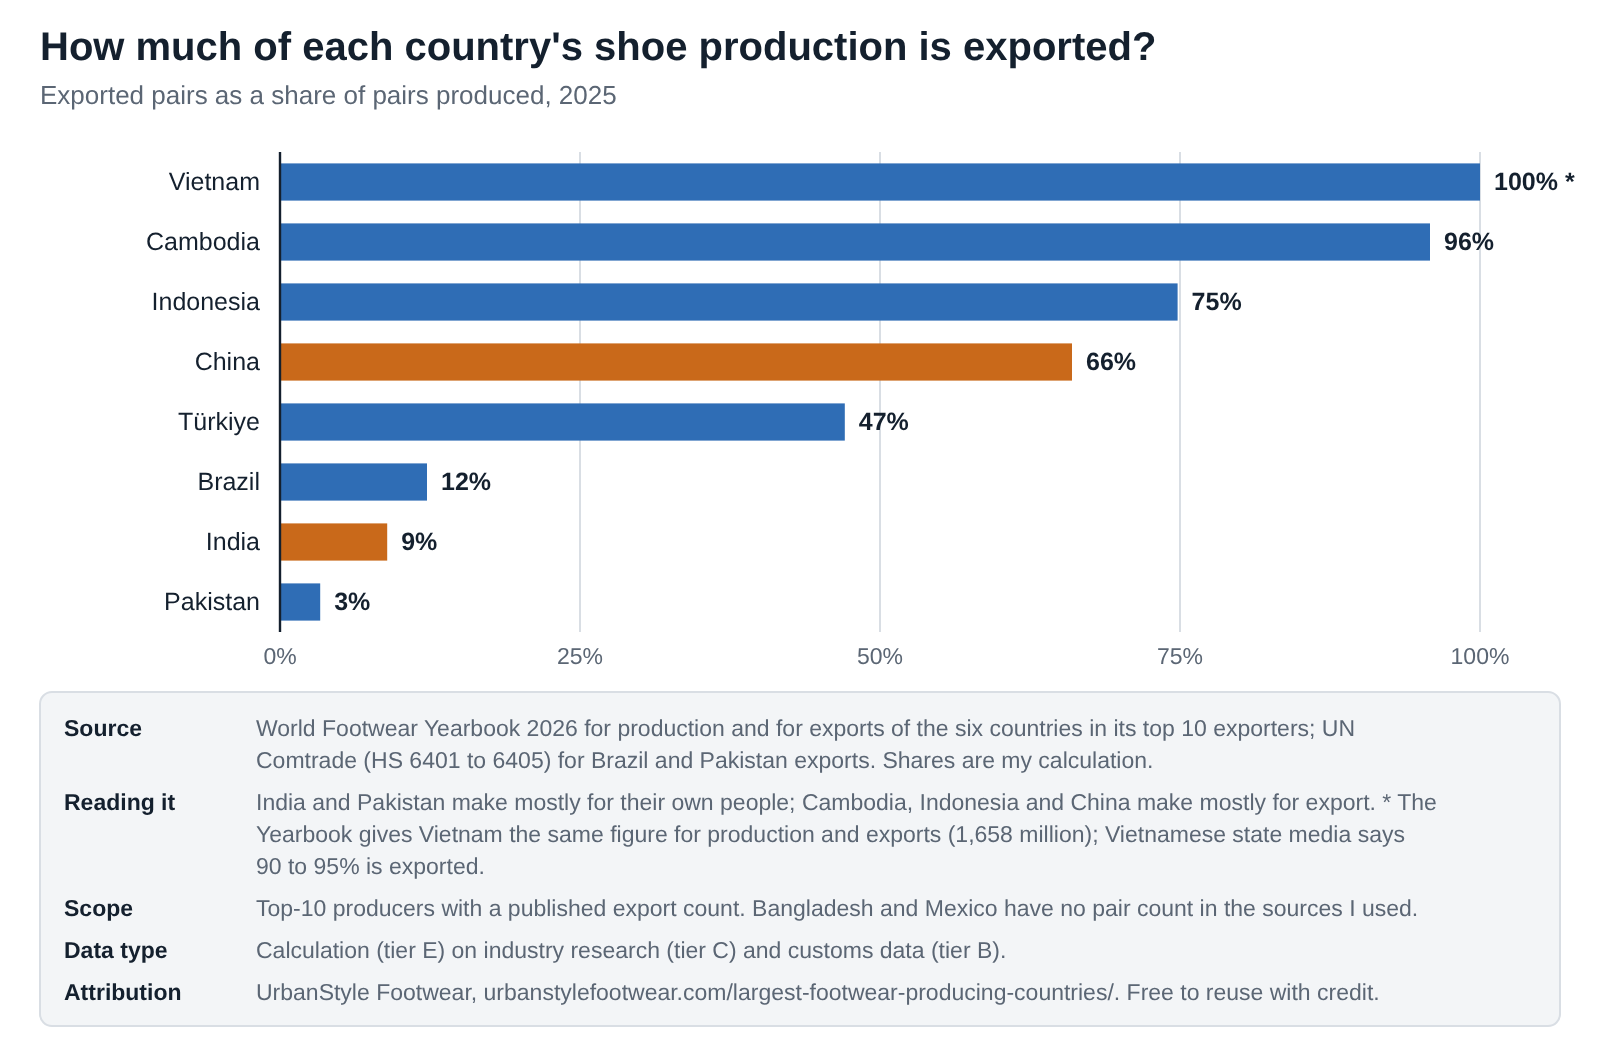
Short answer. It depends on the country. Cambodia exports about 96% of its pairs, Indonesia 75% and China 66%. India exports about 9%, Brazil 12% and Pakistan 3%, because they make mainly for their own large populations.
Embed this chart
<figure style="margin:0"><a href="https://urbanstylefootwear.com/largest-footwear-producing-countries/"><img src="https://urbanstylefootwear.com/wp-content/uploads/2026/10/usf-share-of-footwear-production-exported-2025.png" alt="Bar chart of share of shoe production exported in 2025: Cambodia 96%, Indonesia 75%, China 66%, India 9%" width="800" style="max-width:100%;height:auto"></a><figcaption>Source: UrbanStyle Footwear, based on the World Footwear Yearbook 2026 and UN Comtrade (UrbanStyle calculation). <a href="https://urbanstylefootwear.com/largest-footwear-producing-countries/">World's Largest Footwear-Producing Countries</a></figcaption></figure>Click the code, press Ctrl+C (Cmd+C on Mac), and paste it into any web page. Please keep the attribution link.
View as table
| Country | Production 2025, million pairs | Exports 2025, million pairs | Share exported | Export source |
|---|---|---|---|---|
| Vietnam | 1,658 | 1,658 | 100.0% | Yearbook 2026 |
| Cambodia | 264 | 253 | 95.8% | Yearbook 2026 |
| Indonesia | 782 | 585 | 74.8% | Yearbook 2026 |
| China | 13,660 | 9,016 | 66.0% | Yearbook 2026 |
| Türkiye | 391 | 184 | 47.1% | Yearbook 2026 |
| Brazil | 848 | 103.9 | 12.3% | UN Comtrade |
| India | 3,000 | 268 | 8.9% | Yearbook 2026 |
| Pakistan | 627 | 21.0 | 3.3% | UN Comtrade |
Consumption tells the same story from the other side. The Yearbook’s consumption figures for 2025, set against production:
| Country | Made, M pairs | Consumed, M pairs | Gap, M pairs | Consumed as % of made |
|---|---|---|---|---|
| China | 13,660 | 4,817 | +8,843 | 35% |
| India | 3,000 | 2,772 | +228 | 92% |
| Brazil | 848 | 787 | +61 | 93% |
| Pakistan | 627 | 620 | +7 | 99% |
| Bangladesh | 554 | 455 | +99 | 82% |
| United States | about 25 | 1,950 | about -1,925 | about 7,800% |
| Japan | n/a | 639 | n/a | n/a |
China’s own consumption equals about 35% of what it makes, and India’s about 92%. The US is the mirror image: it makes about 25 million pairs and buys about 1.95 billion, so roughly 1% of the shoes Americans buy are made at home. That is why “largest producer” and “largest exporter” lists only partly overlap.
Sources: World Footwear Yearbook 2026 (tier C); UN Comtrade (tier B); FDRA (tier C). Shares are my calculations (tier E). Vietnam’s production and export figures are identical in the Yearbook, so its 100% is an artefact of the estimate.Where do big brands make their shoes?
Short answer. Mostly in Vietnam. Nike made about 52% of its footwear in Vietnam, 27% in Indonesia and 16% in China in fiscal 2026. adidas reports 41%, 31% and 14% for 2025.
| Country | NIKE Brand footwear, FY2026 | adidas footwear, 2025 | Share of world production, 2025 |
|---|---|---|---|
| Vietnam | 52% | 41% | 6.7% |
| Indonesia | 27% | 31% | 3.2% |
| China | 16% | 14% | 55.6% |
| Other countries | 5% | 14% | 34.5% |
The gap between the brands and the world is the point. China makes more than half of all shoes, but about 4.8 billion pairs stay in China, and the pairs it exports averaged about $4.61 each at the border in 2025 (my calculation from UN Comtrade). Nike’s and adidas’s shoes come mostly from Vietnam and Indonesia, which is why so many running shoes carry a “Made in Vietnam” label. My guide to checking Nike authenticity covers what the label and box should show.
Sources: NIKE, Inc. Form 10-K for fiscal 2026 (tier B); adidas annual report as reported by The Investor (tier D); world shares from the Yearbook 2026 (tier C).How many shoes do Europe and the United States make?
Short answer. Few, by world standards. Italy made 118.4 million pairs in 2025, down 5.4%, and the US makes about 25 million pairs a year. Together that is under 1% of world output.
Italy is Europe’s best-known producer. Its manufacturers’ association counts about 3,200 companies and 68,300 employees. Italy doesn’t make the top 10 by pairs, but it is the world’s third-largest footwear exporter by value (UN Comtrade, 2025) because its shoes are worth so much per pair. It also re-exports: it shipped about 205 million pairs abroad in 2025, more than it made.
The US makes about 25 million pairs, by the FDRA’s count, a tiny fraction of the roughly 1.95 billion pairs Americans buy. A few brands still make shoes there, such as New Balance, which I covered in its Made in USA collection. My US footwear market statistics page covers imports and prices.
Sources: Assocalzaturifici (tier C); FDRA (tier C); Yearbook 2026 (tier C).Do national figures agree with the production rankings?
Short answer. Mostly, yes. Brazil’s association data implies about 848 million pairs, matching the Yearbook. Mexico’s reported 2024 output of 214 million sits next to the Yearbook’s 215 million. India’s government figure of 2.9 billion is close to 3.0 billion. Vietnam is the outlier.
| Country | Yearbook 2026, M pairs (2025) | National figure, M pairs | Source and note |
|---|---|---|---|
| Brazil | 848 | about 848 (2025) | Abicalçados data: Ceará 206.8 million pairs = 24.4% of national output (my calculation) |
| Mexico | 215 | about 214 (2024) | News report of national production |
| India | 3,000 | about 2,900 (annual) | Union Minister of Textiles; same 12.5% of 23.9 billion as the 2025 Yearbook |
| Vietnam | 1,658 | over 1,400 (year not stated) | State media, May 2025; 90 to 95% exported |
| Italy | not in top 10 | 118.4 (2025) | Assocalzaturifici; down 5.4% |
| United States | not in top 10 | about 25 | FDRA |
Vietnam is the one I’d flag. State media gave “over 1.4 billion pairs” in May 2025, without a year, and the Yearbook gives 1,658 million for 2025, the same number it gives for exports. The identical figures suggest the estimate starts from export data, so I treat Vietnam’s number as the least certain in the top 10. Brazil is another lesson: its association forecast 897 to 904 million pairs for 2025 at the end of 2024, and the year came in lower.
Sources: as listed in the table; Yearbook 2026 (tier C). Brazil’s implied total is my calculation (tier E).Why do footwear production figures disagree?
Short answer. Most published “production” rankings are really export rankings, or they mix years, or they repeat old Yearbook editions. Production itself is an estimate that gets revised.
| Reason | Example from my research | What to do |
|---|---|---|
| Exports used as production | Italy exported 205 million pairs but made 118.4 million | Rank by pairs produced |
| Value used instead of pairs | Italy is third by export value but outside the top 10 by pairs | Say which measure you rank by |
| Revisions between editions | 2024 world output: 23.9 billion first, 24.5 billion later | Quote the edition |
| Old editions still circulating | Top-ranking pages built on 2021 or undated figures | Check the data year |
| Government figures that repeat the Yearbook | India’s 2.9 billion matches 12.5% of the 23.9 billion world total | Don’t count it as a second source |
| Brand sourcing read as national output | Nike’s 52% from Vietnam is one company’s supply chain | Keep company and country data apart |
| Forecasts quoted as results | Brazil forecast about 900 million pairs for 2025; the estimate came in at 848 million | Label forecasts |
Who measures footwear production?
There is no global census of shoe factories. Select a step to see each layer of evidence and how I use it.
1FactoriesShoe makers in each country
Make the pairs. Almost none publish counts individually, and no global census of factories exists.
2National associations and statisticsAssocalzaturifici, Abicalçados, FDRA, governments
Count production at home for a handful of countries, often with jobs and companies. I use them to check the ranking.
3Industry yearbookAPICCAPS, World Footwear Yearbook
Estimates production for every major country on one method, combining national data, trade and consumption, and revises earlier years. This is the source of the ranking.
4Company filingsNike Form 10-K, adidas annual report
Show where one brand’s contract factories are. Precise, but about a supply chain, not a country’s output.
5Trade press and articlesWorld Footwear, APLF, news sites
Summarise the Yearbook and national figures, often with gaps. I use them for earlier editions and label them tier D.
How good is the evidence behind footwear production rankings?
Short answer. Good for the ranking, thinner beyond it. Of the 97 rows in this page’s dataset, 47% come from industry research such as the Yearbook (tier C), 7% are official records or regulated filings (tier B), 18% are secondary reporting (tier D) and 28% are my calculations (tier E).
| Evidence tier | Rows | Share |
|---|---|---|
| A Peer-reviewed research | 0 | 0% |
| B Official records and filings | 7 | 7% |
| C Industry research | 46 | 47% |
| D Secondary reporting | 17 | 18% |
| E UrbanStyle calculations | 27 | 28% |
| Total | 97 | 100% |
- Tier C carries the ranking. The Yearbook is the only source that ranks every major producer on one method.
- Tier B is the check. Customs pair counts, Nike’s filing and India’s government figure test the Yearbook from outside.
- Counts are not quality scores. A tier E share is only as good as the estimates under it.
Where other footwear production articles go wrong
I read the pages that rank for “largest footwear producing countries” and similar searches. Some of these problems I saw directly, and the rest are traps that are easy to fall into. This is not a complete audit of anyone’s work.
- Problem 1Old data presented as current. Pages near the top of search results use 2021 figures, or production lists with no year at all.
- Problem 2Export shares and production shares mixed in the same bullet points, sometimes with countries swapped between them.
- Problem 3Text that contradicts the page’s own table, such as a different year for the same figure.
- Problem 4“Top manufacturing countries” lists that rank by export orders or by brand sourcing, then call it production.
- Problem 5No sources, or a long source list with no link between each figure and where it came from.
- Problem 6Revisions ignored, so two pages quoting the same Yearbook give different totals for the same year.
- Problem 7No downloadable data, so nobody can check or reuse the numbers.
How to use footwear production data well
Practical advice for sourcing teams, brands, students and writers.
- Say “pairs produced” and the Yearbook edition every time.
- Keep production, exports and consumption apart. Each answers a different question.
- Quote shares with care across editions. Revisions can move a country’s history.
- Use company filings for brand questions and country data for country questions.
- Look at the export share before treating a big producer as a sourcing option. India makes 3 billion pairs, but most are for Indian buyers.
- Plan for concentration. Three countries make three in four pairs.
If you are a shopper, the “made in” country on the label is a fair guide to where the shoe was assembled, and the materials matter more than the country for comfort and wear. My shoe materials guide and footwear buying guide cover that.
Sources and evidence tiers
Evidence hierarchy
- APeer-reviewed research. Not used. Production counts come from industry and national sources.
- BOfficial records and regulated filings. UN Comtrade, the Government of India statement and Nike’s Form 10-K.
- CIndustry research. The World Footwear Yearbook 2026 and national associations (Assocalzaturifici, Abicalçados, FDRA).
- DSecondary reporting. Trade press summaries of earlier Yearbooks and news reports of national and company figures.
- ECalculations. Implied totals, shares exported, home-consumption shares and changes, with the method stated.
Primary versus secondary data
Primary source: the organisation that collected the data. Secondary source: an article summarising someone else’s data. Where I could only read a secondary source, the table says so.
Source table
| Source | Year | Sample | Geography | Finding used | Tier | Series ID | Primary source |
|---|---|---|---|---|---|---|---|
| APICCAPS, World Footwear Yearbook 2026, free sample report (PDF) | 2026 | Industry yearbook; production estimates for 2025 with 2024 revised | Global | Top 10 producers in 2025 (China 13,660 million pairs, 55.6%; top 10 89.5%); world 24.6 billion pairs, up 0.1%; 2024 revised to 24.5 billion; Asia 88.7%; consumption by country; exports by pairs | C | Tables 1 and 3 | Yearbook sample (PDF) |
| World Footwear, "24.6 billion pairs: global footwear production in 2025" (August 4, 2026) | 2026 | Trade press summary of the Yearbook 2026 | Global | World production 24.6 billion pairs in 2025; 2024 revised to 24.5 billion, growth of almost 10% rather than 6.9% | D | n/a | World Footwear article |
| World Footwear, "Footwear production rebounds in 2024" (August 5, 2025) | 2025 | Trade press summary of the Yearbook 2025 | Global | 2024 production first estimated at 23.9 billion pairs, up 6.9%; China 13 billion, just over 54%; India 12.5%; Vietnam 6.5%; Asia 88%; 2023 fell by about 1.5 billion | D | n/a | World Footwear article |
| World Footwear, "2022: global footwear production reaches 23.9 billion pairs" (July 27, 2023) | 2023 | Trade press summary of the Yearbook 2023 | Global | Production 23.9 billion pairs in 2022, up 7.6%; China 54.6%; Asia 87.4%; Vietnam growth 10.3% | D | n/a | World Footwear article |
| World Footwear, "All the facts and numbers of the footwear industry in 2021" (September 28, 2022) | 2022 | Trade press summary of the Yearbook 2022 | Global | Production over 22 billion pairs in 2021, up 8.6%; China 54.1%; Asia 88% | D | n/a | World Footwear article |
| World Footwear, "Growth in production accumulated over a decade wiped away in 2020" (August 3, 2021) | 2021 | Trade press summary of the Yearbook 2021 | Global | Production fell 15.8% in 2020, almost 4 billion pairs; China 54.3% | D | n/a | World Footwear article |
| World Footwear, "Footwear production with new record of 24.3 billion pairs" (August 4, 2020) | 2020 | Trade press summary of the Yearbook 2020 | Global | Production 24.3 billion pairs in 2019; China 55.5%, India 10.7%, Vietnam 5.8%, Indonesia 5.1% | D | n/a | World Footwear article |
| Press Information Bureau (Government of India) blog by the Union Minister of Textiles, "Smart, Sustainable, Seamless" (May 5, 2026) | 2026 | Government statement | India | India makes about 2.9 billion pairs a year, about 12.5% of a world output of about 23.9 billion; over 2 million people employed | B | n/a | PIB blog |
| NIKE, Inc., Form 10-K for fiscal 2026 (year ended May 31, 2026), filed with the US SEC | 2026 | Company annual filing | Global | 95 finished-goods footwear factories in 11 countries; Vietnam, Indonesia and China made about 52%, 27% and 16% of NIKE Brand footwear | B | Form 10-K, Item 1 | SEC filing |
| United Nations Comtrade database, 2025 exports of HS headings 6401 to 6405, read October 25, 2026 | 2025 | Customs records reported by each country | Brazil, Pakistan | Brazil exported 103.9 million pairs and Pakistan 21.1 million pairs in 2025 | B | HS 6401 to 6405 | UN Comtrade |
| Assocalzaturifici, "Il settore calzaturiero italiano" (industry page, read October 26, 2026) | 2025 | Italian footwear manufacturers' association, 2025 figures | Italy | 118.4 million pairs made in 2025, down 5.4%; about 3,200 companies; 68,300 employees; exports 11.57 billion euros | C | n/a | Assocalzaturifici page |
| Abicalçados, "Domestic market ensures footwear sector growth for 2025" (November 12, 2024) | 2024 | Association forecast | Brazil | Production forecast of 897 to 904 million pairs for 2025; 898 million pairs in 2019 | C | n/a | Abicalçados page |
| Footwear Distributors and Retailers of America (FDRA), industry facts on its website (as read September 21, 2026) | 2026 | US trade association statement | United States | About 25 million pairs of shoes made in the US | C | n/a | FDRA website |
| Movimento Econômico, "Com fornecedor e inovação longe da fábrica, calçado do NE perde salto nas vendas" (August 11, 2026), citing Abicalçados | 2026 | Brazilian footwear association data reported by a regional business site | Brazil | Ceará made 206.8 million pairs in 2025, 24.4% of Brazil's production | D | n/a | Movimento Econômico article |
| VOV, "Vietnam ranks among top 3 footwear producers and exporters globally" (May 30, 2025) | 2025 | State media report | Vietnam | Vietnam makes over 1.4 billion pairs and exports 90 to 95% of its production | D | n/a | VOV article |
| Xataka, "Una sola empresa va a comprar el 20% de todo el calzado que se fabrica en México" (March 6, 2026) | 2026 | News report | Mexico | Mexico made about 214 million pairs in 2024; Coppel plans to buy 42 million pairs in 2026, about 20% of formal national production | D | n/a | Xataka article |
| The Investor, "Vietnam retains top spot in Adidas global sourcing" (April 11, 2026), citing the adidas annual report | 2026 | News report of a company annual report | Global | adidas footwear sourcing in 2025: Vietnam 41%, Indonesia 31%, China 14% | D | n/a | The Investor article |
| UrbanStyle Footwear calculations on this page | 2026 | Arithmetic on figures from the sources above; method stated | Global | Implied totals, shares exported, home consumption shares, changes and gaps on this page | E | n/a | Methodology |
Methodology and limitations
How I built this page. I took the 2025 production ranking, world total and consumption figures from the free sample of the World Footwear Yearbook 2026. I rebuilt the 2019 to 2025 series from World Footwear’s summaries of each Yearbook edition, and calculated 2020, 2021 and 2023 from the published percentage changes. I then looked for independent figures: Assocalzaturifici for Italy, Abicalçados data for Brazil, the Government of India, Vietnamese state media, a Mexican news report and the FDRA for the US. I added Nike’s fiscal 2026 Form 10-K and adidas’s sourcing shares as reported by The Investor, and UN Comtrade export pairs for Brazil and Pakistan. Everything was read between October 25 and 26, 2026.
Choices I made. I rank only by pairs produced, never by export value or export volume. Shares exported use the Yearbook’s own export figures where it gives them, so production and exports come from the same method, and Comtrade only where the Yearbook doesn’t list a country. I don’t rank by production value, which has no comparable source.
Limitations you should know about
- One main source. Few governments count pairs produced, so the ranking rests on the Yearbook’s estimates.
- Revisions. Editions revise earlier years; my history mixes editions and implied totals, labelled as such.
- Free sample only. The paid Yearbook has full country tables. I used what is public.
- Vietnam. Its production and export estimates are identical in the Yearbook, and state media give a lower production figure.
- Indonesia. Its fall from 2019 to 2025 may partly reflect revised estimates.
- Different years. Mexico’s national figure is for 2024 and the US figure is undated, so they’re comparisons, not exact checks.
Data freshness
| Date | Change |
|---|---|
| October 26, 2026 | First publication. World Footwear Yearbook 2026 sample, Yearbook summaries 2020 to 2025, national figures for Italy, Brazil, India, Vietnam, Mexico and the US, Nike and adidas sourcing, UN Comtrade pairs. Downloadable dataset, four charts and calculations with stated methods. |
| July or August 2027 | Planned update when the World Footwear Yearbook 2027 publishes 2026 production. |
| January 2027 | Next scheduled full review. |
Last full source review: October 26, 2026. Next scheduled review: January 2027.
Corrections. If you spot an error or have better data, email info@urbanstylefootwear.com with the subject “Data correction”. I’ll check it and note any change in the table above. How we review products is explained in our methodology.
For journalists and researchers
You can use the statistics and charts on this page with credit to UrbanStyle Footwear. Wherever you can, please cite the original source printed with each statistic. My own calculations are marked tier E and can be cited to me.
A sentence you can use. “China made 13.7 billion of the world’s 24.6 billion pairs of shoes in 2025, but only about 16% of Nike’s footwear, which comes mostly from Vietnam and Indonesia.” (Sources: World Footwear Yearbook 2026; NIKE, Inc. Form 10-K, fiscal 2026)
Media kit
All figures with value, unit, geography, segment, basis, period, source and evidence tier.
Four charts with source, scope and data type printed on each image. SVG versions are under each chart above.
The 15 citable statistics on one printable PDF.
Every source with year, sample, geography, tier, series ID and link.
Top 10 producers with exports, share exported and consumption, plus Italy and the US.
Ready-made citations below. Media and research enquiries go to info@urbanstylefootwear.com.
Cite this page
Suggested citation
UrbanStyle Footwear. “World’s Largest Footwear-Producing Countries: Production Rankings.” Updated October 26, 2026. https://urbanstylefootwear.com/largest-footwear-producing-countries/
APA style
Vahith, A. (2026, October 26). World’s largest footwear-producing countries: production rankings. UrbanStyle Footwear. https://urbanstylefootwear.com/largest-footwear-producing-countries/
Link (HTML)
<a href="https://urbanstylefootwear.com/largest-footwear-producing-countries/">Largest Footwear-Producing Countries by UrbanStyle Footwear</a>Click any citation, then press Ctrl+C (Cmd+C on Mac) to copy it.
For individual statistics, UrbanStyle recommends citing the original source listed in the source table whenever possible.
Data requests. Data correction or dataset request: info@urbanstylefootwear.com
Frequently asked questions
Which country produces the most shoes?
China, by far. It made 13,660 million pairs in 2025, 55.6% of the world total of 24.6 billion pairs, according to the World Footwear Yearbook 2026. That is more than four times India, the second-largest producer. See the production ranking.
What are the top 10 footwear-producing countries?
In 2025: China (13,660 million pairs), India (3,000 million), Vietnam (1,658 million), Brazil (848 million), Indonesia (782 million), Pakistan (627 million), Bangladesh (554 million), Türkiye (391 million), Cambodia (264 million) and Mexico (215 million). Together they made 89.5% of the world’s shoes.
How many pairs of shoes are made in the world each year?
About 24.6 billion pairs in 2025, by the World Footwear Yearbook 2026, up 0.1% on a revised 24.5 billion in 2024. The record before the pandemic was 24.3 billion in 2019, and output fell to about 20.5 billion in 2020.
Is India the second-largest shoe producer?
Yes. India made about 3 billion pairs in 2025, 12.2% of world output. Unlike China, it consumes most of what it makes, about 2.8 billion pairs, and exported only about 268 million pairs.
Is Vietnam the largest shoe producer?
No. Vietnam is third by pairs made (1,658 million in 2025) and second by exports. It looms large because big sportswear brands buy there: Nike made about 52% of its footwear in Vietnam in fiscal 2026.
Why do export rankings and production rankings differ?
Exports count shoes that cross a border, including re-exports. Production counts shoes made. India is second by production but exports only about 9% of its pairs, while Germany, Belgium and the Netherlands rank in the top 10 exporters but not in the top 10 producers. Italy even exported more pairs (205 million) than it made (118.4 million). See made for export or for home.
Where are Nike shoes made?
Mostly in Vietnam, Indonesia and China. Nike’s fiscal 2026 annual report says factories in those countries made about 52%, 27% and 16% of NIKE Brand footwear, across 95 contract factories in 11 countries. See where big brands make shoes.
Which countries are emerging footwear manufacturing hubs?
By share of world output, India and Vietnam gained most between 2019 and 2025 (India from 10.7% to 12.2%, Vietnam from 5.8% to 6.7%), and the Yearbook notes notable increases for Bangladesh and Cambodia in 2025. Indonesia lost share. See who is gaining.
How many shoes are made in the United States?
About 25 million pairs a year, according to the FDRA, against about 1.95 billion pairs consumed. Roughly 1% of shoes bought in the US are made there. See my New Balance Made in USA coverage for one brand that still does.
How many shoes does Italy produce?
Italy made 118.4 million pairs in 2025, down 5.4%, according to its manufacturers’ association, Assocalzaturifici. It is a much bigger player by value than by pairs, because its shoes sell at a high price per pair.
Which countries produce shoes outside Asia?
In the top 10, Brazil (848 million pairs), Türkiye (391 million) and Mexico (215 million). Asia made 88.7% of the world’s shoes in 2025. In Europe, Italy (118.4 million pairs) is the largest producer I have a figure for.
Is world shoe production growing?
Barely. It rose 0.1% in 2025 after a big rebound in 2024. Over 2019 to 2025 it went from 24.3 billion to 24.6 billion pairs, with a deep dip in 2020. See production over time.
How reliable are footwear production figures?
They are estimates. Few countries publish official counts of pairs made, so the World Footwear Yearbook models them, and it revises past years. Where national figures exist (Italy, Brazil, Mexico), they agree with it closely. See why production numbers disagree.
Can I use these statistics and download the data?
Yes, with credit to UrbanStyle Footwear, and cite the original source for any single statistic where you can. The CSV, XLSX, charts and a printable list of key statistics are in the media kit, with citation formats.