
Footwear Imports and Exports by Country: Global Trade Statistics
My family has been in footwear for four generations, from making shoes to selling them, so where shoes come from has always been part of the job. This page answers that question with trade data. I pulled every figure for 2025, the latest full year, straight from UN customs records where they exist, filled the gaps with the footwear industry’s own yearbook and national customs reports, and kept dollars, pairs and price per pair separate so nothing gets added that shouldn’t be. Every table names its source, and the data is free to download.
Six headline footwear trade numbers. Select one to see what it counts and where it comes from.
Select a topic above, for example “The switch”, to see what the number counts.
$46.2BChina exported $46.2B of footwear and parts in 2025, down 9.4% on 2024 (UN Comtrade, tier B). In pairs it shipped about 9.0 billion, 61.2% of the world total (World Footwear Yearbook, tier C).
over $24BVietnam's footwear exports passed $24 billion in 2025, up nearly 6% (Vietnam Customs via VOV, tier D). Vietnam is missing from the 2025 UN data, so many rankings leave it out.
$27.2BThe United States imported $27.2B of footwear in 2025, down 4.2% (UN Comtrade, tier B). Germany was second at $16.1B.
36% vs 26%In 2025 Vietnam supplied 36.1% of US footwear imports by value and China 26.1%. In 2019 China had 49.8% (my calculation from UN Comtrade, tier E).
$4.61 vs $63.67China's exported shoes averaged $4.61 a pair at the border in 2025, Italy's $63.67 (my calculation from UN Comtrade, tier E). That is customs value, not shop price.
$172BWorld footwear exports were worth $172 billion in 2025, up 1.6%, at an average $11.65 a pair (World Footwear Yearbook 2026 via APLF, tier D).
Each number names its source and evidence tier. All fifteen of my citable statistics are further down this page.
Footwear imports and exports at a glance
Quick answer. China is the world’s largest footwear exporter, with $46.2 billion of footwear and parts in 2025 and about 9.0 billion pairs (61.2% of world exports). Vietnam is second at over $24 billion, then Italy ($13.7 billion), Germany ($12.5 billion) and Indonesia ($8.0 billion). The United States is the largest importer at $27.2 billion, followed by Germany ($16.1 billion), France ($9.6 billion) and Italy ($8.8 billion). World footwear exports were worth about $172 billion in 2025. Values are 2025 customs data from UN Comtrade (HS chapter 64) unless stated.
This page covers trade: what crosses borders. Where shoes are actually made is a different question, and so is how much people spend on them at home. For the US market itself, see my US footwear market statistics and footwear spending statistics, and for everything else in the series, the footwear statistics hub.
Key findings
- World footwear exports were worth about $172 billion in 2025, up 1.6%, while the number of pairs exported was flat at roughly 14.7 billion. The average exported pair was worth $11.65.
- China exported $46.2 billion of footwear and parts in 2025, 9.4% less than in 2024. It still shipped 61.2% of the world’s exported pairs, down from 62.2% a year earlier and 69.1% a decade ago.
- Vietnam’s footwear exports passed $24 billion in 2025, second only to China. It is missing from the 2025 UN data, so rankings built only on that data leave out the world’s number two.
- The United States imported $27.2 billion of footwear in 2025, down 4.2%, and exported only $1.3 billion, a footwear trade deficit of about $25.9 billion.
- Vietnam supplied 36.1% of US footwear imports by value in 2025 and China 26.1%. In 2019 China had 49.8%. US imports from China fell 31.1% in 2025 alone.
- By pairs, China still leads in the US: about 948 million of the 1,986 million pairs the US imported in 2025 (47.8%), against 562 million from Vietnam. A US-bound pair from China averaged $7.36 at customs, one from Vietnam $17.39.
- Europe is the other big market. Germany imported $16.1 billion, France $9.6 billion and Italy $8.8 billion, and the EU bought $26.3 billion from outside the bloc, 35.5% of it from China and 28.7% from Vietnam.
- Value per pair splits the world in two. Exported shoes from China averaged $4.61 a pair at the border and from India $8.38, against $47.36 from France and $63.67 from Italy (my calculation from UN Comtrade).
- Germany, the Netherlands, Belgium and Hong Kong are trading hubs. They import shoes made elsewhere and send them on, which puts them high on both export and import lists.
- Trade weakened in early 2026: in the first quarter, US footwear imports fell 18.0% in value and China’s exports fell 17.6%, in euro terms.
What I noticed while putting this together
I started where I always start with trade questions: the UN Comtrade database, which holds the customs figures countries report to the UN. For 2025 it already had footwear exports for 119 countries when I read it in late October 2026. That’s the backbone of this page.
The first thing that jumped out was a hole at number two. Vietnam doesn’t appear in the 2025 UN data at all. If you build a ranking from it, Italy comes second, which is wrong. So I went to Vietnam’s own customs figure, as reported by state media in January 2026. Even there you have to be careful: the headline number of almost $29 billion is leather, footwear and bags together. Shoes alone were over $24 billion.
The second thing was the US switch. I worked out each supplier’s share of US footwear imports for every year from 2019. China had about half in 2019. In 2025 Vietnam was ahead by value, 36.1% to 26.1%. When I checked pairs, though, China still sent about 1.7 times as many. Both statements are true at once, and which one you quote changes the story.
I also checked my method against an outside source. When I added up Comtrade’s pair counts for China, Germany, Italy, India and Cambodia, they matched the World Footwear Yearbook’s figures to the million. That told me the Yearbook builds on the same customs records, and that the per-pair figures on this page stand on solid ground.
The figure that surprised me most was Germany. It is the world’s fourth-largest exporter by value and the second-largest importer. That’s not a factory story. It’s a warehouse story, and I explain it in re-export hubs below.
What footwear trade data can and can’t tell you
Here is where the evidence stands as of October 2026. Trade data is some of the best-documented data in this whole series, but it measures border crossings, not factories or shoppers.
| Question | Evidence status | Why |
|---|---|---|
| Export and import values by country, 2025 | Official data | Customs records in UN Comtrade for 119 reporting countries |
| Vietnam’s 2025 exports | Preliminary | Vietnam Customs figure via a news report; not yet in UN data |
| Pairs by exporting country | Good | Comtrade quantities and the Yearbook agree for the countries I checked |
| Who buys from whom (partner data) | Official data | Reported by both sides; the two sides can differ slightly |
| Average value per pair | Calculation | Customs value divided by pairs. Not a retail price or profit |
| Russia, UAE and Bangladesh imports or exports | Not reported for 2025 | Only visible through their partners’ records |
| Where shoes are made | Different measure | Exports include re-exports. Production needs production data |
| Full-year 2026 | Not yet available | Only first-quarter figures so far |
Four sources carry this page. Pick one to see what it records and where it falls short.
See what each data source covers and where it falls short
Choose a source to see what it records and how I would read it.
Select a source above.
UN Comtrade. 2019 to 2025. Customs records each country reports to the UN, in US dollars, with quantities in pairs at the four-digit level. It gives exports and imports for every reporter and every partner. How to read it: Official (tier B) and reproducible, but only for countries that report. Vietnam, Bangladesh, Russia and the UAE were missing from the 2025 data I read, and Comtrade fills some missing quantities with its own estimates.
World Footwear Yearbook. 2025 data, published 2026. APICCAPS, the Portuguese footwear association, builds a yearly picture of production, consumption and trade. It ranks exporters by pairs and gives the world value and average price. How to read it: Industry research (tier C). It fills gaps the UN data leaves, such as Vietnam, but the full book is paid and the free sample shows only some tables, so I quote the rest through trade press (tier D).
Vietnam Customs. 2025, preliminary. Vietnam's own export figure for footwear, reported by state media in January 2026: over $24 billion, up nearly 6%. How to read it: Preliminary and read through a news report (tier D). Watch the headline: "almost $29 billion" is leather, footwear and bags together, not shoes alone.
FDRA and USITC. US imports, 2025. The US footwear trade association's reading of US government import data: pairs by supplier, plus landed cost per pair. How to read it: Read through World Footwear (tier D). Its pair counts are close to UN Comtrade's but not identical, because the US agencies and the UN publish slightly different cuts of the same records.
15 footwear trade statistics you can cite
Each card has one number, one sentence of context and its source. “Copy text” opens a box with the sentence, the source and a link back here. Please cite the original source for any single statistic. Cards marked E are my calculations, and the method is on the card or in the dataset.
China exported $46.18B of footwear and parts (HS chapter 64) in 2025, down 9.4% from $50.98B in 2024, according to UN Comtrade.
Copy text
$46.2B China's footwear exports, 2025: China exported $46.18B of footwear and parts (HS chapter 64) in 2025, down 9.4% from $50.98B in 2024, according to UN Comtrade. Source: UN Comtrade (HS chapter 64; headings 6401 to 6406). Via UrbanStyle Footwear: https://urbanstylefootwear.com/footwear-imports-and-exports-by-country/
China shipped 9,016 million pairs in 2025, 61.2% of all footwear pairs exported worldwide, down from 62.2% in 2024 and 69.1% a decade earlier (World Footwear Yearbook 2026).
Copy text
61.2% of world exported pairs came from China: China shipped 9,016 million pairs in 2025, 61.2% of all footwear pairs exported worldwide, down from 62.2% in 2024 and 69.1% a decade earlier (World Footwear Yearbook 2026). Source: World Footwear Yearbook 2026 (Tables 1 and 3). Via UrbanStyle Footwear: https://urbanstylefootwear.com/footwear-imports-and-exports-by-country/
Vietnam's footwear exports passed $24 billion in 2025, up nearly 6%, by preliminary customs data. The often-quoted $29 billion includes leather goods and bags.
Copy text
over $24B Vietnam's footwear exports, 2025: Vietnam's footwear exports passed $24 billion in 2025, up nearly 6%, by preliminary customs data. The often-quoted $29 billion includes leather goods and bags. Source: Vietnam Customs via VOV, Jan 2026. Via UrbanStyle Footwear: https://urbanstylefootwear.com/footwear-imports-and-exports-by-country/
The United States imported $27.19B of footwear in 2025, the most of any country and 4.2% less than in 2024 (UN Comtrade).
Copy text
$27.2B US footwear imports, 2025: The United States imported $27.19B of footwear in 2025, the most of any country and 4.2% less than in 2024 (UN Comtrade). Source: UN Comtrade (HS chapter 64; headings 6401 to 6406). Via UrbanStyle Footwear: https://urbanstylefootwear.com/footwear-imports-and-exports-by-country/
By value, Vietnam supplied 36.1% of US footwear imports in 2025 ($9.82B) and China 26.1% ($7.08B), the first year in this series that Vietnam led (my calculation from UN Comtrade).
Copy text
36.1% of US footwear imports came from Vietnam: By value, Vietnam supplied 36.1% of US footwear imports in 2025 ($9.82B) and China 26.1% ($7.08B), the first year in this series that Vietnam led (my calculation from UN Comtrade). Source: UrbanStyle calculation. Via UrbanStyle Footwear: https://urbanstylefootwear.com/footwear-imports-and-exports-by-country/
China's share of US footwear import value fell from 49.8% in 2019 to 26.1% in 2025, and US imports from China fell 31.1% in 2025 alone (my calculation from UN Comtrade).
Copy text
49.8% to 26.1% China's share of US footwear imports, 2019 to 2025: China's share of US footwear import value fell from 49.8% in 2019 to 26.1% in 2025, and US imports from China fell 31.1% in 2025 alone (my calculation from UN Comtrade). Source: UrbanStyle calculation. Via UrbanStyle Footwear: https://urbanstylefootwear.com/footwear-imports-and-exports-by-country/
China still supplied 948 million of the 1,986 million pairs the US imported in 2025 (47.8%), against 562 million from Vietnam (UN Comtrade, complete footwear).
Copy text
48% of US-imported pairs still came from China: China still supplied 948 million of the 1,986 million pairs the US imported in 2025 (47.8%), against 562 million from Vietnam (UN Comtrade, complete footwear). Source: UN Comtrade (HS chapter 64; headings 6401 to 6406). Via UrbanStyle Footwear: https://urbanstylefootwear.com/footwear-imports-and-exports-by-country/
US imports from China averaged $7.36 a pair in 2025 (including freight and insurance) and imports from Vietnam $17.39, so Vietnam leads on value while China leads on pairs (my calculation from UN Comtrade).
Copy text
$7.36 vs $17.39 value per pair of US imports, China and Vietnam: US imports from China averaged $7.36 a pair in 2025 (including freight and insurance) and imports from Vietnam $17.39, so Vietnam leads on value while China leads on pairs (my calculation from UN Comtrade). Source: UrbanStyle calculation. Via UrbanStyle Footwear: https://urbanstylefootwear.com/footwear-imports-and-exports-by-country/
World footwear exports were worth $172 billion in 2025, up 1.6%, while the number of pairs exported slipped 0.1% (World Footwear Yearbook 2026, as reported by APLF).
Copy text
$172B world footwear exports, 2025: World footwear exports were worth $172 billion in 2025, up 1.6%, while the number of pairs exported slipped 0.1% (World Footwear Yearbook 2026, as reported by APLF). Source: APLF on the Yearbook, Aug 2026. Via UrbanStyle Footwear: https://urbanstylefootwear.com/footwear-imports-and-exports-by-country/
The average exported pair was worth $11.65 in 2025: $34.76 for pairs exported from Europe and $8.02 from Asia (World Footwear Yearbook 2026, as reported by APLF).
Copy text
$11.65 average export price per pair, world: The average exported pair was worth $11.65 in 2025: $34.76 for pairs exported from Europe and $8.02 from Asia (World Footwear Yearbook 2026, as reported by APLF). Source: APLF on the Yearbook, Aug 2026. Via UrbanStyle Footwear: https://urbanstylefootwear.com/footwear-imports-and-exports-by-country/
Italy's exported footwear averaged $63.67 a pair at the border in 2025 and China's $4.61, a ratio of about 14 to 1 (my calculation from UN Comtrade, complete footwear only).
Copy text
$63.67 vs $4.61 export value per pair, Italy and China: Italy's exported footwear averaged $63.67 a pair at the border in 2025 and China's $4.61, a ratio of about 14 to 1 (my calculation from UN Comtrade, complete footwear only). Source: UrbanStyle calculation. Via UrbanStyle Footwear: https://urbanstylefootwear.com/footwear-imports-and-exports-by-country/
Germany imported $16.07B of footwear in 2025, second only to the US and up 19.7% in dollar terms, while also exporting $12.54B (UN Comtrade).
Copy text
$16.1B Germany's footwear imports, 2025: Germany imported $16.07B of footwear in 2025, second only to the US and up 19.7% in dollar terms, while also exporting $12.54B (UN Comtrade). Source: UN Comtrade (HS chapter 64; headings 6401 to 6406). Via UrbanStyle Footwear: https://urbanstylefootwear.com/footwear-imports-and-exports-by-country/
The EU imported $26.3B of footwear from outside the bloc in 2025, 35.5% of it from China and 28.7% from Vietnam (my calculation from UN Comtrade).
Copy text
36% and 29% of EU footwear imports from China and Vietnam: The EU imported $26.3B of footwear from outside the bloc in 2025, 35.5% of it from China and 28.7% from Vietnam (my calculation from UN Comtrade). Source: UrbanStyle calculation. Via UrbanStyle Footwear: https://urbanstylefootwear.com/footwear-imports-and-exports-by-country/
China's footwear exports to the US fell 27.6% in 2025 to $7.16B. The US still took 15.5% of China's footwear exports, ahead of Russia at $2.78B (UN Comtrade, China-reported).
Copy text
27.6% drop in China's footwear exports to the US, 2025: China's footwear exports to the US fell 27.6% in 2025 to $7.16B. The US still took 15.5% of China's footwear exports, ahead of Russia at $2.78B (UN Comtrade, China-reported). Source: UN Comtrade (HS chapter 64; headings 6401 to 6406). Via UrbanStyle Footwear: https://urbanstylefootwear.com/footwear-imports-and-exports-by-country/
In the first quarter of 2026, US footwear imports fell 18.0% in value and 11.8% in pairs from a year earlier, and China's exports fell 17.6% in value (World Footwear, euro figures).
Copy text
minus 18% US footwear imports, early 2026: In the first quarter of 2026, US footwear imports fell 18.0% in value and 11.8% in pairs from a year earlier, and China's exports fell 17.6% in value (World Footwear, euro figures). Source: World Footwear, Jun 2026. Via UrbanStyle Footwear: https://urbanstylefootwear.com/footwear-imports-and-exports-by-country/
Which countries export the most footwear?
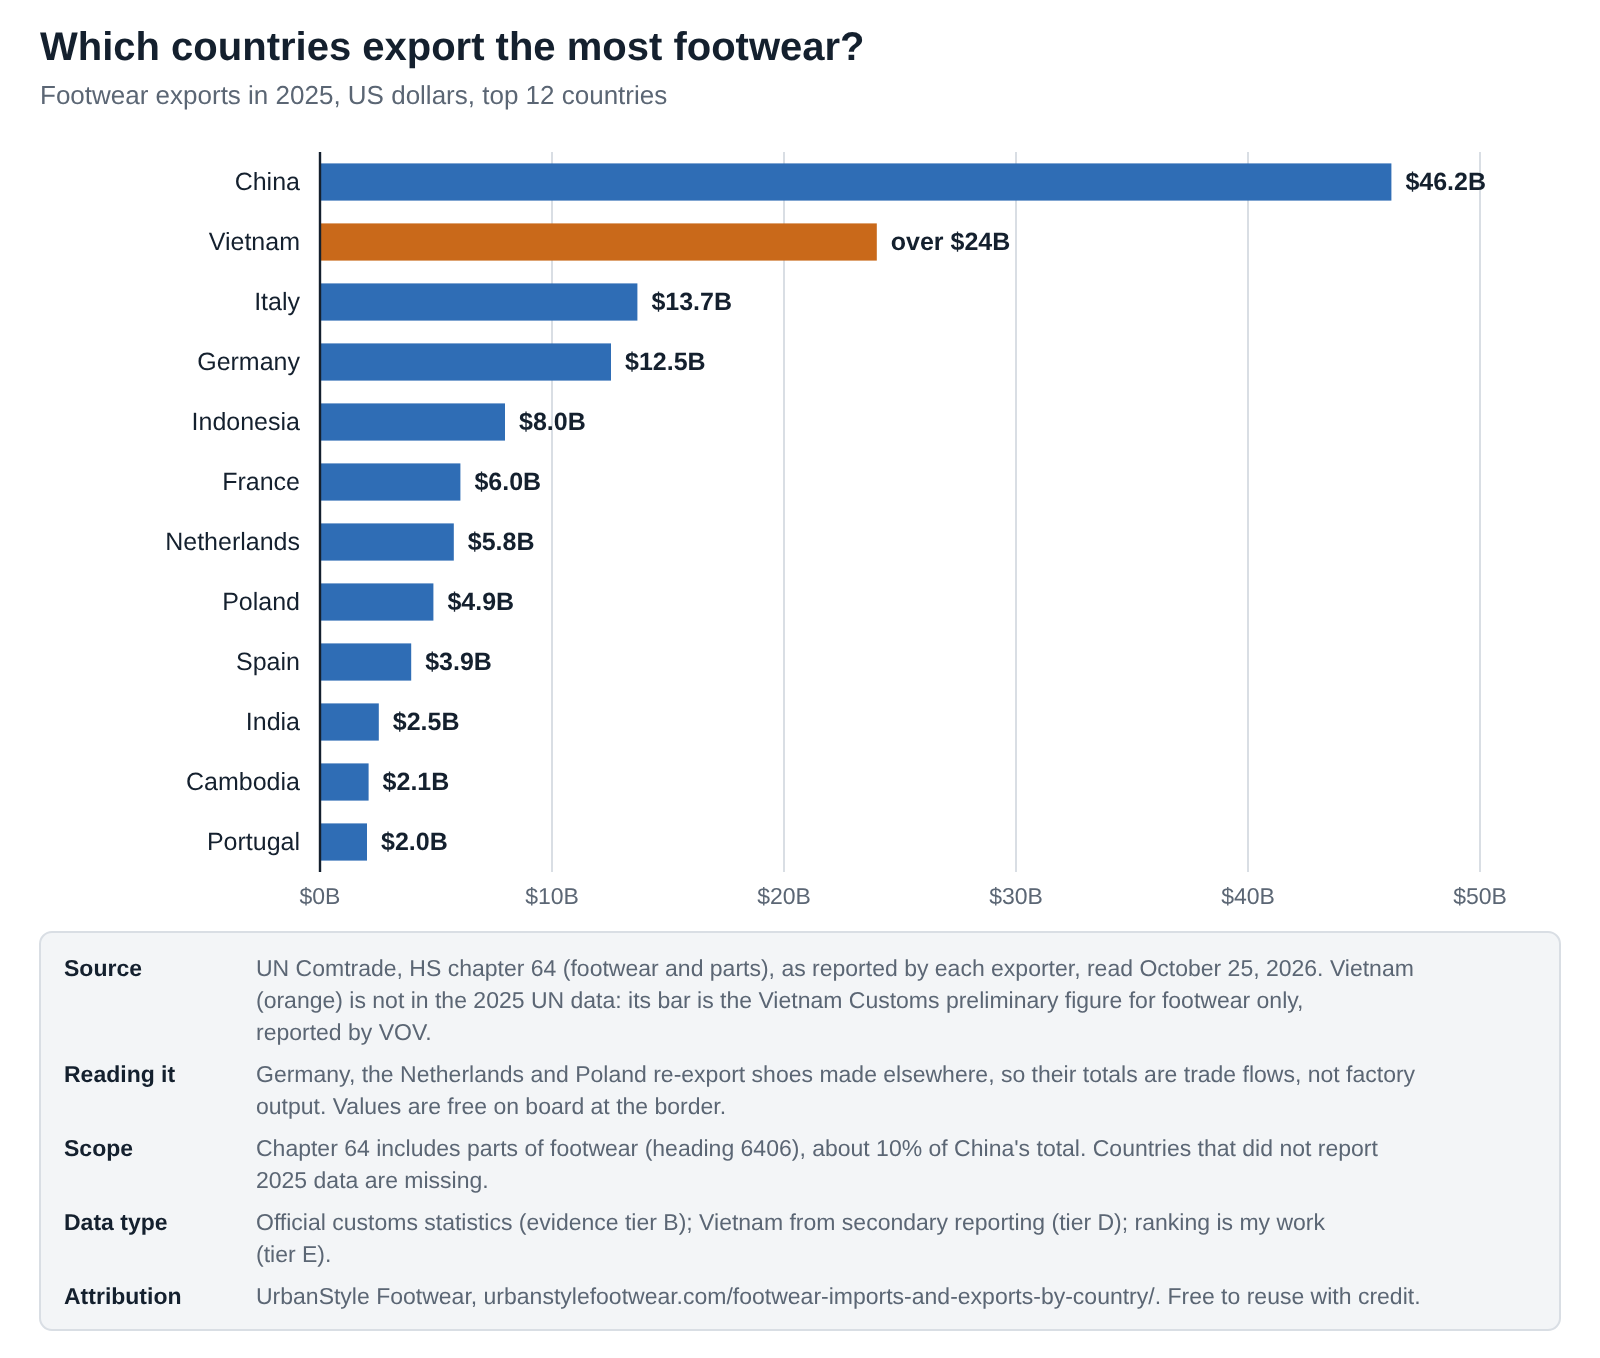
Short answer. In 2025 the top five footwear exporters by value were China ($46.2 billion), Vietnam (over $24 billion), Italy ($13.7 billion), Germany ($12.5 billion) and Indonesia ($8.0 billion). China exported almost twice as much as Vietnam.
The ranking below uses HS chapter 64, the customs chapter for footwear, as each country reported it to the UN. Vietnam is the one exception, and its row is marked.
Embed this chart
<figure style="margin:0"><a href="https://urbanstylefootwear.com/footwear-imports-and-exports-by-country/"><img src="https://urbanstylefootwear.com/wp-content/uploads/2026/10/usf-top-footwear-exporting-countries-2025.png" alt="Bar chart of 2025 footwear exports: China 46.2 billion dollars, Vietnam over 24, Italy 13.7, Germany 12.5" width="800" style="max-width:100%;height:auto"></a><figcaption>Source: UrbanStyle Footwear, based on UN Comtrade (HS 64) and Vietnam Customs via VOV. <a href="https://urbanstylefootwear.com/footwear-imports-and-exports-by-country/">Footwear Imports and Exports by Country</a></figcaption></figure>Click the code, press Ctrl+C (Cmd+C on Mac), and paste it into any web page. Please keep the attribution link.
View as table
| Rank | Country | Exports 2025, USD billion | Exports 2024, USD billion | Change | Source |
|---|---|---|---|---|---|
| 1 | China | 46.18 | 50.98 | -9.4% | UN Comtrade |
| 2 | Vietnam | 24.00 | 22.80 | +5.3% | Vietnam Customs via VOV (more than 24) |
| 3 | Italy | 13.68 | 13.49 | +1.5% | UN Comtrade |
| 4 | Germany | 12.54 | 11.62 | +7.9% | UN Comtrade |
| 5 | Indonesia | 7.98 | 7.28 | +9.5% | UN Comtrade |
| 6 | France | 6.05 | 5.98 | +1.2% | UN Comtrade |
| 7 | Netherlands | 5.77 | 5.43 | +6.2% | UN Comtrade |
| 8 | Poland | 4.89 | 3.97 | +23.2% | UN Comtrade |
| 9 | Spain | 3.93 | 3.79 | +3.6% | UN Comtrade |
| 10 | India | 2.53 | 2.46 | +2.9% | UN Comtrade |
| 11 | Cambodia | 2.09 | 1.68 | +24.5% | UN Comtrade |
| 12 | Portugal | 2.03 | 1.86 | +8.9% | UN Comtrade |
| Rank | Country | Exports 2025, USD billion | Exports 2024, USD billion | Change |
|---|---|---|---|---|
| 1 | China | 46.18 | 50.98 | -9.4% |
| 2 | Vietnam * | more than 24 | 22.8 | about +6% |
| 3 | Italy | 13.68 | 13.49 | +1.5% |
| 4 | Germany | 12.54 | 11.62 | +7.9% |
| 5 | Indonesia | 7.98 | 7.28 | +9.5% |
| 6 | France | 6.05 | 5.98 | +1.2% |
| 7 | Netherlands | 5.77 | 5.43 | +6.2% |
| 8 | Poland | 4.89 | 3.97 | +23.2% |
| 9 | Spain | 3.93 | 3.79 | +3.6% |
| 10 | India | 2.53 | 2.46 | +2.9% |
| 11 | Cambodia | 2.09 | 1.68 | +24.5% |
| 12 | Portugal | 2.03 | 1.86 | +8.9% |
| 13 | Hong Kong | 1.88 | 1.92 | -1.9% |
| 14 | Czechia | 1.47 | 1.32 | +11.2% |
| 15 | United States | 1.30 | 1.40 | -7.5% |
Three things stand out to me. China’s exports fell 9.4% in a year, and most of that fall was the US market, which I come to below. Cambodia (up 24.5%) and Poland (up 23.2%) grew fastest in the top 12. And Italy, with a fraction of China’s pairs, is the world’s third-largest exporter by value because its shoes sell at a much higher price per pair.
What you can safely say. “China exported $46.2 billion of footwear and parts in 2025 (UN Comtrade), and Vietnam over $24 billion (Vietnam Customs).” Say that Vietnam’s figure is preliminary and from a different source, and that chapter 64 includes parts.
Which countries export the most pairs of shoes?
Short answer. China shipped 9,016 million pairs in 2025, 61.2% of the world total. Vietnam was second with 1,658 million (11.2%) and Indonesia third with 585 million (4.0%). The top 10 countries shipped 88% of all exported pairs.
Counting pairs gives a different picture from counting dollars. Italy drops from third to ninth, and Germany, Belgium and the Netherlands appear because of the volume they re-export.
| Rank | Country | Exports 2025, million pairs | Share of world pairs |
|---|---|---|---|
| 1 | China | 9,016 | 61.2% |
| 2 | Vietnam | 1,658 | 11.2% |
| 3 | Indonesia | 585 | 4.0% |
| 4 | Germany | 365 | 2.5% |
| 5 | India | 268 | 1.8% |
| 6 | Cambodia | 253 | 1.7% |
| 7 | Belgium | 227 | 1.5% |
| 8 | Netherlands | 220 | 1.5% |
| 9 | Italy | 205 | 1.4% |
| 10 | Türkiye | 184 | 1.2% |
| Top 10 | 12,980 | 88.0% |
Asia shipped 84.3% of the world’s exported pairs and Europe 13.1%. China’s share has been falling slowly, from 69.1% a decade ago to 62.2% in 2024 and 61.2% in 2025, and Vietnam has taken most of that ground.
Source: World Footwear Yearbook 2026, Table 3, published by APICCAPS (tier C). The world total of about 14.7 billion pairs is my calculation from China’s count and share (tier E).Which countries import the most footwear?
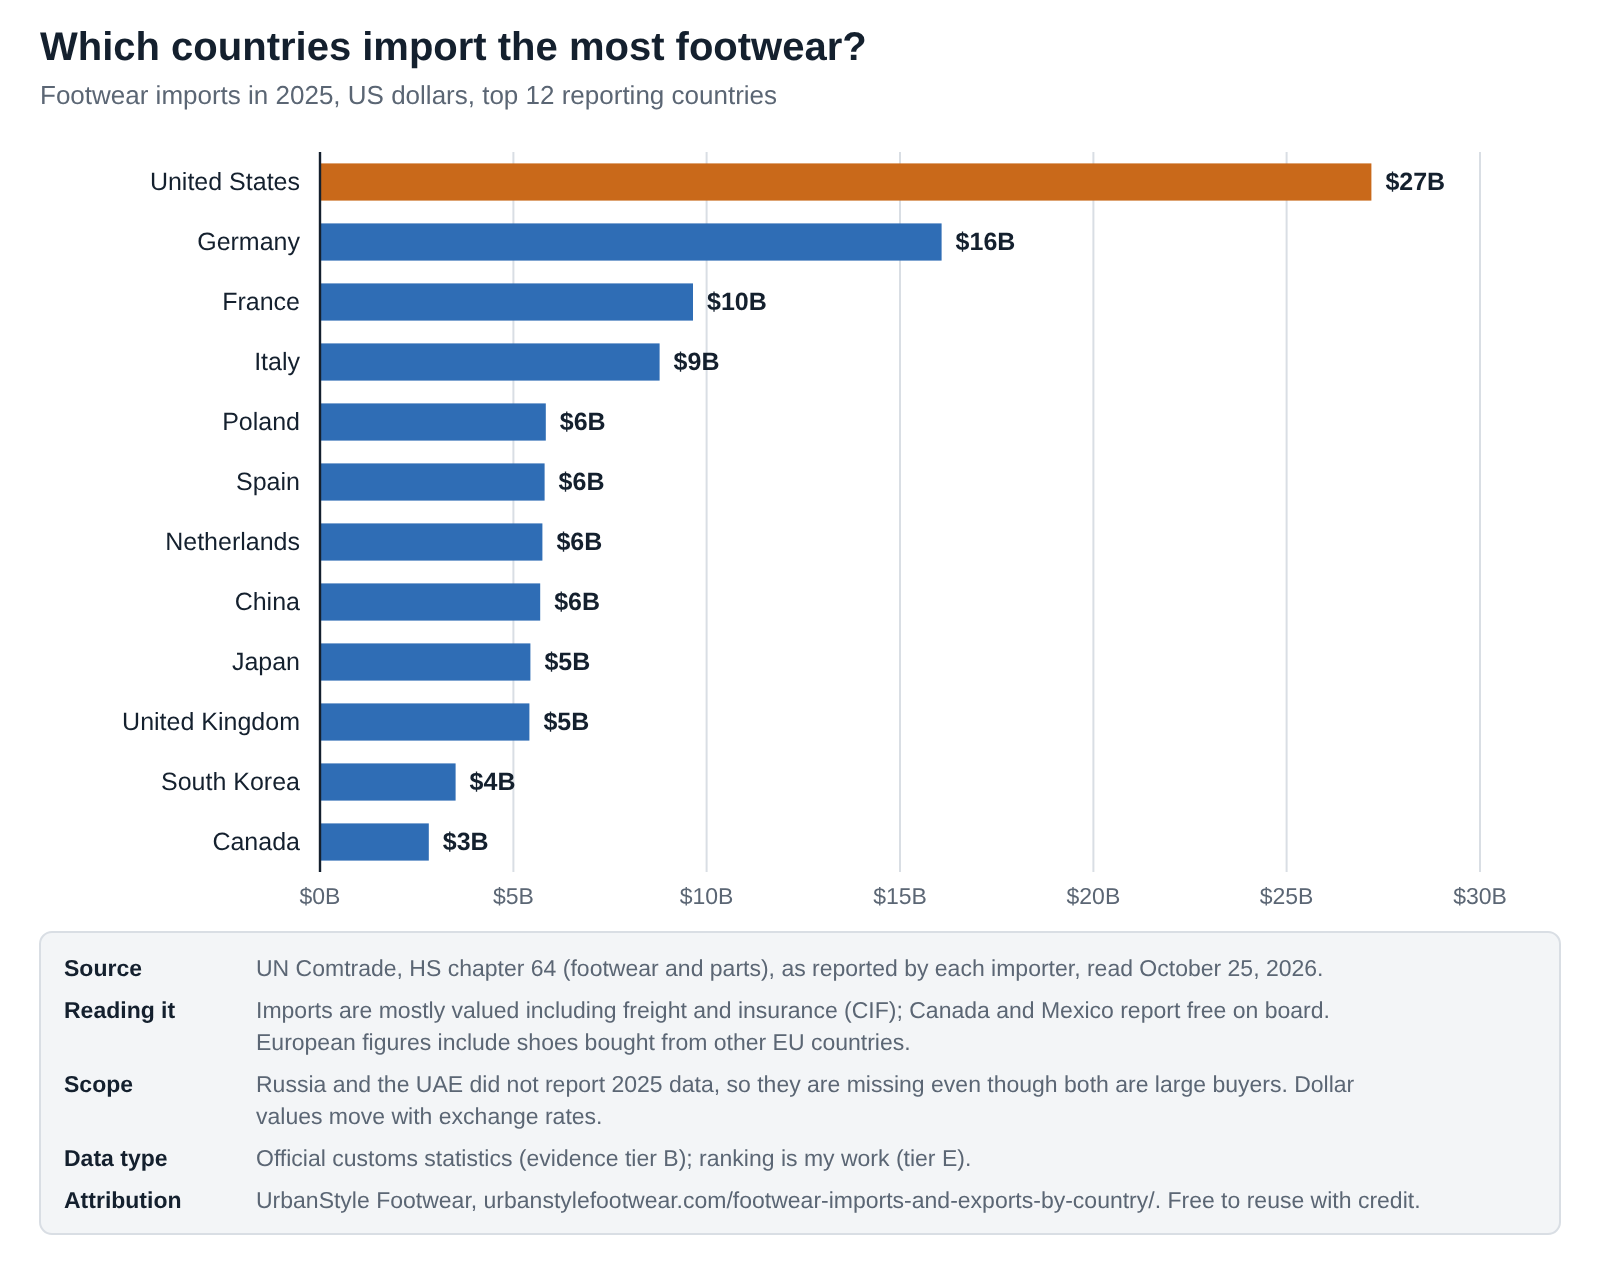
Short answer. The United States imported $27.2 billion of footwear in 2025, the most of any country. Germany ($16.1 billion), France ($9.6 billion), Italy ($8.8 billion) and Poland ($5.8 billion) followed.
Import rankings are dominated by rich consumer markets and European distribution hubs. Seven of the top 12 are in Europe.
Embed this chart
<figure style="margin:0"><a href="https://urbanstylefootwear.com/footwear-imports-and-exports-by-country/"><img src="https://urbanstylefootwear.com/wp-content/uploads/2026/10/usf-top-footwear-importing-countries-2025.png" alt="Bar chart of 2025 footwear imports: United States 27.2 billion dollars, Germany 16.1, France 9.6, Italy 8.8" width="800" style="max-width:100%;height:auto"></a><figcaption>Source: UrbanStyle Footwear, based on UN Comtrade (HS 64). <a href="https://urbanstylefootwear.com/footwear-imports-and-exports-by-country/">Footwear Imports and Exports by Country</a></figcaption></figure>Click the code, press Ctrl+C (Cmd+C on Mac), and paste it into any web page. Please keep the attribution link.
View as table
| Rank | Country | Imports 2025, USD billion | Imports 2024, USD billion | Change | Source |
|---|---|---|---|---|---|
| 1 | United States | 27.19 | 28.39 | -4.2% | UN Comtrade |
| 2 | Germany | 16.07 | 13.43 | +19.7% | UN Comtrade |
| 3 | France | 9.64 | 9.11 | +5.9% | UN Comtrade |
| 4 | Italy | 8.78 | 8.73 | +0.6% | UN Comtrade |
| 5 | Poland | 5.84 | 4.92 | +18.6% | UN Comtrade |
| 6 | Spain | 5.81 | 5.14 | +12.9% | UN Comtrade |
| 7 | Netherlands | 5.75 | 5.25 | +9.5% | UN Comtrade |
| 8 | China | 5.70 | 6.21 | -8.2% | UN Comtrade |
| 9 | Japan | 5.44 | 4.86 | +12.1% | UN Comtrade |
| 10 | United Kingdom | 5.42 | 5.25 | +3.1% | UN Comtrade |
| 11 | South Korea | 3.51 | 3.63 | -3.3% | UN Comtrade |
| 12 | Canada | 2.82 | 2.53 | +11.2% | UN Comtrade |
| Rank | Country | Imports 2025, USD billion | Imports 2024, USD billion | Change |
|---|---|---|---|---|
| 1 | United States | 27.19 | 28.39 | -4.2% |
| 2 | Germany | 16.07 | 13.43 | +19.7% |
| 3 | France | 9.64 | 9.11 | +5.9% |
| 4 | Italy | 8.78 | 8.73 | +0.6% |
| 5 | Poland | 5.84 | 4.92 | +18.6% |
| 6 | Spain | 5.81 | 5.14 | +12.9% |
| 7 | Netherlands | 5.75 | 5.25 | +9.5% |
| 8 | China | 5.70 | 6.21 | -8.2% |
| 9 | Japan | 5.44 | 4.86 | +12.1% |
| 10 | United Kingdom | 5.42 | 5.25 | +3.1% |
| 11 | South Korea | 3.51 | 3.63 | -3.3% |
| 12 | Canada | 2.82 | 2.53 | +11.2% |
| 13 | Austria | 2.72 | 2.49 | +9.2% |
| 14 | Switzerland | 2.49 | 2.33 | +7.0% |
| 15 | Mexico | 2.25 | 2.16 | +3.9% |
US imports fell 4.2% in 2025 while most European importers grew, Germany by 19.7% and Poland by 18.6% in dollar terms. Part of Europe’s rise is the currency: these are dollar values, so when the euro gains against the dollar, European trade looks bigger in dollars even with the same number of shoes. I’d read the direction, not the exact size, of the European changes. Russia and the UAE are large buyers but did not report 2025 data, so they don’t appear.
What you can safely say. “The United States imported $27.2 billion of footwear in 2025, the most of any country, according to UN Comtrade.” Add that European imports include trade between EU countries.
Footwear imports and exports by country: the full table
This table puts both directions side by side for the 28 countries I pulled, with the balance (exports minus imports). Filter it by region. A positive balance means a country sells more footwear abroad than it buys.
| Country | Region | Exports 2025, $B | Imports 2025, $B | Balance, $B |
|---|---|---|---|---|
| China | Asia | 46.18 | 5.70 | +40.48 |
| Vietnam * | Asia | more than 24 | not reported | n/a |
| Italy | Europe | 13.68 | 8.78 | +4.90 |
| Germany | Europe | 12.54 | 16.07 | -3.53 |
| Indonesia | Asia | 7.98 | 1.32 | +6.66 |
| France | Europe | 6.05 | 9.64 | -3.60 |
| Netherlands | Europe | 5.77 | 5.75 | +0.02 |
| Poland | Europe | 4.89 | 5.84 | -0.95 |
| Spain | Europe | 3.93 | 5.81 | -1.88 |
| India | Asia | 2.53 | 0.58 | +1.95 |
| Cambodia | Asia | 2.09 | not reported | n/a |
| Portugal | Europe | 2.03 | 1.21 | +0.82 |
| Hong Kong | Asia | 1.88 | 1.89 | -0.01 |
| Czechia | Europe | 1.47 | 1.88 | -0.40 |
| United States | Americas | 1.30 | 27.19 | -25.90 |
| Austria | Europe | 1.20 | 2.72 | -1.53 |
| Romania | Europe | 1.20 | 1.47 | -0.28 |
| Slovakia | Europe | 1.07 | 1.40 | -0.33 |
| Brazil | Americas | 1.06 | 0.66 | +0.40 |
| Türkiye | Europe | 1.01 | 1.68 | -0.67 |
| Mexico | Americas | 0.90 | 2.25 | -1.35 |
| Switzerland | Europe | 0.88 | 2.49 | -1.61 |
| United Kingdom | Europe | 0.82 | 5.42 | -4.59 |
| Belgium | Europe | 0.73 | 1.19 | -0.46 |
| South Korea | Asia | 0.37 | 3.51 | -3.14 |
| Canada | Americas | 0.19 | 2.82 | -2.62 |
| Australia | Oceania | 0.12 | 2.06 | -1.94 |
| Japan | Asia | 0.09 | 5.44 | -5.36 |
The two ends tell the story. China ran a footwear trade surplus of about $40.5 billion in 2025, Indonesia $6.7 billion and Italy $4.9 billion. The United States ran a deficit of about $25.9 billion, followed by Japan ($5.4 billion) and the UK ($4.6 billion). The Netherlands and Hong Kong are almost exactly balanced, which is what a pure trading hub looks like.
Source: UN Comtrade, HS 64, 2025 (tier B); Vietnam from Vietnam Customs via VOV (tier D). Balances are my calculation (tier E). Export and import values use different valuations, so a balance is a guide, not an exact figure.Where does the United States import its shoes from?
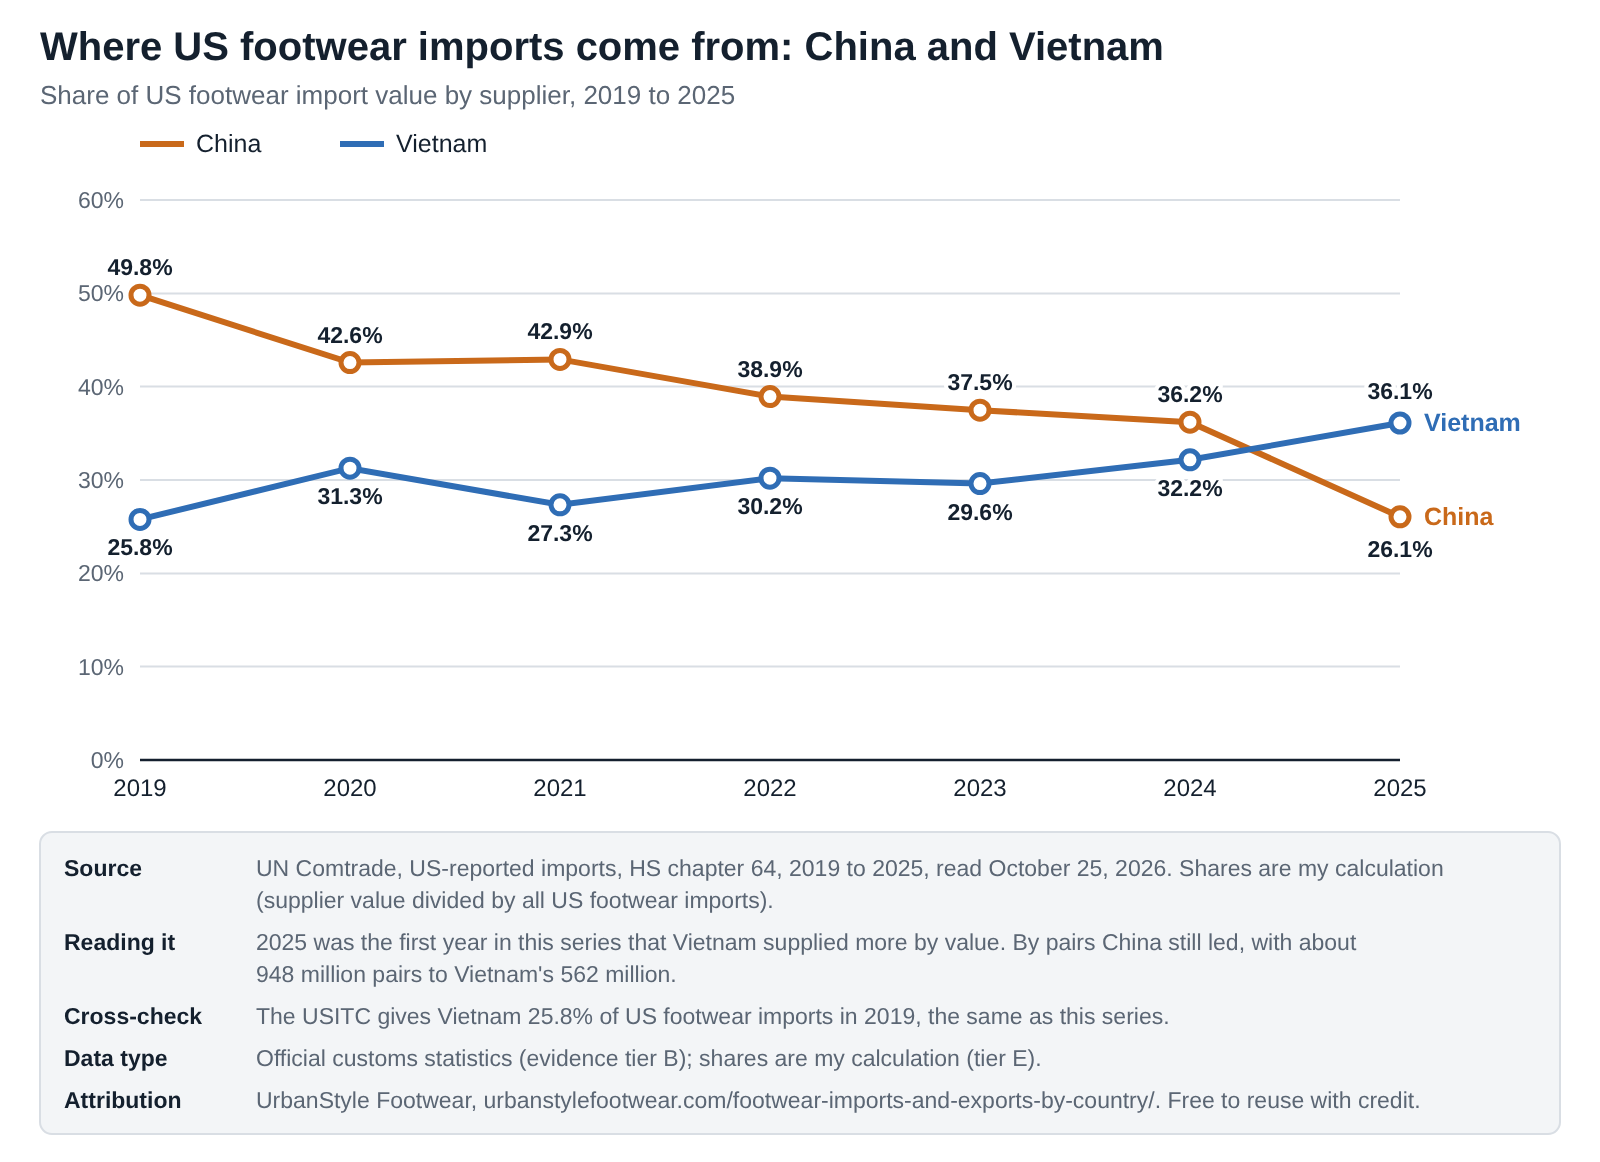
Short answer. By value in 2025: Vietnam $9.8 billion (36.1%), China $7.1 billion (26.1%), Indonesia $3.1 billion (11.3%), Italy $2.0 billion (7.4%) and Cambodia $1.4 billion (5.1%). By pairs, China still leads with about 948 million of 1,986 million pairs.
The US is the biggest single market, and its supplier mix has changed faster than anyone’s. The chart tracks China’s and Vietnam’s shares of US import value since 2019.
Embed this chart
<figure style="margin:0"><a href="https://urbanstylefootwear.com/footwear-imports-and-exports-by-country/"><img src="https://urbanstylefootwear.com/wp-content/uploads/2026/10/usf-us-footwear-imports-china-vs-vietnam-share.png" alt="Line chart of US footwear import shares: China falls from 49.8% in 2019 to 26.1% in 2025, Vietnam rises to 36.1%" width="800" style="max-width:100%;height:auto"></a><figcaption>Source: UrbanStyle Footwear, based on UN Comtrade, US-reported imports (UrbanStyle calculation). <a href="https://urbanstylefootwear.com/footwear-imports-and-exports-by-country/">Footwear Imports and Exports by Country</a></figcaption></figure>Click the code, press Ctrl+C (Cmd+C on Mac), and paste it into any web page. Please keep the attribution link.
View as table
| Year | US imports, USD billion | From China, USD billion | China share | From Vietnam, USD billion | Vietnam share |
|---|---|---|---|---|---|
| 2019 | 28.19 | 14.04 | 49.8% | 7.27 | 25.8% |
| 2020 | 21.51 | 9.16 | 42.6% | 6.73 | 31.3% |
| 2021 | 28.64 | 12.29 | 42.9% | 7.83 | 27.3% |
| 2022 | 37.97 | 14.78 | 38.9% | 11.46 | 30.2% |
| 2023 | 26.79 | 10.04 | 37.5% | 7.94 | 29.6% |
| 2024 | 28.39 | 10.28 | 36.2% | 9.13 | 32.2% |
| 2025 | 27.19 | 7.08 | 26.1% | 9.82 | 36.1% |
China’s share fell from 49.8% in 2019 to 36.2% in 2024, then dropped to 26.1% in 2025 as US imports from China fell 31.1% in a single year. Vietnam rose from 25.8% to 36.1%. Cambodia grew 49.9% and Bangladesh 56.6%, from smaller bases. My US footwear market statistics page covers the tariff timeline behind some of this.
Pairs tell the other half. I split 2025 US imports of complete shoes by supplier:
| Supplier | Value, USD billion | Pairs, million | Share of pairs | Value per pair |
|---|---|---|---|---|
| China | 6.98 | 948 | 47.8% | $7.36 |
| Vietnam | 9.77 | 562 | 28.3% | $17.39 |
| Indonesia | 3.06 | 192 | 9.7% | $15.91 |
| Cambodia | 1.40 | 106 | 5.3% | $13.15 |
| India | 0.53 | 37 | 1.9% | $14.17 |
| Italy | 2.02 | 19 | 1.0% | $105.18 |
| All suppliers | 26.91 | 1,986 | 100% | $13.55 |
A pair from China averaged $7.36 including freight and insurance, a pair from Vietnam $17.39 and a pair from Italy $105.18. China ships far more pairs at a lower value per pair, and Vietnam fewer pairs at more than twice the value. FDRA, the US footwear trade association, reports similar pair counts from US government data (China 964 million, Vietnam 574 million) and an average landed cost of $21.17 for Vietnamese shoes. Landed cost also includes US duty, which is why it is higher than the values here, which include freight and insurance but not duty.
What you can safely say. “In 2025 Vietnam overtook China as the largest supplier of US footwear imports by value, 36.1% to 26.1%, though China still supplied more pairs.” (UrbanStyle calculation from UN Comtrade)
Where does China export its footwear?
Short answer. The United States is still China’s biggest footwear market at $7.2 billion in 2025, but that was 27.6% less than in 2024. Russia ($2.8 billion), Vietnam ($2.2 billion), Japan ($1.9 billion) and Germany ($1.5 billion) follow.
China’s export figures for its own top markets show where its 9.4% fall came from.
| Market | China exports 2025, USD billion | 2024 | Change |
|---|---|---|---|
| United States | 7.16 | 9.90 | -27.6% |
| Russia | 2.78 | 2.96 | -5.9% |
| Vietnam | 2.17 | 2.17 | -0.3% |
| Japan | 1.92 | 1.88 | +2.5% |
| Germany | 1.53 | 1.49 | +2.4% |
| United Kingdom | 1.32 | 1.40 | -5.8% |
| Kyrgyzstan | 1.22 | 1.04 | +17.0% |
| Philippines | 1.07 | 1.19 | -10.5% |
| South Korea | 1.02 | 1.21 | -15.4% |
| Kazakhstan | 0.98 | 1.41 | -30.2% |
| Malaysia | 0.98 | 1.16 | -15.5% |
| Netherlands | 0.98 | 0.94 | +4.7% |
| Indonesia | 0.98 | 0.97 | +1.1% |
| Italy | 0.95 | 0.95 | +0.3% |
| UAE | 0.88 | 1.03 | -14.6% |
The US fall ($2.7 billion) accounts for more than half of China’s total drop of $4.8 billion. Kazakhstan fell 30.2% and South Korea 15.4%, while Kyrgyzstan rose 17.0%. Russia is notable because it publishes no trade data of its own, so China’s export records are the clearest view of its footwear imports.
Source: UN Comtrade, China-reported exports by partner, HS 64, 2024 and 2025 (tier B). Changes are my calculations (tier E).Where does Europe import its footwear from?
Short answer. The EU imported $26.3 billion of footwear from outside the bloc in 2025, up 9.9%. China supplied 35.5% and Vietnam 28.7%, followed by Indonesia (7.1%) and India (4.7%).
Most of the trade in the European import rankings is between EU members. Taking only imports from outside the EU shows who really supplies the European market.
| Supplier | EU imports 2025, USD billion | Share | 2024 | Change |
|---|---|---|---|---|
| China | 9.34 | 35.5% | 8.45 | +10.5% |
| Vietnam | 7.54 | 28.7% | 6.48 | +16.3% |
| Indonesia | 1.87 | 7.1% | 1.73 | +7.9% |
| India | 1.23 | 4.7% | 1.19 | +3.1% |
| Cambodia | 0.80 | 3.1% | n/a | n/a |
| Bangladesh | 0.55 | 2.1% | n/a | n/a |
| Türkiye | 0.35 | 1.3% | n/a | n/a |
| All non-EU suppliers | 26.30 | 100% | 23.93 | +9.9% |
China is a bigger share of Europe’s imports (35.5%) than of America’s (26.1%), and its EU sales grew 10.5% in 2025 while its US sales fell. I’d be careful not to read that as shoes being diverted from one market to the other, because exchange rates move dollar values of EU trade. The EU also exported $17.1 billion of footwear outside the bloc, $3.4 billion of it to the US.
Source: UN Comtrade, European Union extra-EU trade, HS 64, 2024 and 2025 (tier B). Shares and changes are my calculations (tier E).What is the average export value of a pair of shoes by country?
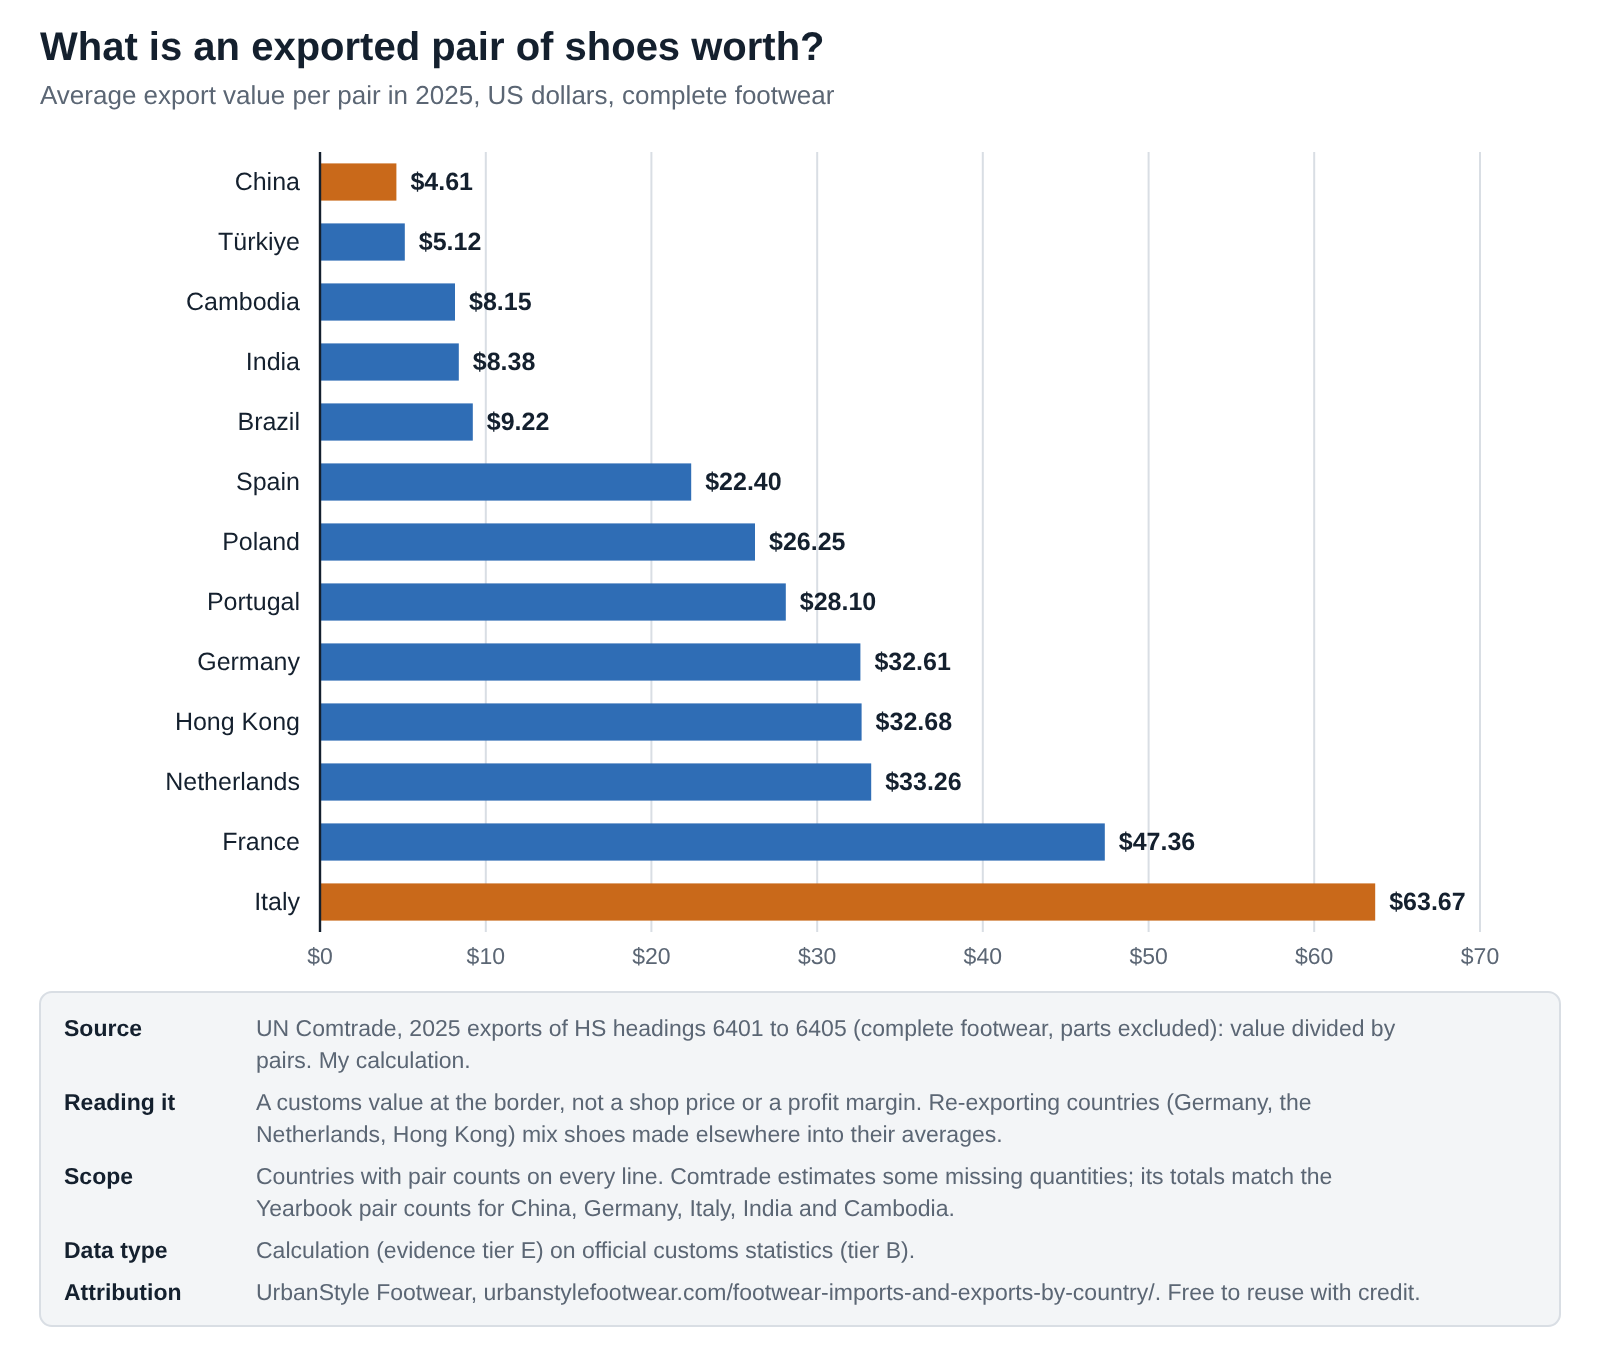
Short answer. Worldwide, $11.65 a pair in 2025. By country it ranges from about $4.61 for China and $8.38 for India to $47.36 for France and $63.67 for Italy. These are customs values at the border, not shop prices.
I divided each country’s 2025 export value for complete footwear by the number of pairs, using the same Comtrade records. Parts are left out so the pairs and the dollars cover the same goods.
Embed this chart
<figure style="margin:0"><a href="https://urbanstylefootwear.com/footwear-imports-and-exports-by-country/"><img src="https://urbanstylefootwear.com/wp-content/uploads/2026/10/usf-footwear-export-value-per-pair-by-country.png" alt="Bar chart of export value per pair in 2025: China 4.61 dollars, India 8.38, Germany 32.61, Italy 63.67" width="800" style="max-width:100%;height:auto"></a><figcaption>Source: UrbanStyle Footwear, based on UN Comtrade, HS 6401 to 6405 (UrbanStyle calculation). <a href="https://urbanstylefootwear.com/footwear-imports-and-exports-by-country/">Footwear Imports and Exports by Country</a></figcaption></figure>Click the code, press Ctrl+C (Cmd+C on Mac), and paste it into any web page. Please keep the attribution link.
View as table
| Country | Exports, USD billion (HS 6401 to 6405) | Pairs, million | Value per pair, USD |
|---|---|---|---|
| China | 41.56 | 9015.7 | 4.61 |
| Türkiye | 0.96 | 186.9 | 5.12 |
| Cambodia | 2.06 | 252.6 | 8.15 |
| India | 2.25 | 268.4 | 8.38 |
| Brazil | 0.96 | 103.9 | 9.22 |
| Spain | 3.67 | 163.9 | 22.40 |
| Poland | 4.66 | 177.7 | 26.25 |
| Portugal | 1.94 | 69.0 | 28.10 |
| Germany | 11.91 | 365.1 | 32.61 |
| Hong Kong | 1.76 | 53.8 | 32.68 |
| Netherlands | 5.71 | 171.7 | 33.26 |
| France | 5.97 | 126.1 | 47.36 |
| Italy | 13.07 | 205.2 | 63.67 |
Italy’s average pair is worth about 14 times China’s. That gap explains why Italy is third by value and only ninth by pairs. Spain, Poland and Portugal sit in the middle, around $22 to $28. The World Footwear Yearbook puts Europe’s average at $34.76 and Asia’s at $8.02.
What you can safely say. “Average export value per pair” is customs value divided by pairs. It is not the retail price and not the manufacturer’s profit. Freight, duty, distribution and retail margin all come on top.
The material is part of the price difference. Leather-upper shoes (heading 6403) are the biggest line for Italy, France and Portugal, while rubber and plastic shoes (6402) are China’s biggest. If you want to know what those materials mean on your feet, my shoe materials guide and full-grain leather explainer cover them.
Sources: UN Comtrade, HS 6401 to 6405, 2025 (tier B); World Footwear Yearbook 2026 via APLF for world and regional averages (tier D). Per-pair values are my calculations (tier E). Some quantities are Comtrade estimates.Why do Germany, the Netherlands and Belgium export so many shoes?
Short answer. They are re-export hubs. Shoes made in Asia arrive at their ports and warehouses and are sent on to the rest of Europe, so they count as both imports and exports. Germany imported $16.1 billion of footwear in 2025 and exported $12.5 billion.
This is the biggest trap in footwear trade data. A country’s exports include shoes it never made. Germany is the world’s fourth-largest footwear exporter by value and fourth by pairs (365 million), but it imported more than it exported. The Netherlands exported $5.77 billion and imported $5.75 billion. Hong Kong exported $1.88 billion and imported $1.89 billion. Those near-equal totals are the signature of a trading hub.
Belgium shows how messy it gets. The World Footwear Yearbook counts it seventh in the world by exported pairs (227 million), yet Belgium reported only $0.73 billion of footwear exports to the UN for 2025. I treat Belgium’s numbers as transit trade and don’t compare its pairs with its dollars.
My read. If you want to know where shoes are made, export rankings are the wrong tool for Europe. Use them for “who trades the most”, and use production data for “who makes the most”.
Sources: UN Comtrade, HS 64, 2025 (tier B); World Footwear Yearbook 2026 (tier C).What does HS code 64 cover?
Short answer. HS chapter 64 is footwear in the Harmonized System that customs offices use worldwide. Headings 6401 to 6405 are complete shoes, sorted by what the sole and upper are made of, and 6406 is parts such as uppers and insoles.
| Heading | What it covers | China exports 2025, USD billion | Italy exports 2025, USD billion |
|---|---|---|---|
| 6401 | Waterproof footwear with rubber or plastic soles and uppers, not stitched or riveted (for example moulded rain boots) | 0.66 | 0.09 |
| 6402 | Other footwear with rubber or plastic soles and uppers (for example many slides and synthetic trainers) | 22.12 | 1.56 |
| 6403 | Rubber, plastic or leather soles with leather uppers | 7.02 | 8.38 |
| 6404 | Rubber, plastic or leather soles with textile uppers (for example mesh and knit sneakers) | 10.77 | 2.76 |
| 6405 | Other footwear | 0.99 | 0.27 |
| 6406 | Parts of footwear: uppers, insoles, heels, gaiters and the like | 4.62 | 0.57 |
The scope matters when you compare sources. Chapter 64 totals include parts, which were about 10% of China’s footwear exports in 2025. Per-pair figures must leave parts out, because parts aren’t counted in pairs. Every table on this page says which scope it uses.
Sources: World Customs Organization, HS 2022 nomenclature (tier B); UN Comtrade, 2025 (tier B). Heading descriptions are shortened in my own words.Is footwear trade growing or falling in 2026?
Short answer. Falling so far. In the first quarter of 2026, US footwear imports dropped 18.0% in value and 11.8% in pairs, and China’s exports fell 17.6% in value, compared with a year earlier (euro figures).
| Measure, Q1 2026 against Q1 2025 | Change |
|---|---|
| China exports, value | -17.6% |
| Vietnam exports, value | -9.3% |
| Indonesia exports, value | -10.9% |
| US imports, value | -18.0% |
| US imports, pairs | -11.8% |
| Japan imports, value | -12.1% |
| Italy exports, value | -1.6% |
| Australia imports, value | +2.2% |
Australia was the only large consumer market in that report where imports grew. One quarter is not a year, and part of a fall measured in euros can come from the currency itself. I’ll replace this section with full-year 2026 data when it is published.
I don’t forecast trade. These are the things I’m watching that would change this page:
- Vietnam in the UN data. When Vietnam’s 2025 figures reach Comtrade, I’ll swap in the official number.
- The full World Footwear Yearbook 2026 tables for world imports and exporters by value.
- US tariff changes and whether China’s share of US pairs follows its share of value down.
- Corrections. If you have better data, email me.
Why do footwear trade figures differ between sources?
Short answer. Sources measure different product scopes, different valuations and different reporters, in different currencies. A gap of about $5 billion between two “Vietnam footwear exports” figures can be nothing more than bags being included in one of them.
| Reason | Example from my research | What to do |
|---|---|---|
| Product scope | Vietnam: over $24 billion for footwear, about $29 billion with leather goods and bags | Check whether bags or parts are included |
| Parts or no parts | China: $46.2 billion for chapter 64, $41.6 billion for complete shoes only | Say “HS 64” or “HS 6401 to 6405” |
| Which side reports | US imports from China $7.08 billion; China’s exports to the US $7.16 billion | Name the reporting country |
| Valuation | Vietnamese shoes in the US: $17.39 with freight and insurance (CIF), $21.17 landed cost with duty | Say FOB, CIF or landed |
| Agency cut | USITC gave $27.1 billion of US imports for 2019 at customs value; Comtrade gives $28.2 billion including freight and insurance | Don’t mix agencies or valuations in one series |
| Currency | Trade press quotes Europe in euros, Comtrade in dollars | Compare growth in one currency only |
| Missing reporters | Vietnam, Russia, the UAE and Bangladesh absent from 2025 UN data | Fill the gap and label it |
| Re-exports | Germany ranks fourth by exports and second by imports | Don’t call exporters producers |
What you can safely say. Name the source, the year, the scope (HS 64 or complete footwear) and the currency with every trade figure. With those four, readers can check you.
Who measures footwear trade?
Every number on this page starts at a customs post. Select a step to see what each layer adds and how I use it.
1National customsCustoms offices in each country
Record every shipment crossing the border: product code, value, quantity, partner country. This is the raw material for everything below.
2UN ComtradeThe United Nations statistics division
Collects what each country reports and publishes it in US dollars on one classification. I read it directly for every tier B figure. Countries that do not report, such as Vietnam for 2025, are missing.
3Industry yearbookAPICCAPS, World Footwear Yearbook
Builds a full picture from trade statistics, fills gaps like Vietnam, and adds world totals, pairs and average prices. The full book is paid; I used its free sample and trade press summaries.
4National agencies and associationsVietnam Customs, LEFASO, USITC, FDRA
Publish faster or more detailed national figures, sometimes with a wider scope (Vietnam’s headline includes bags) or a different valuation (landed cost).
5Trade press and articlesWorld Footwear, APLF, news sites
Report all of the above, often in euros or for part of a year. I use them only where the original is not public, and I label them tier D.
How good is the evidence behind footwear trade statistics?
Short answer. Strong. Of the 235 rows in this page’s dataset, 71% are official customs records (tier B), 6% come from the industry yearbook (tier C), 12% are secondary reporting (tier D) and 10% are my calculations (tier E).
| Evidence tier | Rows | Share |
|---|---|---|
| A Peer-reviewed research | 0 | 0% |
| B Official records | 168 | 71% |
| C Industry research | 14 | 6% |
| D Secondary reporting | 29 | 12% |
| E UrbanStyle calculations | 24 | 10% |
| Total | 235 | 100% |
- Tier B carries the page. Almost every value is a customs record, read directly from the UN database.
- Tier D fills the gaps. Vietnam, world totals and early 2026 come through trade press reports, and I say so each time.
- Counts are not quality scores. A tier E share or per-pair value is only as good as the customs data under it.
Where other footwear trade articles go wrong
I read the pages that rank for footwear trade searches: trade press, government pages and data portals. Some of these problems I saw directly, and the rest are traps that are easy to fall into. This is not a complete audit of anyone’s work.
- Problem 1Old data at the top of search results. A government footwear trade page that still ranks covers 2015 to 2019.
- Problem 2Vietnam missing from “top exporter” lists built only on UN data, which pushes Italy into second place.
- Problem 3Vietnam’s leather, footwear and bags total (about $29 billion) quoted as footwear exports.
- Problem 4Re-export hubs presented as shoe producers.
- Problem 5Dollars and euros mixed in the same comparison, or growth rates quoted without the currency.
- Problem 6Value rankings and pair rankings mixed in one list.
- Problem 7“Average price per pair” presented as what shoppers pay.
- Problem 8No downloadable data, so nobody can check or reuse the numbers.
How to use footwear trade data well
This is practical advice for importers, sourcing teams, students and writers, based on what I learned building this page.
- Pick one source per series. Comtrade for country comparisons, a national agency for one country’s detail. Don’t splice them.
- Write the scope next to the number. “HS 64” or “complete footwear”, and the year.
- Use pairs and value together. China and Vietnam swap places in the US depending on which you use.
- Treat hubs as hubs. Germany, the Netherlands, Belgium and Hong Kong move shoes; they mostly don’t make them.
- Check the reporter. Importer and exporter records of the same trade differ by a few percent.
- Read value per pair as a border price. Shop prices are several times higher. My footwear spending statistics cover what people actually pay.
- Date everything. Trade shifted sharply in 2025 and again in early 2026.
If you’re a shopper reading the “made in” label, the label tells you the country of origin, which is what customs records as well. My footwear buying guide covers what actually matters for fit and quality, and sizes from different countries are converted in my shoe size by country guide.
Sources and evidence tiers
Evidence hierarchy
- APeer-reviewed research. Not needed for this page. Trade statistics come from customs records.
- BOfficial records and standards. UN Comtrade customs data, the USITC trade analysis and the WCO’s Harmonized System.
- CIndustry research. The World Footwear Yearbook 2026 by APICCAPS, read from its free sample report.
- DSecondary reporting. Trade press summaries of the Yearbook, Vietnam Customs via VOV, FDRA via World Footwear and first-quarter 2026 data.
- ECalculations. My rankings, shares, changes, balances and per-pair values, with the method stated.
Primary versus secondary data
Primary source: the organisation that collected the data. Secondary source: an article summarising someone else’s data. Where I could only read a secondary source, the table says so.
Source table
| Source | Year | Sample | Geography | Finding used | Tier | Series ID | Primary source |
|---|---|---|---|---|---|---|---|
| United Nations Comtrade database, annual HS data, chapter 64 (footwear) and headings 6401 to 6406, read through the public API on October 25, 2026 | 2025 | Customs records reported by each country to the UN; 119 countries had 2025 export data for chapter 64 when I read it | Global | Export and import values (US dollars) and pairs for 2019 to 2025, by reporter and partner | B | HS chapter 64; headings 6401 to 6406 | UN Comtrade |
| US International Trade Commission, "Shifts in U.S. Merchandise Trade 2019: Footwear" | 2019 | US government trade analysis, 2015 to 2019 | United States | US footwear imports $27.1 billion in 2019; Vietnam's share rose from 16.2% in 2015 to 25.8% in 2019 | B | n/a | USITC page |
| World Customs Organization, Harmonized System nomenclature, chapter 64 (Footwear, gaiters and the like; parts of such articles) | 2022 | International product classification | Global | Headings 6401 to 6405 cover complete footwear by material of sole and upper; 6406 covers parts | B | HS 2022 chapter 64 | WCO page |
| APICCAPS, World Footwear Yearbook 2026, free sample report (PDF) | 2026 | Industry yearbook built on trade statistics; 2025 data, 2024 revised | Global | Top 10 exporters by pairs in 2025 (China 9,016 million pairs, 61.2% of world exports; top 10 88.0%); Asia 84.3% of exported pairs, Europe 13.1% | C | Tables 1 and 3 | Yearbook sample (PDF) |
| APLF, "Global footwear production holds steady at 24.6 billion pairs as export value rises 1.6% in 2025" (August 19, 2026), reporting the World Footwear Yearbook 2026 | 2026 | Trade press summary of the Yearbook | Global | World export value $172 billion in 2025, up 1.6%; export volume down 0.1%; average export price $11.65 a pair (Europe $34.76, Asia $8.02); 2023 record $11.96 | D | n/a | APLF article |
| World Footwear, "2024: footwear production rebounds, exports rise in volume but not in value" (July 31, 2025), reporting the World Footwear Yearbook 2025 | 2025 | Trade press summary of the Yearbook | Global | World exports 14.8 billion pairs and $170 billion in 2024; average export price $11.47 (2024), $11.98 (2023), $8.83 (2015); value $129.2 billion in 2015 | D | n/a | World Footwear article |
| World Footwear, "Global footwear trade in 2024: China exports slow, US and Germany rebound in imports" (April 1, 2025) | 2024 | Trade press report of national data | Global | Vietnam exports of 22.8 billion USD in 2024, up 13% | D | n/a | World Footwear article |
| VOV (Voice of Vietnam), "Leather and footwear exports approach US$29 billion in 2025" (January 29, 2026), citing Vietnam Customs preliminary data and LEFASO | 2025 | Preliminary customs data reported by state media | Vietnam | Footwear accounted for over US$24 billion of the sector total in 2025, up nearly 6%; the sector including bags approached US$29 billion | D | n/a | VOV article |
| World Footwear, "China remains top US footwear supplier but market share hits 35-year low" (April 9, 2026), reporting FDRA analysis of US International Trade Commission data | 2025 | US import statistics as analysed by the Footwear Distributors and Retailers of America | United States | US imports in 2025: China 964 million pairs, Vietnam 574 million (average landed cost $21.17, a 24-year high), Indonesia 194 million, Cambodia 105 million, India 37 million | D | n/a | World Footwear article |
| World Footwear, "Global footwear trade weakens in early 2026" (June 30, 2026) | 2026 | Trade press report of first-quarter national data, in euros | Global | Q1 2026 against Q1 2025: China exports down 17.6% in value, Vietnam down 9.3%, US imports down 18.0% in value and 11.8% in pairs | D | n/a | World Footwear article |
| UrbanStyle Footwear calculations on this page | 2026 | Arithmetic on figures from the sources above; method stated | Global | Rankings, shares, changes, balances and value per pair on this page | E | n/a | Methodology |
Methodology and limitations
How I built this page. I read UN Comtrade’s annual HS data through its public API on October 25, 2026: chapter 64 exports and imports for 2024 and 2025 by reporting country, partner breakdowns for the US, China and the EU, US supplier data back to 2019, and headings 6401 to 6406 with quantities in pairs. I cross-checked US shares against the USITC’s 2019 analysis and Comtrade pair totals against the World Footwear Yearbook 2026 sample report, which matched for China, Germany, Italy, India and Cambodia. For Vietnam, world totals and early 2026 I used the reports named in the source table. Rankings, shares, changes, balances and per-pair values are my arithmetic, labelled E, and the method for each is in the dataset.
Choices I made. Value rankings use all of chapter 64, the standard customs scope, which includes parts. Per-pair figures use headings 6401 to 6405 only, so value and pairs cover the same goods, and only for countries with pair counts on every line. Exports are as reported by the exporter and imports by the importer. All values are current US dollars, not adjusted for inflation. I left out production and retail market size, which are separate questions with separate data.
Limitations you should know about
- Missing reporters. Vietnam, Russia, the UAE and Bangladesh had no 2025 data in Comtrade when I read it. Vietnam’s figure is a preliminary customs number from a news report.
- Revisions. Countries revise trade data, sometimes months later. Figures are as read on October 25, 2026.
- Estimated quantities. Comtrade estimates some missing quantities, which affects some per-pair values.
- Exchange rates. Dollar values of European trade move with the euro, so dollar growth rates are not volume growth.
- Re-exports. Export figures include shoes made elsewhere, especially for European hubs and Hong Kong.
- Valuation. Most exports are valued free on board and most imports including freight and insurance, so balances are approximate.
Data freshness
| Date | Change |
|---|---|
| October 26, 2026 | First publication. UN Comtrade 2019 to 2025, World Footwear Yearbook 2026 sample, Vietnam Customs via VOV, FDRA via World Footwear, first-quarter 2026 trade. Downloadable dataset, four charts and calculations with stated methods. |
| When Vietnam’s 2025 data reaches Comtrade | Planned update of the Vietnam row and rankings. |
| January 2027 | Next scheduled full review. |
Last full source review: October 26, 2026. Next scheduled review: January 2027.
Corrections. If you spot an error or have better data, email info@urbanstylefootwear.com with the subject “Data correction”. I’ll check it and note any change in the table above. How we review products is explained in our methodology.
For journalists and researchers
You can use the statistics and charts on this page with credit to UrbanStyle Footwear. Wherever you can, please cite the original source printed with each statistic. My own calculations are marked tier E and can be cited to me.
A sentence you can use. “China exported $46.2 billion of footwear in 2025, down 9.4%, and in the US market Vietnam overtook China by value, supplying 36.1% of US footwear imports against China’s 26.1%. China still shipped almost half the pairs.” (Sources: UN Comtrade; shares calculated by UrbanStyle Footwear)
Media kit
All figures with value, unit, geography, segment, basis, period, source and evidence tier.
Four charts with source, scope and data type printed on each image. SVG versions are under each chart above.
The 15 citable statistics on one printable PDF.
Every source with year, sample, geography, tier, series ID and link.
Exports, imports and balance for 28 countries, 2024 and 2025.
Ready-made citations below. Media and research enquiries go to info@urbanstylefootwear.com.
Cite this page
Suggested citation
UrbanStyle Footwear. “Footwear Imports and Exports by Country: Global Trade Statistics.” Updated October 26, 2026. https://urbanstylefootwear.com/footwear-imports-and-exports-by-country/
APA style
Vahith, A. (2026, October 26). Footwear imports and exports by country: global trade statistics. UrbanStyle Footwear. https://urbanstylefootwear.com/footwear-imports-and-exports-by-country/
Link (HTML)
<a href="https://urbanstylefootwear.com/footwear-imports-and-exports-by-country/">Footwear Imports and Exports by Country by UrbanStyle Footwear</a>Click any citation, then press Ctrl+C (Cmd+C on Mac) to copy it.
For individual statistics, UrbanStyle recommends citing the original source listed in the source table whenever possible.
Data requests. Data correction or dataset request: info@urbanstylefootwear.com
Frequently asked questions
Which country exports the most footwear?
China, by a wide margin. It exported $46.18B of footwear and parts in 2025 (UN Comtrade) and about 9.0 billion pairs, 61.2% of the world’s exported pairs (World Footwear Yearbook 2026). Vietnam is second at over $24 billion. See the exporter ranking.
Which country imports the most footwear?
The United States. It imported $27.19B of footwear in 2025, ahead of Germany ($16.1B), France ($9.6B) and Italy ($8.8B), by UN Comtrade data. See the importer ranking.
Where does the US import most of its shoes from?
By value, Vietnam (36.1% in 2025), then China (26.1%), Indonesia, Italy and Cambodia. By pairs, China still leads with about 948 million of 1,986 million pairs. See where US shoes come from and the US footwear market statistics.
Is Vietnam the second-largest footwear exporter?
Yes. Vietnam’s footwear exports passed $24 billion in 2025 by preliminary customs data, and it shipped 1,658 million pairs, 11.2% of world exported pairs, second to China on both measures. It is missing from the 2025 UN Comtrade data, which is why some rankings skip it.
How much footwear does China export?
About $46.18B in 2025 including parts, or $41.56B for complete shoes, in roughly 9.0 billion pairs. That works out to about $4.61 a pair at the border (my calculation from UN Comtrade).
What is the total value of world footwear exports?
About $172 billion in 2025, up 1.6% on 2024, by the World Footwear Yearbook 2026 as reported by APLF. The number of pairs exported was about flat, at roughly 14.7 billion by my calculation from China’s share.
What is the average export price of a pair of shoes?
$11.65 worldwide in 2025, by the World Footwear Yearbook: $34.76 for pairs exported from Europe and $8.02 from Asia. These are customs values at the border, far below shop prices, because they leave out freight, duty, distribution and retail margins.
What does HS code 64 cover?
HS chapter 64 is footwear in the Harmonized System used by customs worldwide. Headings 6401 to 6405 cover complete shoes, split by the material of the sole and upper, and 6406 covers parts such as uppers and insoles. See the HS 64 table.
Why do Germany, the Netherlands and Belgium export so many shoes?
Much of it is re-export. They import shoes, mostly from Asia, and ship them on to other European countries through distribution centres, so they appear as both large importers and large exporters. Germany imported more footwear by value than it exported in 2025.
Does the United States export footwear?
A little. US footwear exports were $1.30B in 2025 against $27.19B of imports, a footwear trade deficit of about $25.9B (my calculation from UN Comtrade).
Which countries import the most footwear from China?
By China’s own figures for 2025, the United States ($7.16B), Russia ($2.78B), Vietnam ($2.17B), Japan ($1.92B) and Germany ($1.53B). See China’s main markets.
Is footwear trade falling in 2026?
Early data says yes. In the first quarter of 2026, US footwear imports fell 18.0% in value and China’s exports fell 17.6% in value against a year earlier, in euro terms (World Footwear). Full-year 2026 data will not be complete until 2027.
Why do footwear trade figures differ between sources?
Sources use different product scopes (all of chapter 64 or complete shoes only), different valuations (FOB exports, CIF imports, landed cost), different reporters (exporter or importer records) and different currencies. Vietnam is a common gap. See why the numbers disagree.
Can I use these statistics and download the data?
Yes, with credit to UrbanStyle Footwear, and cite the original source for any single statistic where you can. The CSV, XLSX, charts and a printable list of key statistics are in the media kit, with citation formats.