
Footwear Industry Trends Report 2027: Market Data, Consumer Shifts and Forecasts
This is UrbanStyle Footwear’s first annual report on the shoe industry. Over the past month I built separate research pages on production, trade, market size and the cost of a shoe. This report brings the most important findings together, adds the latest 2026 data on prices, brands, shoppers and regulation, and sets out what the published forecasts say about 2027. Every figure is labelled as observed data, a published forecast or my own analysis, so you always know which is which.
Six headline numbers for 2027. Select one to see what it counts and where it comes from.
Select a topic above, for example “Prices”, to see what the number counts.
$121.15BUS households spent $121.15 billion on footwear in 2025, up 4.4% (BEA, tier B). Price-adjusted growth was 4.3%, so it was mostly more pairs, not higher prices.
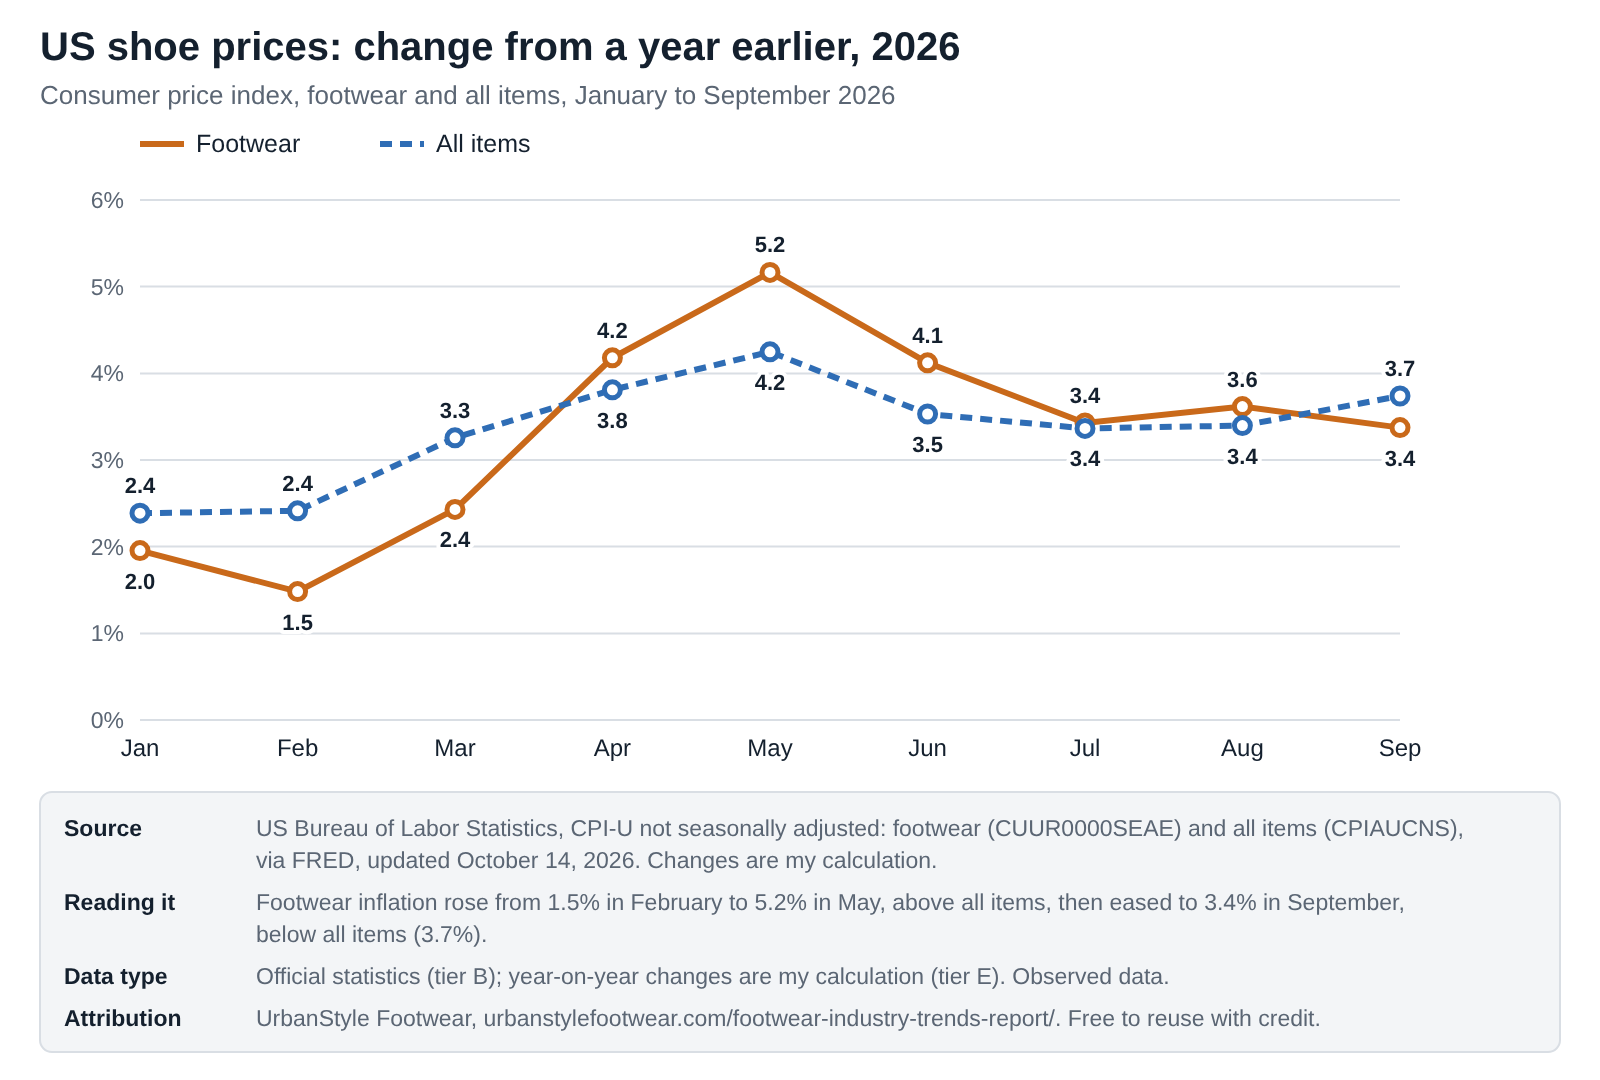
+3.4%US footwear prices were 3.4% higher in September 2026 than a year earlier, after peaking at 5.2% in May (BLS, my calculation, tier E). All items rose 3.7%.
24.6B pairsThe world made 24.6 billion pairs in 2025, up just 0.1%, and China made 55.6% of them (World Footwear Yearbook 2026, tier C).
36.1% vs 26.1%Vietnam overtook China as the biggest supplier of US footwear imports by value in 2025: 36.1% against 26.1%. China had 49.8% in 2019 (UN Comtrade, my calculation, tier E).
+13%US running shoe sales rose 13% in dollars and units in the first half of 2026, while all footwear rose 1% (Circana, tier C).
3.4%The IMF expects world growth of 3.4% in 2027, up from 3.1% in 2026 (October 2026 forecast, as reported, tier D). It is a forecast, not data.
Each number names its source and evidence tier. All fifteen of my citable statistics are further down this page.
The footwear industry in 2026 and 2027 at a glance
Quick answer. The footwear industry enters 2027 growing in money but not in pairs. World production was flat at 24.6 billion pairs in 2025, while US household spending rose 4.4% to $121.15 billion. In 2026, prices did most of the work: US footwear inflation peaked at 5.2% in May and was 3.4% in September, and US footwear sales rose just 1% in the first half with fewer units sold. Sourcing is shifting, with Vietnam overtaking China in US footwear imports, running is the fastest-growing category (+13%), and brand fortunes have split, from On (+21.6%) to Nike (-5%). Forecasts for 2027 point to slightly faster world growth (IMF 3.4%) and easing US inflation.
Data cutoff and forecast period. This edition uses data published up to October 26, 2026. Observed data runs to September 2026 for US prices, the second or third quarter of 2026 for companies, and 2025 for production and trade. Forecasts cover 2026 and 2027 and are always labelled.
Executive summary: 10 findings for 2027
- Value up, volume flat. World production rose 0.1% to 24.6 billion pairs in 2025 while export value rose 1.6% to $172 billion. In the US, footwear sales rose 1% in H1 2026 while units fell. (Observed)
- Prices are the story of 2026. US footwear inflation went from 1.5% in February to 5.2% in May and was 3.4% in September. A year earlier it was 1.3%. (Observed)
- Shoppers are pushing back. Nearly half of US consumers say they delayed shoe purchases or chose cheaper options because of price rises, and comfort is their leading purchase driver. (Observed survey)
- Sourcing has moved. Vietnam supplied 36.1% of US footwear imports by value in 2025 and China 26.1%, down from 49.8% in 2019. China still makes 55.6% of the world’s shoes. (Observed)
- Trade dropped in early 2026. US footwear imports fell 18.0% in value and 11.8% in pairs in Q1 2026, and China’s exports fell 17.6%. (Observed)
- Running is the growth engine. US running shoe sales rose 13% in dollars and units in H1 2026; performance footwear rose 6%; sport lifestyle declined. (Observed)
- Brands are diverging. On grew 21.6% at constant currency in Q2 2026 and adidas 14%, while Nike fell 5% in the quarter to August and expects fiscal 2027 revenue to fall by a high single-digit percentage. (Observed and guidance)
- Direct selling is no longer a one-way bet. NIKE Brand Digital fell 13% in its latest quarter while On sells 45.7% direct and adidas reports double-digit growth in own retail and e-commerce. (Observed)
- Regulation is arriving. Since 19 July 2026, large companies in the EU may not destroy unsold footwear; medium-sized companies follow in 2030. (Observed)
- 2027 starts from a better macro base. The IMF expects world growth of 3.4% in 2027, up from 3.1%, and US inflation easing from 3.6% to 2.8%. Circana expected US footwear sales to end 2026 roughly flat. (Published forecasts)
Footwear industry scorecard 2027
One line per indicator, with the latest value, the direction and a label. Filter by label to see only observed data, only published forecasts or only my analysis.
| Area | Indicator | Latest value | Direction | Label |
|---|---|---|---|---|
| Market | US household footwear spending | $121.15B in 2025, +4.4% | ▲ Up | Observed data |
| Market | EU household footwear spending | EUR 75.3B in 2024 (about $81.4B) | ▲ Up | Observed data |
| Market | US footwear sales, first half 2026 | +1% in dollars, units down | ▶ Flat | Observed data |
| Production | World production | 24.6B pairs in 2025, +0.1% | ▶ Flat | Observed data |
| Production | China share of production | 55.6% in 2025 | ▶ Flat | Observed data |
| Trade | World export value | $172B in 2025, +1.6% | ▲ Up | Observed data |
| Trade | US imports from China, share of value | 26.1% in 2025 (49.8% in 2019) | ▼ Down | Observed data |
| Trade | US footwear imports, Q1 2026 | -18.0% in value, -11.8% in pairs | ▼ Down | Observed data |
| Prices | US footwear inflation | +3.4% in Sept 2026 (peak 5.2% in May) | ▲ Up | Observed data |
| Prices | Average world export price | $11.65 a pair in 2025 | ▲ Up | Observed data |
| Channels | US e-commerce share of retail | 17.1% in Q2 2026 | ▲ Up | Observed data |
| Channels | NIKE Direct revenue | -8% in Q1 FY2027 (digital -13%) | ▼ Down | Observed data |
| Consumers | US running shoe sales | +13% in H1 2026 | ▲ Up | Observed data |
| Policy | EU ban on destroying unsold footwear | In force for large firms from 19 July 2026 | ★ New | Observed data |
| Outlook | World GDP growth 2027 | 3.4% (IMF) | ▲ Up | Published forecast |
| Outlook | US footwear sales 2026 | Roughly flat (Circana) | ▶ Flat | Published forecast |
| Outlook | Executives expecting higher retail prices | Almost 90% (next six months) | ▲ Up | Published forecast |
| Analysis | Price, not volume, will drive 2027 sales growth in the US | My read | n/a | UrbanStyle analysis |
| Analysis | Sourcing will keep shifting from China to Vietnam and India | My read | n/a | UrbanStyle analysis |
What I noticed while putting this report together
I started this report expecting a growth story, because most headlines about the shoe business are about record sales. The data told me something more careful. Money is growing, pairs are not. The world made almost exactly as many shoes in 2025 as in 2024, and in the first half of 2026 Americans paid more for fewer pairs.
The second thing was how fast prices moved this year. When I calculated the change in the US footwear price index month by month, it went from 1.5% in February to 5.2% in May. That was above general inflation, then it dropped back below it by September. A year earlier, shoe prices were rising only 1.3%. The timing lines up with the tariff changes I traced for the cost-of-a-shoe page, though the price index alone can’t prove the cause.
The third was the split between brands. Writing the summary, I had On growing more than 20% and Nike shrinking in the same few months. Running brands and running shoes are doing well; broad lifestyle sneakers are not.
The last thing is a gap. There is no official forecast for footwear. The only forward-looking numbers are the IMF’s economic outlook, Circana’s view of the US market, an executive survey and brands’ own guidance. I’ve kept every one of them labelled and separate from measured data.
How to read this report
Every number has one of three labels.
| Label | What it means | Example |
|---|---|---|
| Observed data | Already happened and was measured by an official body, a company or a retail tracker | US footwear prices +3.4% in September 2026 |
| Published forecast | Someone else’s projection or guidance, quoted with its date | IMF world growth 3.4% in 2027 |
| UrbanStyle analysis | My own reading of the evidence, written in the first person | “My read” in the 2027 section |
Pick a type of evidence to see what it covers and where it falls short.
See what each type of evidence covers and where it falls short
Choose a type to see what it records and how I would read it.
Select a source above.
Observed data. to September 2026. Figures that have already happened and been measured: national accounts, price indexes, customs records, company results and retail tracking. How to read it: The most reliable part of the report, but always a little behind. The latest month here is September 2026 for prices and Q2 or Q3 2026 for companies.
Published forecasts. 2026 and 2027. What others expect: the IMF, Circana, and brands' own guidance for their next fiscal year. How to read it: Useful direction, but forecasts change and brand guidance covers one company only. I quote them as published, with the date, and never mix them with measured data.
Surveys. April 2026. What footwear executives and shoppers say they expect or do, such as almost 90% of executives expecting higher retail prices. How to read it: Opinions, not outcomes. The executive survey has 108 responses, mostly from Asia and Africa.
My analysis. Labelled "My read". My own reading of what the evidence means for 2027, written in the first person and labelled. How to read it: Opinion based on the data above. Treat it as a view to test, not a finding.
15 footwear industry statistics you can cite
Each card has one number, one sentence of context and its source. “Copy text” opens a box with the sentence, the source and a link back here. Please cite the original source for any single statistic. Cards marked E are my calculations.
US households spent $121.15 billion on footwear in 2025, up 4.4% from 2024; price-adjusted spending rose 4.3% (BEA).
Copy text
$121.15B US footwear spending, 2025: US households spent $121.15 billion on footwear in 2025, up 4.4% from 2024; price-adjusted spending rose 4.3% (BEA). Source: BEA (via FRED) (DFTWRC1A027NBEA). Via UrbanStyle Footwear: https://urbanstylefootwear.com/footwear-industry-trends-report/
US footwear prices were 3.4% higher in September 2026 than a year earlier, against 3.7% for all items; footwear inflation peaked at 5.2% in May 2026 (my calculation from BLS CPI).
Copy text
+3.4% US footwear prices, September 2026: US footwear prices were 3.4% higher in September 2026 than a year earlier, against 3.7% for all items; footwear inflation peaked at 5.2% in May 2026 (my calculation from BLS CPI). Source: BLS CPI (via FRED) (CUUR0000SEAE; CPIAUCNS). Via UrbanStyle Footwear: https://urbanstylefootwear.com/footwear-industry-trends-report/
In September 2025 footwear prices were only 1.3% higher than a year before, so shoe inflation more than doubled over the following year (my calculation from BLS CPI).
Copy text
+1.3% US footwear prices a year earlier: In September 2025 footwear prices were only 1.3% higher than a year before, so shoe inflation more than doubled over the following year (my calculation from BLS CPI). Source: UrbanStyle calculation. Via UrbanStyle Footwear: https://urbanstylefootwear.com/footwear-industry-trends-report/
The world made about 24.6 billion pairs of shoes in 2025, up 0.1%; China made 55.6% (World Footwear Yearbook 2026).
Copy text
24.6B pairs world footwear production, 2025: The world made about 24.6 billion pairs of shoes in 2025, up 0.1%; China made 55.6% (World Footwear Yearbook 2026). Source: World Footwear Yearbook 2026. Via UrbanStyle Footwear: https://urbanstylefootwear.com/footwear-industry-trends-report/
World footwear exports were worth $172 billion in 2025, up 1.6%, at an average of $11.65 a pair (World Footwear Yearbook 2026, as reported by APLF).
Copy text
$172B world footwear exports, 2025: World footwear exports were worth $172 billion in 2025, up 1.6%, at an average of $11.65 a pair (World Footwear Yearbook 2026, as reported by APLF). Source: World Footwear Yearbook 2026. Via UrbanStyle Footwear: https://urbanstylefootwear.com/footwear-industry-trends-report/
Vietnam supplied 36.1% of US footwear import value in 2025 and China 26.1%, down from 49.8% in 2019 (my calculation from UN Comtrade).
Copy text
36.1% vs 26.1% Vietnam vs China in US footwear imports: Vietnam supplied 36.1% of US footwear import value in 2025 and China 26.1%, down from 49.8% in 2019 (my calculation from UN Comtrade). Source: UN Comtrade (HS 64). Via UrbanStyle Footwear: https://urbanstylefootwear.com/footwear-industry-trends-report/
US footwear imports fell 18.0% in value and 11.8% in pairs in the first quarter of 2026 compared with a year earlier, in euro terms (World Footwear).
Copy text
-18% US footwear imports, Q1 2026: US footwear imports fell 18.0% in value and 11.8% in pairs in the first quarter of 2026 compared with a year earlier, in euro terms (World Footwear). Source: World Footwear, Jun 2026. Via UrbanStyle Footwear: https://urbanstylefootwear.com/footwear-industry-trends-report/
US running shoe sales rose 13% in both dollars and units in the first half of 2026, performance footwear 6% and all footwear 1% (Circana).
Copy text
+13% US running shoe sales, H1 2026: US running shoe sales rose 13% in both dollars and units in the first half of 2026, performance footwear 6% and all footwear 1% (Circana). Source: Circana, Aug 2026. Via UrbanStyle Footwear: https://urbanstylefootwear.com/footwear-industry-trends-report/
Nearly half of US consumers say they have delayed footwear purchases or chosen cheaper alternatives because of price increases, and comfort is the leading purchase driver (Circana, August 2026).
Copy text
nearly half of shoppers delayed or traded down: Nearly half of US consumers say they have delayed footwear purchases or chosen cheaper alternatives because of price increases, and comfort is the leading purchase driver (Circana, August 2026). Source: Circana, Aug 2026. Via UrbanStyle Footwear: https://urbanstylefootwear.com/footwear-industry-trends-report/
NIKE Brand Digital revenue fell 13% and NIKE Direct 8% in the quarter to August 2026, while wholesale fell 1%; Nike expects fiscal 2027 revenue to fall by a high single-digit percentage (Nike).
Copy text
-13% NIKE Brand Digital, Q1 FY2027: NIKE Brand Digital revenue fell 13% and NIKE Direct 8% in the quarter to August 2026, while wholesale fell 1%; Nike expects fiscal 2027 revenue to fall by a high single-digit percentage (Nike). Source: Nike Q1 FY2027 results. Via UrbanStyle Footwear: https://urbanstylefootwear.com/footwear-industry-trends-report/
On grew net sales 21.6% at constant currency in Q2 2026, with 45.7% of sales direct to consumer and a 65.4% gross margin (On results).
Copy text
+21.6% On net sales growth, Q2 2026: On grew net sales 21.6% at constant currency in Q2 2026, with 45.7% of sales direct to consumer and a 65.4% gross margin (On results). Source: On Q2 2026 results (Form 6-K Exhibit 99.3). Via UrbanStyle Footwear: https://urbanstylefootwear.com/footwear-industry-trends-report/
Almost 90% of 108 footwear executives surveyed in April 2026 expected retail footwear prices to rise over the next six months; 61% expected strong business conditions, down from 71% (World Footwear survey).
Copy text
almost 90% of footwear executives expect higher prices: Almost 90% of 108 footwear executives surveyed in April 2026 expected retail footwear prices to rise over the next six months; 61% expected strong business conditions, down from 71% (World Footwear survey). Source: World Footwear executive survey via SGB. Via UrbanStyle Footwear: https://urbanstylefootwear.com/footwear-industry-trends-report/
Large companies in the EU have been banned from destroying unsold clothing, accessories and footwear since 19 July 2026, under the Ecodesign for Sustainable Products Regulation; medium-sized companies follow in 2030 (European Commission).
Copy text
19 July 2026 EU ban on destroying unsold shoes: Large companies in the EU have been banned from destroying unsold clothing, accessories and footwear since 19 July 2026, under the Ecodesign for Sustainable Products Regulation; medium-sized companies follow in 2030 (European Commission). Source: European Commission, Aug 2026. Via UrbanStyle Footwear: https://urbanstylefootwear.com/footwear-industry-trends-report/
The IMF's October 2026 World Economic Outlook projects world growth of 3.1% in 2026 and 3.4% in 2027, with US inflation easing from 3.6% to 2.8% (as reported by Bernama and SteelOrbis).
Copy text
3.4% IMF world growth forecast, 2027: The IMF's October 2026 World Economic Outlook projects world growth of 3.1% in 2026 and 3.4% in 2027, with US inflation easing from 3.6% to 2.8% (as reported by Bernama and SteelOrbis). Source: IMF WEO Oct 2026 (as reported). Via UrbanStyle Footwear: https://urbanstylefootwear.com/footwear-industry-trends-report/
E-commerce was 17.1% of all US retail sales in Q2 2026; no official figure exists for shoes alone (US Census Bureau).
Copy text
17.1% US e-commerce share of retail: E-commerce was 17.1% of all US retail sales in Q2 2026; no official figure exists for shoes alone (US Census Bureau). Source: Census e-commerce (ECOMPCTSA). Via UrbanStyle Footwear: https://urbanstylefootwear.com/footwear-industry-trends-report/
Is the footwear market growing?
Short answer. In value, yes, modestly. US household footwear spending rose 4.4% in 2025 to $121.15 billion, and EU spending was EUR 75.3 billion in 2024. In 2026 the US market slowed: sales were up 1% in the first half with fewer units sold, and Circana expected the year to end roughly flat. (Observed and forecast)
2025 was a volume year in the US: the BEA’s price-adjusted spending rose 4.3%, almost the whole increase. 2026 looks like the opposite, with prices up and units down. Globally, there is no official market total, but world export value rose 1.6% in 2025 while pairs exported slipped 0.1%. The country-by-country detail is in footwear market size by country and the US detail in US footwear market statistics.
Sources: BEA, Eurostat (tier B); Circana (tier C); World Footwear Yearbook 2026 (tier C).Are shoe prices rising, and what are tariffs doing?
Short answer. Yes. US footwear prices were 3.4% higher in September 2026 than a year earlier, after a 5.2% peak in May. Almost 90% of footwear executives surveyed in April expected retail prices to keep rising. (Observed and survey)
Embed this chart
<figure style="margin:0"><a href="https://urbanstylefootwear.com/footwear-industry-trends-report/"><img src="https://urbanstylefootwear.com/wp-content/uploads/2026/10/usf-us-footwear-inflation-2026.png" alt="Line chart of US price changes in 2026: footwear peaks at 5.2% in May and is 3.4% in September; all items 3.7%" width="800" style="max-width:100%;height:auto"></a><figcaption>Source: UrbanStyle Footwear, based on BLS consumer price index (UrbanStyle calculation). <a href="https://urbanstylefootwear.com/footwear-industry-trends-report/">Footwear Industry Trends Report 2027</a></figcaption></figure>Click the code, press Ctrl+C (Cmd+C on Mac), and paste it into any web page. Please keep the attribution link.
View as table
| Month | Footwear CPI, change on a year earlier | All items CPI, change on a year earlier |
|---|---|---|
| Jan 2026 | 2.0% | 2.4% |
| Feb 2026 | 1.5% | 2.4% |
| Mar 2026 | 2.4% | 3.3% |
| Apr 2026 | 4.2% | 3.8% |
| May 2026 | 5.2% | 4.2% |
| Jun 2026 | 4.1% | 3.5% |
| Jul 2026 | 3.4% | 3.4% |
| Aug 2026 | 3.6% | 3.4% |
| Sep 2026 | 3.4% | 3.7% |
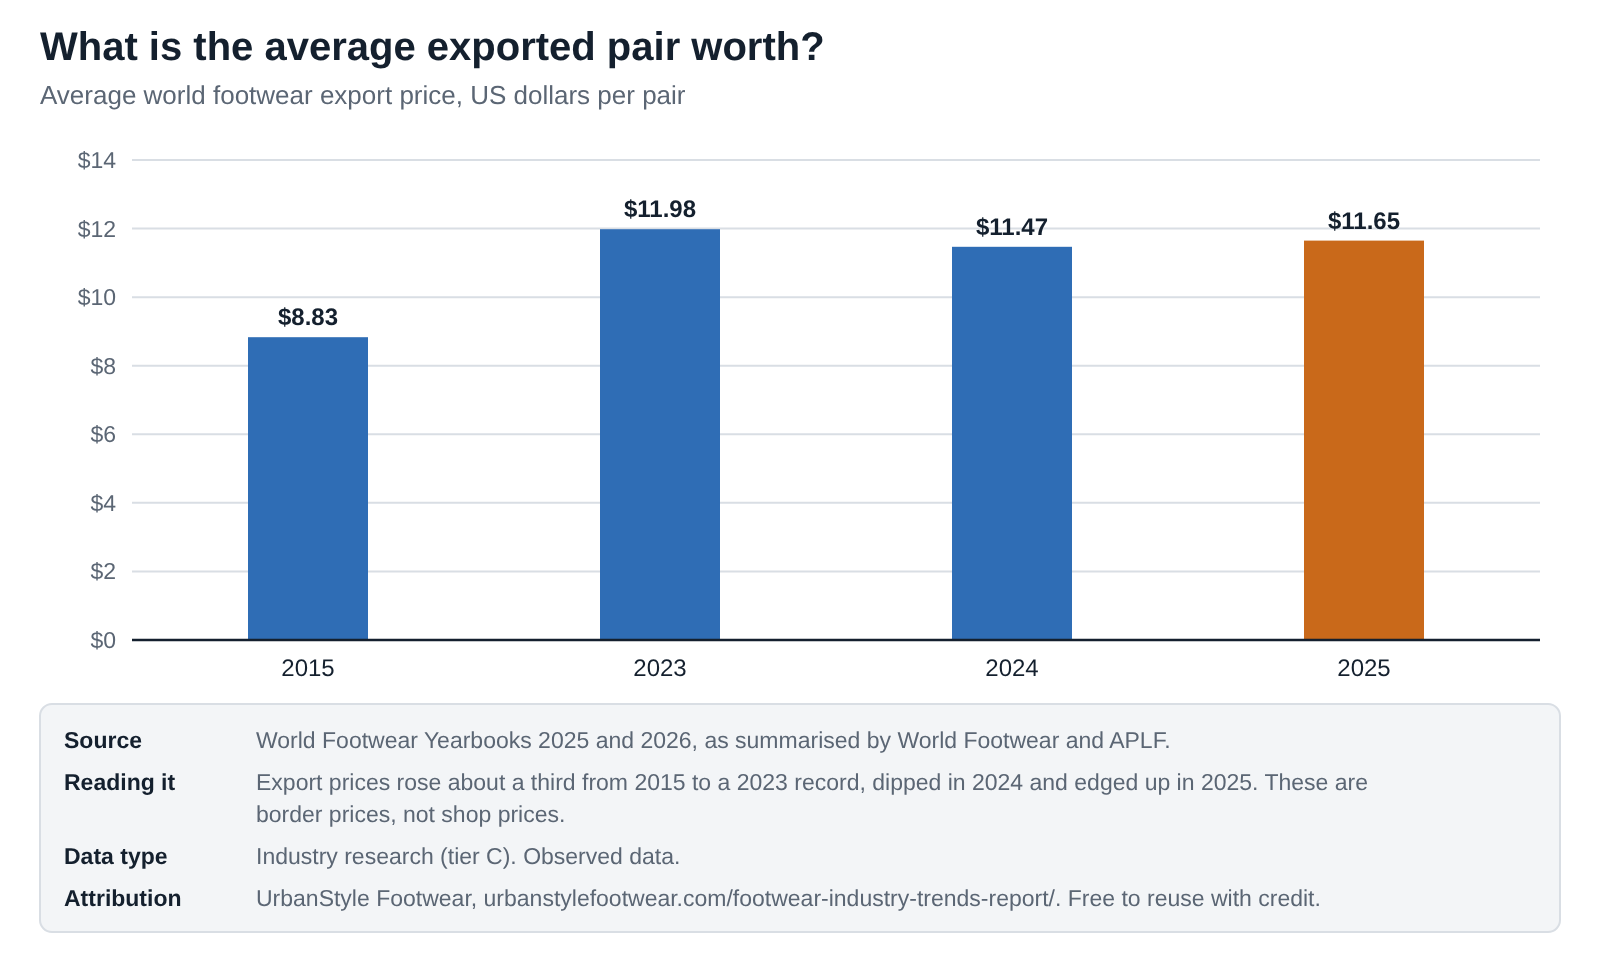
Further up the chain, export prices tell a longer story. The average exported pair was worth $8.83 in 2015, a record $11.98 in 2023 (the 2026 summary gives $11.96), $11.47 in 2024 and $11.65 in 2025.
Embed this chart
<figure style="margin:0"><a href="https://urbanstylefootwear.com/footwear-industry-trends-report/"><img src="https://urbanstylefootwear.com/wp-content/uploads/2026/10/usf-world-footwear-export-price-per-pair.png" alt="Bar chart of average world footwear export price: $8.83 in 2015, $11.98 in 2023, $11.47 in 2024, $11.65 in 2025" width="800" style="max-width:100%;height:auto"></a><figcaption>Source: UrbanStyle Footwear, based on the World Footwear Yearbooks. <a href="https://urbanstylefootwear.com/footwear-industry-trends-report/">Footwear Industry Trends Report 2027</a></figcaption></figure>Click the code, press Ctrl+C (Cmd+C on Mac), and paste it into any web page. Please keep the attribution link.
View as table
| Year | Average world export price, USD per pair |
|---|---|
| 2015 | 8.83 |
| 2023 | 11.98 |
| 2024 | 11.47 |
| 2025 | 11.65 |
Tariffs are part of the background. US rules changed three times in 2026: the Supreme Court struck down the IEEPA tariffs in February, a temporary 10% surcharge applied until July 24, and Section 301 tariffs of 12.5% on Vietnam and China and 10% on Indonesia and India replaced it. My cost of a shoe page shows what that does to a $100 sneaker.
Sources: BLS CPI via FRED (tier B), year-on-year changes my calculation (tier E); World Footwear Yearbooks (tier C); World Footwear executive survey via SGB Online (tier D); tariff timeline from Kroll as used on the cost page (tier D).Where are shoes being made and traded?
Short answer. The world made 24.6 billion pairs in 2025, 55.6% in China, and exported $172 billion worth. For the US, Vietnam overtook China as the largest supplier by value. Trade then fell sharply in early 2026. (Observed)
| Indicator | Value | Period | Source |
|---|---|---|---|
| World production | 24.6B pairs (+0.1%) | 2025 | World Footwear Yearbook 2026 |
| China, India and Vietnam share of production | 74.5% | 2025 | Yearbook, my calculation |
| China’s footwear exports | $46.2B (-9.4%) | 2025 | UN Comtrade |
| US footwear imports | $27.2B (-4.2%) | 2025 | UN Comtrade |
| Vietnam vs China in US imports | 36.1% vs 26.1% | 2025 | UN Comtrade, my calculation |
| US imports, value | -18.0% | Q1 2026 | World Footwear (euros) |
| US imports, pairs | -11.8% | Q1 2026 | World Footwear |
| China exports, value | -17.6% | Q1 2026 | World Footwear (euros) |
The full rankings are on largest footwear-producing countries and footwear imports and exports by country.
Sources as listed (tiers B, C and D).How are people buying shoes: online, in stores or direct?
Short answer. All US e-commerce reached 17.1% of retail sales in Q2 2026; there is no official shoe-only figure. At brand level the picture is mixed: NIKE Brand Digital fell 13% in its latest quarter, while On sells 45.7% direct and adidas grew own retail and e-commerce by double digits. (Observed)
Nike’s latest quarter is the clearest sign of a reset. Its direct business fell 8% and digital 13%, while wholesale fell only 1%. After years of pushing shoppers to its own apps, Nike is leaning on retailers again. Smaller, fast-growing brands such as On are still building their direct share. My online shoe shopping statistics compare the published estimates, and shoe return statistics cover the cost of online returns.
Sources: US Census Bureau (tier B); Nike and On results (tier B); adidas via World Footwear (tier D).What do shoppers want in 2026 and 2027?
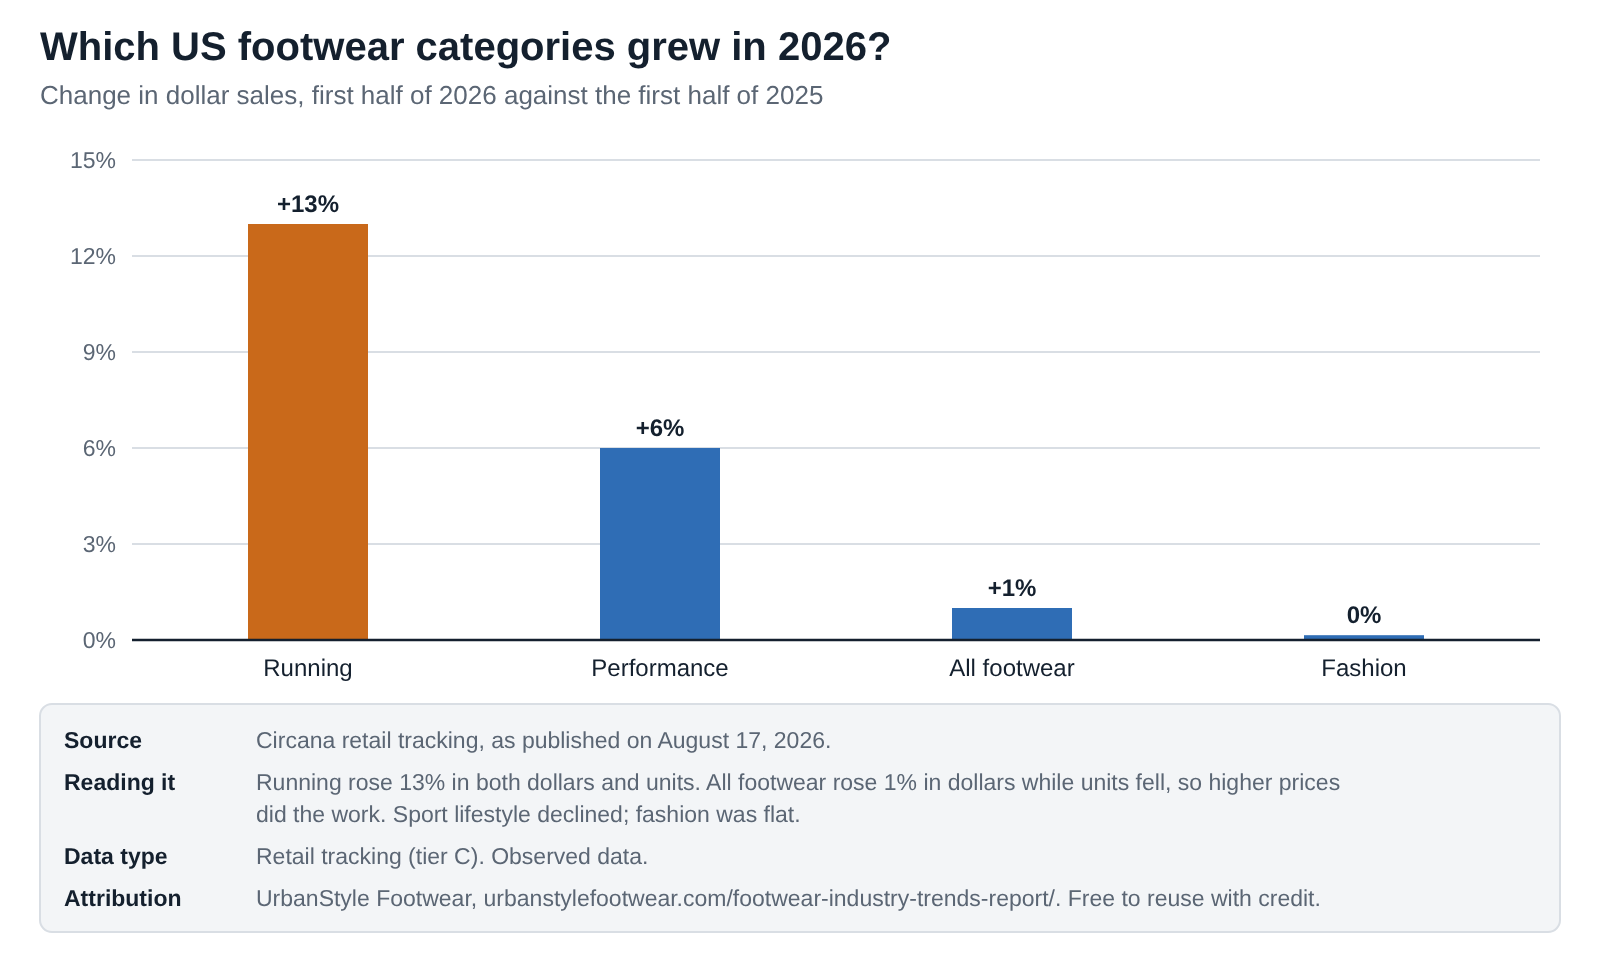
Short answer. Comfort and performance. Running shoes rose 13% and performance footwear 6% in the US in H1 2026, while sport lifestyle declined and fashion was flat. Nearly half of consumers say they delayed purchases or traded down because of prices. (Observed)
Embed this chart
<figure style="margin:0"><a href="https://urbanstylefootwear.com/footwear-industry-trends-report/"><img src="https://urbanstylefootwear.com/wp-content/uploads/2026/10/usf-us-footwear-category-growth-h1-2026.png" alt="Bar chart of US footwear sales growth in H1 2026: running 13%, performance 6%, all footwear 1%, fashion flat" width="800" style="max-width:100%;height:auto"></a><figcaption>Source: UrbanStyle Footwear, based on Circana retail tracking. <a href="https://urbanstylefootwear.com/footwear-industry-trends-report/">Footwear Industry Trends Report 2027</a></figcaption></figure>Click the code, press Ctrl+C (Cmd+C on Mac), and paste it into any web page. Please keep the attribution link.
View as table
| Category | US dollar sales change, H1 2026 |
|---|---|
| Running | +13% |
| Performance | +6% |
| All footwear | +1% |
| Fashion | +0% |
Inside fashion, Circana reports double-digit growth for ballerinas and gains for mules, clogs and pumps, while slides and flip-flops grew and larger multi-strap sandals weakened. Outdoor categories such as hiking also gained. My running shoe statistics go deeper on runners and brands.
Source: Circana, August 17, 2026 (tier C).Which footwear brands are growing?
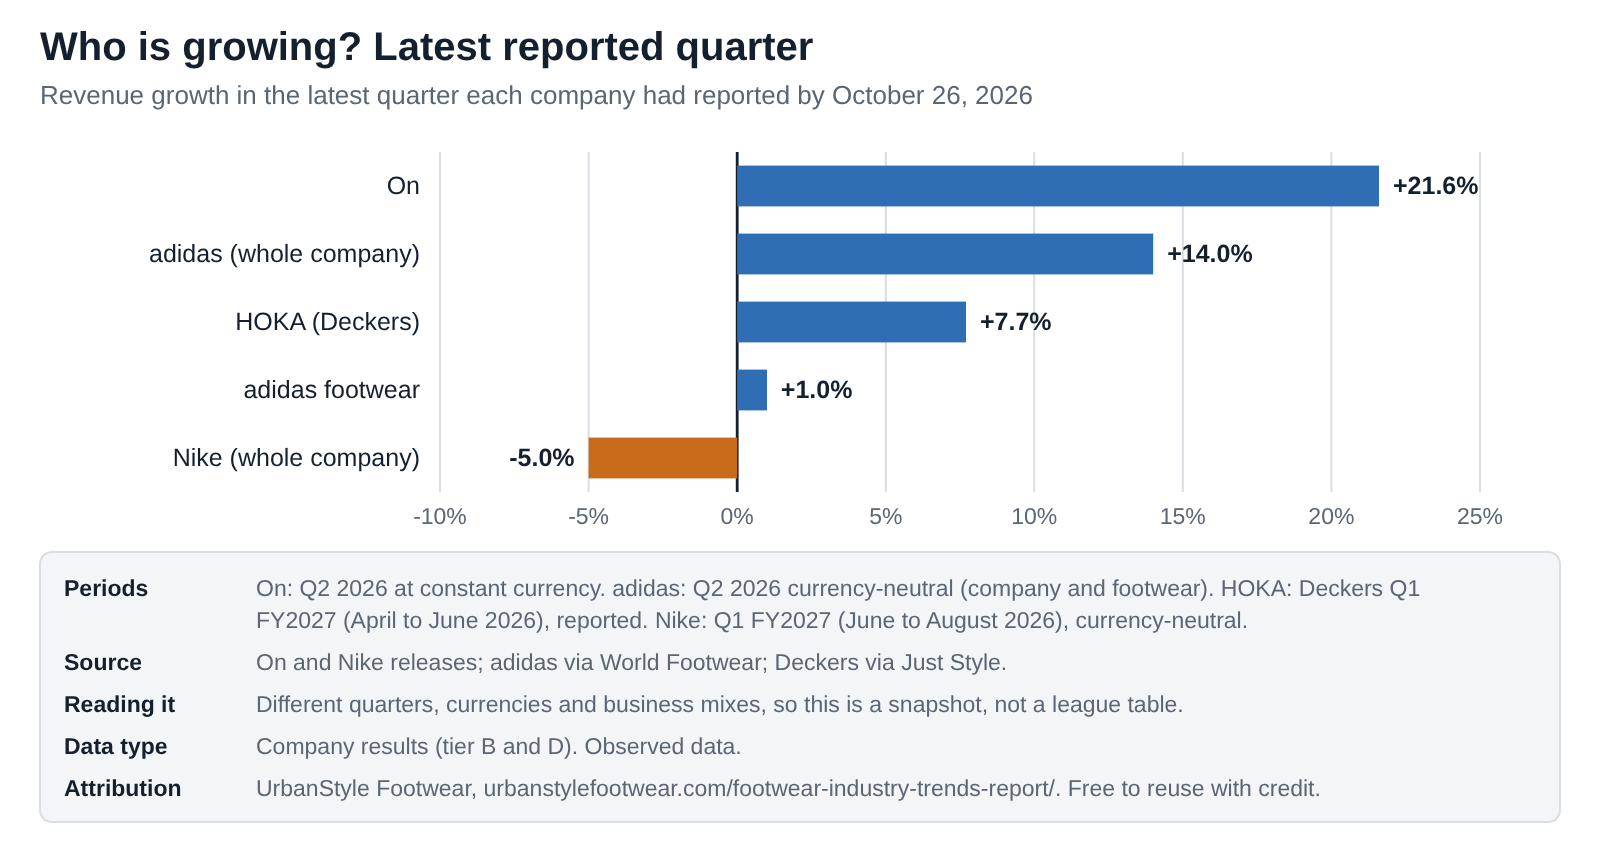
Short answer. Running-led brands. In the latest reported quarters, On grew 21.6% at constant currency, adidas 14% (footwear 1%), HOKA 7.7%, and Nike fell 5% currency-neutral. (Observed)
Embed this chart
<figure style="margin:0"><a href="https://urbanstylefootwear.com/footwear-industry-trends-report/"><img src="https://urbanstylefootwear.com/wp-content/uploads/2026/10/usf-footwear-brand-growth-latest-quarter-2026.png" alt="Bar chart of latest quarterly growth: On +21.6%, adidas +14%, HOKA +7.7%, adidas footwear +1%, Nike -5%" width="800" style="max-width:100%;height:auto"></a><figcaption>Source: UrbanStyle Footwear, based on company results. <a href="https://urbanstylefootwear.com/footwear-industry-trends-report/">Footwear Industry Trends Report 2027</a></figcaption></figure>Click the code, press Ctrl+C (Cmd+C on Mac), and paste it into any web page. Please keep the attribution link.
View as table
| Company or line | Growth | Period |
|---|---|---|
| On | +21.6% | Q2 2026, constant currency |
| adidas (whole company) | +14.0% | Q2 2026, currency-neutral |
| HOKA (Deckers) | +7.7% | Q1 FY2027 (Apr to Jun 2026), reported |
| adidas footwear | +1.0% | Q2 2026, currency-neutral |
| Nike (whole company) | -5.0% | Q1 FY2027 (Jun to Aug 2026), currency-neutral |
Margins tell a similar story. On’s gross margin was 65.4% in Q2 2026, Deckers’ 56.4% and adidas’s 52.5%, while Nike’s was 42.8%, up 60 basis points on lower warehousing and logistics costs. For guidance on 2026 and 2027, see the published forecasts.
Sources: Nike and On results (tier B); adidas via World Footwear and Deckers via Just Style (tier D).Product and technology: what the numbers show
Technology is the hardest trend to measure, because companies rarely publish figures on it. These are the signals I could tie to data.
- Performance foams and running shoes are where shoppers spend. Running grew 13% in units as well as dollars in H1 2026, so people are buying more performance shoes, not only paying more. (Observed)
- Factories are getting paid more per pair. Yue Yuen, which makes shoes for Nike, adidas and ASICS, raised its average factory price 3.7% to US$21.00 a pair in 2025, while shipping slightly fewer pairs (252.2 million). Athletic and outdoor shoes were about four-fifths of its manufacturing revenue. (Observed)
- Logistics is a margin lever. Nike credited its latest gross-margin gain mainly to lower warehousing and logistics costs. (Observed)
- Comfort leads. Circana names comfort as the leading purchase driver, which favours cushioned and supportive designs. (Observed survey)
My shoe materials guide explains the foams, uppers and soles behind these products.
Sources: Circana (tier C); Yue Yuen 2025 results via SGI Europe (tier D); Nike (tier B).Sustainability and regulation: what changed in 2026?
Short answer. Since 19 July 2026, large companies in the EU have been banned from destroying unsold clothing, clothing accessories and footwear, under the Ecodesign for Sustainable Products Regulation. Medium-sized companies follow in 2030. (Observed)
Destruction is still allowed in set cases, such as unsafe or damaged products, products that infringe intellectual property, and products no one would take as a donation for at least eight weeks. Companies must keep the evidence for five years. For a business that overbuys, this turns excess stock from a write-off into something that has to be sold, donated or recycled. Combined with flat volumes and rising prices, I’d expect it to push brands toward tighter buying in 2027.
Source: European Commission circular economy platform, August 12, 2026 (tier B); exceptions as summarised by Beveridge & Diamond (tier D). The last two sentences are my analysis.Country comparison: the big six
Market size, production and trade measure different things, so each column stands alone. “n/a” means no comparable figure in the sources used.
| Country | Household spending | Pairs made | Pairs bought | Exports | Imports |
|---|---|---|---|---|---|
| United States | $116.1B (2024) | about 25M | 1,950M | $1.3B | $27.2B |
| China | n/a | 13,660M | 4,817M | $46.2B | $5.7B |
| India | n/a | 3,000M | 2,772M | $2.5B | $0.6B |
| Vietnam | n/a | 1,658M | n/a | over $24B | n/a |
| Germany | $18.3B (2024) | n/a | n/a | $12.5B | $16.1B |
| Italy | $10.9B (2024) | 118.4M | n/a | $13.7B | $8.8B |
What do published forecasts say about 2027?
Short answer. No official body forecasts footwear. The IMF expects world growth to pick up to 3.4% in 2027 and US inflation to ease to 2.8%. Circana expected US footwear sales to end 2026 roughly flat. Nike expects its fiscal 2027 revenue to fall, while adidas, On and Deckers guide to growth. (Published forecasts)
| Forecast | Value | Publisher and date |
|---|---|---|
| World GDP growth, 2027 | 3.4% | IMF World Economic Outlook, October 2026 (as reported) |
| World GDP growth, 2026 | 3.1% | IMF World Economic Outlook, October 2026 (as reported) |
| US GDP growth, 2027 | 2.3% | IMF, October 2026 (as reported) |
| US consumer inflation, 2026 and 2027 | 3.6% then 2.8% | IMF, October 2026 (as reported) |
| China GDP growth, 2027 | 4.0% | IMF, October 2026 (as reported) |
| US footwear sales, 2026 | Roughly flat | Circana Future of Footwear (August 2026) |
| Nike revenue, fiscal 2027 (to May 2027) | Down high single digits | Nike guidance, October 1, 2026 |
| adidas revenue, 2026 | +9% to +10% currency-neutral | adidas guidance, July 2026 |
| On net sales, 2026 | Low-20% range, constant currency | On guidance, August 2026 |
| Deckers sales, fiscal 2027 (to March 2027) | $5.86B to $5.91B; HOKA low double digits | Deckers guidance, July 2026 |
| Global footwear consumption, 2026 | About +10.5% (executives' average expectation) | World Footwear Business Conditions Survey, April 2026 |
My read: what to expect in 2027
This section is my analysis, not data. It is what I would plan for if I were buying shoes for a store in 2027, based on the evidence above.
- Price will do more of the work than volume. Pairs have been flat for two years and executives expect higher prices. I’d plan for modest unit growth at best, with sales growth coming from price and mix.
- Running and comfort will keep outgrowing lifestyle. The gap in 2026 was too wide to close in a year: running +13% against sport lifestyle down.
- Sourcing will keep spreading out of China for the US market, toward Vietnam, Indonesia, Cambodia and India, while China stays the world’s workshop for everything else.
- Brands will keep rebalancing channels. Nike’s move back toward wholesale is the signal to watch; if its digital decline slows, the reset worked.
- Stock discipline will matter more, with the EU destruction ban and buyers wary of overbuying into a flat-volume market.
I’ll check these against what actually happens in the 2028 edition.
Where the data in this report comes from
Select a step to see each kind of source and how I use it.
1Official statisticsBEA, BLS, Census, Eurostat, UN Comtrade
Measure spending, prices, online sales and trade. Slow but consistent; the backbone of the observed data.
2Company resultsNike, adidas, On, Deckers, Yue Yuen
Quarterly results show which brands and channels are growing. Each uses its own calendar and currency.
3Retail tracking and surveysCircana, World Footwear executive survey
Show categories, units and how shoppers and executives feel. Useful early signals, not full counts.
4Industry yearbookAPICCAPS World Footwear Yearbook 2026
The only global source for pairs made, consumed and traded. Published once a year with a one-year lag.
5Forecasts and my analysisIMF, Circana, company guidance, UrbanStyle
Look ahead. Always labelled, never mixed with measured data.
How good is the evidence behind this report?
Short answer. Of the 65 rows in this report’s dataset, 18% are official statistics or company filings (tier B), 18% are industry research and retail tracking (tier C), 32% are reported by trade press or news agencies (tier D) and 31% are my calculations (tier E).
| Evidence tier | Rows | Share |
|---|---|---|
| A Peer-reviewed research | 0 | 0% |
| B Official statistics | 12 | 18% |
| C Industry research | 12 | 18% |
| D Secondary reporting | 21 | 32% |
| E UrbanStyle calculations | 20 | 31% |
| Total | 65 | 100% |
Sources and evidence tiers
Evidence hierarchy
- APeer-reviewed research. Not used in this report.
- BOfficial statistics and company filings. BEA, BLS, US Census Bureau, Eurostat, UN Comtrade, the European Commission, and Nike and On results.
- CIndustry research and retail tracking. The World Footwear Yearbook 2026 and Circana.
- DSecondary reporting. Trade press reports of company results and surveys, and news reports of the IMF outlook.
- ECalculations and analysis. Price changes, shares, the scorecard and “My read”.
Source table
| Source | Year | Sample | Geography | Finding used | Tier | Series ID | Primary source |
|---|---|---|---|---|---|---|---|
| US Bureau of Economic Analysis, personal consumption expenditures on footwear (FRED DFTWRC1A027NBEA, updated September 30, 2026) | 2025 | US national accounts | United States | $121.150 billion in 2025 and $116.061 billion in 2024; real growth 4.3% in 2025 | B | DFTWRC1A027NBEA | FRED series |
| US Bureau of Labor Statistics, Consumer Price Index: footwear (CUUR0000SEAE) and all items (CPIAUCNS), via FRED (updated October 14, 2026) | 2026 | Official monthly price index, not seasonally adjusted | United States | Footwear CPI 154.506 in September 2026 against 149.463 a year earlier; all items 336.940 against 324.800 | B | CUUR0000SEAE; CPIAUCNS | FRED series |
| US Census Bureau, quarterly e-commerce report (FRED ECOMPCTSA) | 2026 | Official retail survey | United States | E-commerce was 17.1% of US retail sales in Q2 2026 (all retail, not shoes alone) | B | ECOMPCTSA | FRED series |
| Eurostat, household final consumption expenditure by purpose (COICOP 2018), nama_10_cp18, footwear | 2024 | National accounts of 27 EU countries | European Union | EU27 footwear spending EUR 75,257.7 million in 2024 | B | nama_10_cp18, CP032 | Eurostat data browser |
| United Nations Comtrade database, US-reported footwear imports 2019 to 2025 (HS 64) | 2025 | Customs records | United States | Vietnam 36.1% and China 26.1% of US footwear import value in 2025 (China 49.8% in 2019) | B | HS 64 | UN Comtrade |
| NIKE, Inc., fiscal 2027 first quarter results (October 1, 2026) | 2026 | Company results | Global | Revenue $11.2 billion, down 4% reported and 5% currency-neutral; NIKE Direct down 8%; Digital down 13%; wholesale down 1%; gross margin 42.8%, up 60 basis points; fiscal 2027 revenue expected to decline high single digits | B | n/a | Nike release |
| On Holding AG, results for the second quarter of 2026 (Form 6-K exhibit) | 2026 | Company results | Global | Net sales CHF 850.3 million, up 13.5% reported and 21.6% at constant currency; DTC 45.7% of sales; gross margin 65.4%; 2026 growth expected in the low-20% range at constant currency | B | Form 6-K Exhibit 99.3 | SEC exhibit |
| European Commission circular economy platform, "Ban on destruction of unsold clothes and shoes enters into application" (August 12, 2026) | 2026 | Official EU notice | European Union | Destroying unsold clothing, accessories and footwear banned for large companies from 19 July 2026 under the Ecodesign for Sustainable Products Regulation; medium-sized companies from 2030 | B | n/a | EU notice |
| Circana, "Performance shoe sales pick up the pace amid selective US consumer spending in the footwear market" (August 17, 2026) | 2026 | Retail tracking data | United States | H1 2026 footwear dollars +1% with units down; performance +6%; running +13% in dollars and units; fashion flat; comfort the leading purchase driver; nearly half delayed purchases or chose cheaper options; 2026 expected to end roughly flat | C | n/a | Circana article |
| APICCAPS, World Footwear Yearbook 2026, and its summaries by World Footwear and APLF (July and August 2026) | 2026 | Industry yearbook, 2025 data | Global | Production 24.6 billion pairs (+0.1%); China 55.6%; export value $172 billion (+1.6%); average export price $11.65 a pair | C | n/a | Yearbook sample (PDF) |
| World Footwear, "adidas delivers record second-quarter revenue" (August 3, 2026), reporting adidas Q2 2026 results | 2026 | Company results reported by trade press | Global | Q2 revenue EUR 6.74 billion, up 14% currency-neutral; footwear up 1%; gross margin 52.5%; 2026 guidance raised to 9% to 10% growth | D | n/a | World Footwear article |
| Just Style, "Deckers Q1 FY27 result" (July 27, 2026) | 2026 | Company results reported by trade press | Global | HOKA net sales $703.5 million, up 7.7%; gross margin 56.4%; fiscal 2027 sales guidance $5.86 to $5.91 billion, HOKA low double-digit growth | D | n/a | Just Style article |
| World Footwear, "Global footwear trade weakens in early 2026" (June 30, 2026) | 2026 | Trade press report of national data, euros | Global | Q1 2026: US imports -18.0% in value and -11.8% in pairs; China exports -17.6% in value; Vietnam -9.3% | D | n/a | World Footwear article |
| SGB Online, "Exec footwear executive survey shows business optimism slipping" (June 8, 2026), reporting the 14th World Footwear Business Conditions Survey (April 2026) | 2026 | 108 footwear executives (40% Asia, 33% Africa, 17% Europe, 6% South America, 4% North America) | Global | 61% expect strong business conditions over the next six months (71% in late 2025); almost 90% expect retail prices to rise; over 80% expect global consumption to grow in 2026, average expectation about 10.5% | D | n/a | SGB Online article |
| SGI Europe, "Yue Yuen 2025: manufacturing stable, retail weighing on earnings", reporting Yue Yuen Industrial results for 2025 | 2026 | Company results reported by trade press | Global | Average selling price US$21.00 a pair in 2025, up 3.7%; 252.2 million pairs shipped; athletic and outdoor shoes about four-fifths of manufacturing revenue | D | n/a | SGI Europe article |
| Beveridge & Diamond, "EU clarifies ban on destruction of unsold apparel, clothing accessories, and footwear" | 2026 | Law firm analysis | European Union | Exceptions include unsafe, damaged or IP-infringing products and products not accepted for donation within eight weeks; evidence kept for five years; medium-sized companies from July 19, 2030 | D | n/a | Beveridge & Diamond article |
| IMF World Economic Outlook, October 2026, as reported by Bernama (October 13, 2026) and SteelOrbis (October 14, 2026) | 2026 | Official forecasts reported by news agencies | Global | World growth 3.1% in 2026 and 3.4% in 2027; US 2.3% in both years; US inflation 3.6% in 2026 and 2.8% in 2027; China 4.5% and 4.0% | D | n/a | Bernama article |
| UrbanStyle Footwear research pages: imports and exports, producing countries, market size, cost to make a shoe, US market, online shopping, returns and running statistics (October 2026) | 2026 | Earlier pages in this series, each fully sourced | Global | Figures carried into this report are sourced on those pages | E | n/a | Footwear statistics hub |
| UrbanStyle Footwear calculations and analysis on this page | 2026 | Arithmetic and labelled opinion | Global | Year-on-year changes, the scorecard and the "my read" sections | E | n/a | Methodology |
Methodology and limitations
How I built this report. I started from the four research pages built for this report (imports and exports, producing countries, market size, cost of a shoe) and the earlier UrbanStyle statistics pages, each with its own sources and dataset. I then added data published up to October 26, 2026: BLS consumer prices to September 2026, Nike’s fiscal 2027 first quarter, On’s and adidas’s second quarter, Deckers’ first fiscal quarter, Circana’s first-half review, the World Footwear executive survey, the EU destruction ban and the IMF’s October 2026 outlook. Price changes are my calculations from index values.
Labels. Measured figures are “observed data”; projections and guidance are “published forecasts”; my opinions are “UrbanStyle analysis” and are written in the first person.
Limitations you should know about
- Mostly US and Europe. Official spending, price and channel data are much richer there than in Asia, Africa or Latin America.
- Different periods. Companies report on different fiscal calendars and currencies.
- IMF figures as reported. I read them through two news agencies that agree, not the IMF document itself.
- No shoe-specific forecast. Forecasts here are economy-wide, market-tracker or company guidance.
- Trade press for some company figures. adidas and Deckers figures come through trade press reports of their releases.
Data freshness
| Date | Change |
|---|---|
| October 26, 2026 | First edition. Data cutoff October 26, 2026; forecast period 2026 to 2027. |
| November and December 2026 | Planned light updates: adidas Q3, BLS October and November CPI, Census Q3 e-commerce, Nike Q2. |
| October 2027 | Next annual edition, checking “My read” against outcomes. |
Corrections. If you spot an error or have better data, email info@urbanstylefootwear.com with the subject “Data correction”. How we review products is explained in our methodology.
For journalists and researchers
You can use the statistics and charts in this report with credit to UrbanStyle Footwear. Wherever you can, please cite the original source printed with each statistic.
A sentence you can use. “The footwear industry enters 2027 growing in value but not in volume: the world made 24.6 billion pairs in 2025, flat on 2024, while US footwear prices rose 3.4% in the year to September 2026 after peaking at 5.2% in May.” (Sources: World Footwear Yearbook 2026; BLS; UrbanStyle Footwear Trends Report 2027)
Media kit
All figures with value, unit, geography, segment, basis, period, source and evidence tier.
Four charts with source, scope and data type printed on each image. SVG versions are under each chart above.
The 15 citable statistics on one printable PDF.
Every source with year, sample, geography, tier, series ID and link.
All 19 scorecard rows with value, direction, label and source.
Ready-made citations below. Media and research enquiries go to info@urbanstylefootwear.com.
Cite this report
Suggested citation
UrbanStyle Footwear. “Footwear Industry Trends Report 2027: Market Data, Consumer Shifts and Forecasts.” Updated October 26, 2026. https://urbanstylefootwear.com/footwear-industry-trends-report/
APA style
Vahith, A. (2026, October 26). Footwear industry trends report 2027: Market data, consumer shifts and forecasts. UrbanStyle Footwear. https://urbanstylefootwear.com/footwear-industry-trends-report/
Link (HTML)
<a href="https://urbanstylefootwear.com/footwear-industry-trends-report/">Footwear Industry Trends Report 2027 by UrbanStyle Footwear</a>Click any citation, then press Ctrl+C (Cmd+C on Mac) to copy it.
For individual statistics, UrbanStyle recommends citing the original source listed in the source table whenever possible.
Data requests. Data correction or dataset request: info@urbanstylefootwear.com
Frequently asked questions
What are the biggest footwear industry trends for 2027?
Five stand out in the data: prices rising faster than volumes, sourcing moving from China to Vietnam and India, running and performance shoes outgrowing the rest of the market, brands rebalancing between their own stores and wholesale, and new EU rules on unsold stock. See the executive summary.
Is the footwear industry growing?
In money, slowly. US household footwear spending rose 4.4% in 2025 and world export value 1.6%, but world production was flat at 24.6 billion pairs, and US footwear sales rose only 1% in the first half of 2026 with fewer units sold.
Are shoe prices going up in 2026?
Yes. US footwear prices were 3.4% higher in September 2026 than a year earlier, after a peak of 5.2% in May, by BLS data. Almost 90% of footwear executives surveyed in April 2026 expected retail prices to rise further.
How have tariffs affected the footwear industry?
US footwear imports fell 18% in value in the first quarter of 2026, and the share coming from China fell to 26.1% in 2025. Tariff rules changed several times in 2025 and 2026; my cost of a shoe page has the timeline.
Which footwear categories are growing fastest?
In the US, running shoes rose 13% and performance footwear 6% in the first half of 2026, while sport lifestyle declined and fashion was flat (Circana). Ballerinas grew by double digits. See my running shoe statistics.
Are people buying more shoes online?
All US retail e-commerce reached 17.1% of sales in Q2 2026, but there is no official shoe-only figure. Nike’s own digital sales fell 13% in its latest quarter while On sells 45.7% direct. See my online shoe shopping statistics.
Which footwear brands are growing in 2026?
Among the companies I checked, On grew 21.6% at constant currency in Q2 2026, adidas 14% (footwear 1%) and HOKA 7.7% in the quarter to June, while Nike fell 5% currency-neutral in the quarter to August 2026.
Where will shoes be made in 2027?
Mostly where they are now: China made 55.6% of the world’s shoes in 2025. But for the US market Vietnam already supplies more by value, and India’s and Vietnam’s production shares have risen since 2019. See producing countries.
What is the footwear industry forecast for 2027?
There is no official footwear forecast. The IMF expects world growth of 3.4% in 2027 and lower US inflation; Circana expected 2026 US footwear sales to end roughly flat; Nike expects its fiscal 2027 revenue to fall. See published forecasts.
What sustainability rules affect footwear?
In the EU, large companies have been banned from destroying unsold footwear since 19 July 2026, under the Ecodesign for Sustainable Products Regulation, with medium-sized firms following in 2030. See sustainability.
How big is the global footwear market?
No official global figure exists. World footwear exports were worth $172 billion in 2025, US households spent $121 billion and EU households about $81 billion. See footwear market size by country.
What is the data cutoff for this report?
October 26, 2026. Observed data runs to September 2026 for US prices, the second or third quarter of 2026 for companies and 2025 for production and trade. The forecast period is 2026 to 2027.
How is this report different from paid industry reports?
Every figure is sourced and free, and each one is labelled as observed data, a published forecast or my analysis. It draws on the UrbanStyle research pages, which publish their full datasets.
Can I use these statistics and download the report?
Yes, with credit to UrbanStyle Footwear, and cite the original source for any single statistic where you can. The CSV, XLSX, charts and a printable PDF of the key statistics are in the media kit, with citation formats.