
I wanted to know how many Americans run, whether running shoe sales are really booming, and what the research says about shoes and injuries. The answers are scattered across trade groups, company results and journals, and most of the numbers measure different things. This page puts the ones I could trace to a source in one place, dated, linked and graded, with the data free to download.
Six headline numbers on running. Select one to see what it counts and where it comes from.
Select a topic above, for example “Sales”, to see what the number counts.
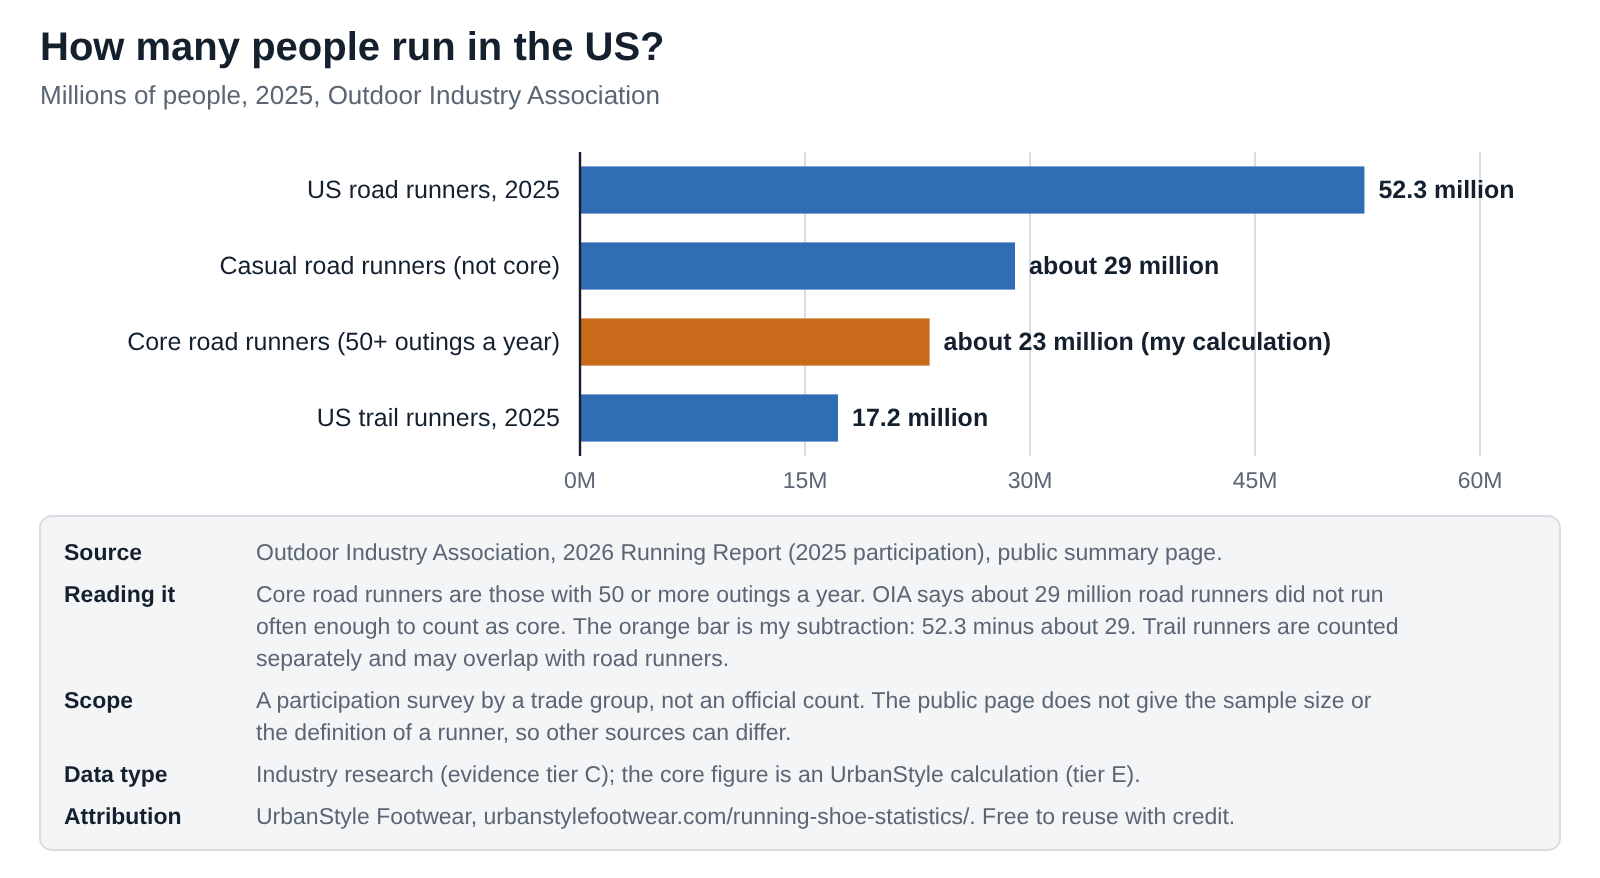
52.3MThe Outdoor Industry Association counted 52.3 million US road runners in 2025 (tier C). About 29 million of them did not run often enough to count as core. There is no official count of runners.
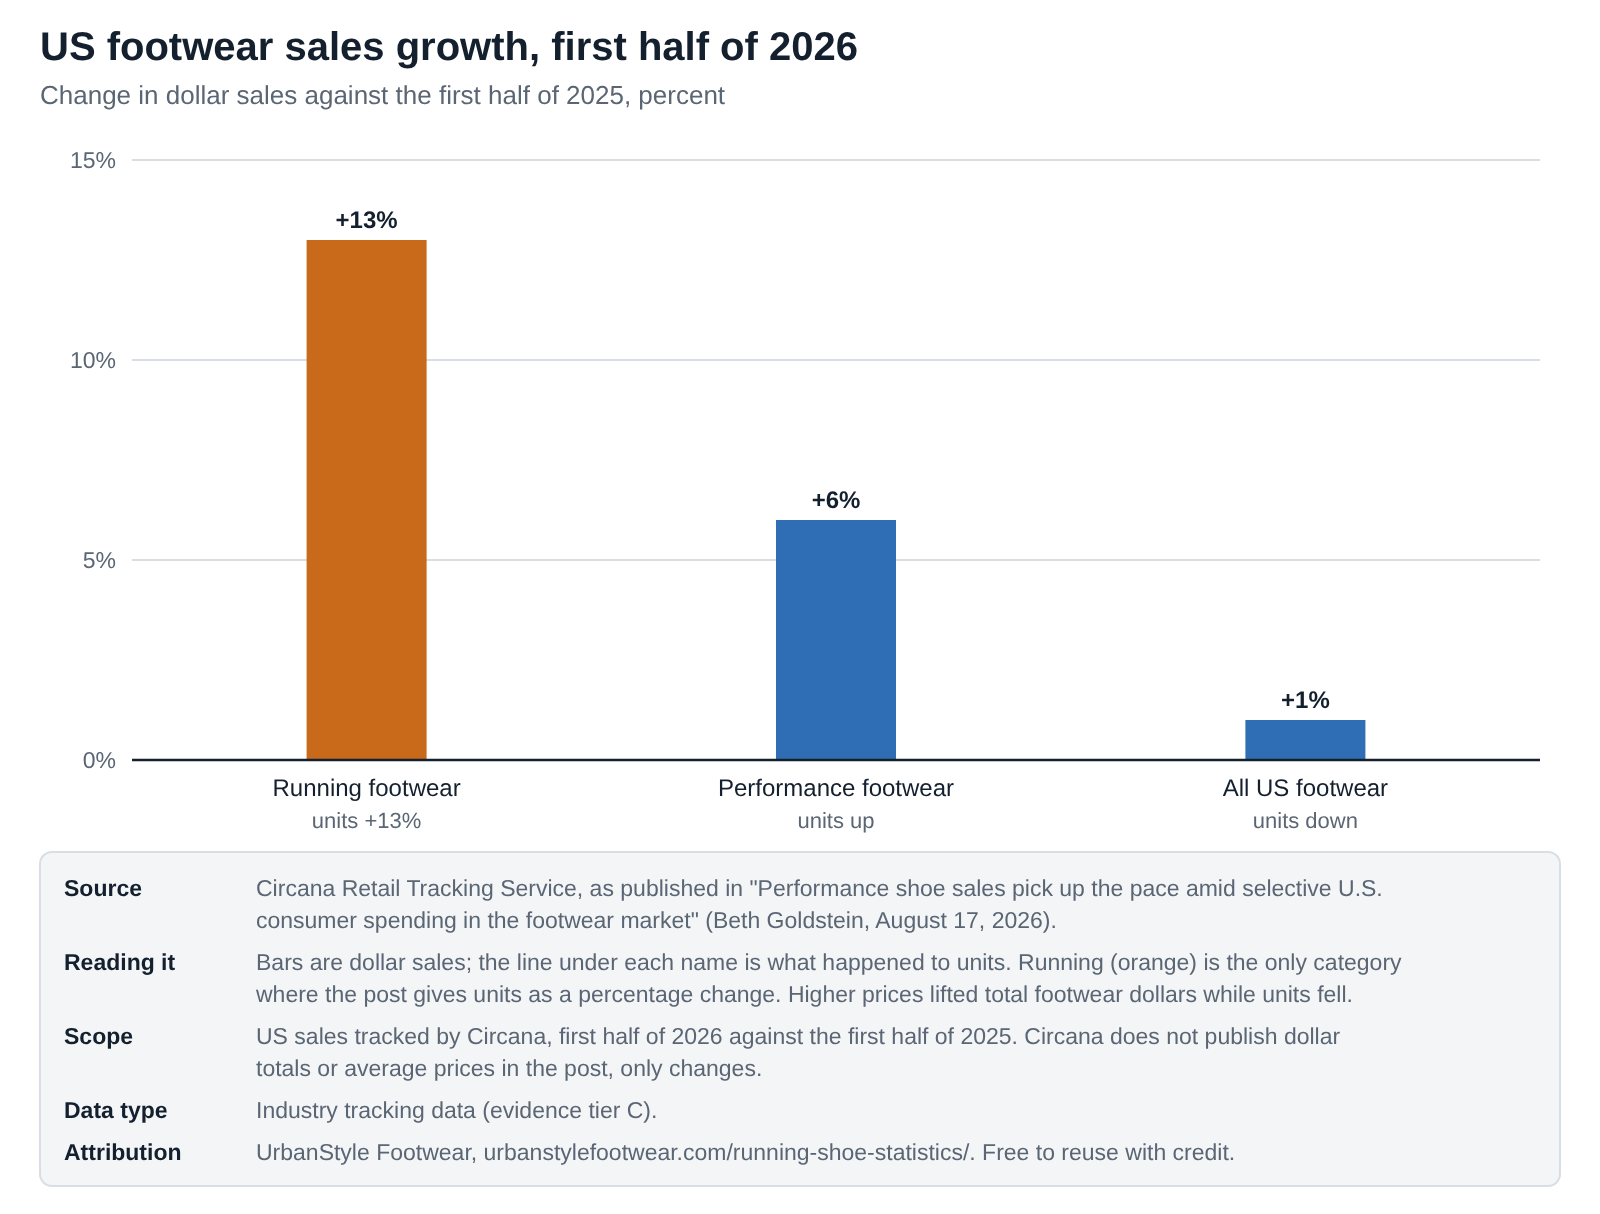
+13%Circana says US running shoe sales rose 13% in dollars and 13% in units in the first half of 2026 against a year earlier (tier C). Total US footwear dollar sales rose 1%.
about flatDollars and units both rose 13%, so the average price of a running pair looks roughly flat (my inference, tier E). Circana does not publish an average price.
7.7 vs 17.8A meta-analysis of 13 studies found 7.7 injuries per 1,000 hours for recreational runners and 17.8 for novices (tier A). The studies defined injury in different ways.
no clear edgeA Cochrane review of 12 trials found little or no clear difference in injuries between types of running shoe, with low or very low certainty for most comparisons (tier A).
4%In a lab study of 18 men, a Nike prototype lowered the energy cost of running by about 4% against two other marathon shoes (tier A). It does not show the same gain for every runner.
Each number names its source and evidence tier. All fifteen of my citable statistics are further down this page.
Running shoe statistics at a glance
Quick answer. Running is busy and running shoes are selling, but the numbers are softer than they look. The Outdoor Industry Association counted 52.3 million US road runners in 2025, and Circana says US running shoe sales rose 13% in dollars and 13% in units in the first half of 2026, against 1% for all footwear. The best research I found says no type of running shoe clearly prevents injury: recreational runners get hurt about 7.7 times per 1,000 hours and novices 17.8. A carbon-plate racing prototype cut energy cost by about 4% in a lab study of 18 men. Nobody publishes an official count of runners, an average running shoe price or a reliable market size, so I don’t quote one.
This is the numbers page. If you want shoe picks, start with my best running shoes under $100 or the New Balance vs Brooks vs Hoka comparison. For the wider market, see the footwear statistics hub and my US footwear market statistics.
Key findings
- The Outdoor Industry Association (OIA) counted 52.3 million US road runners in 2025 and 17.2 million trail runners. About 29 million of the road runners did not run often enough to count as core, which OIA defines as 50 or more outings a year. That leaves roughly 23 million core runners (my subtraction). It is a trade-group survey, not an official count.
- Running is growing but getting more casual. OIA says casual road running has grown about 7% a year over three years while core road running is down about 1.1%.
- Races are busier per event. RunSignup says average per-race participation rose 5% from 2024 to 2025, after 8% and 11% in the two years before. US marathon participation was 432,562 in 2024, still 12.8% below the 2014 peak of 496,178 (RunRepeat).
- Running shoes are the strongest part of a flat market. Circana says US running shoe dollar sales and unit sales both rose 13% in the first half of 2026, performance footwear dollars rose 6%, and all footwear dollars rose 1% with units down.
- Prices did not drive the running gain. Because dollars and units both rose 13%, the average price of a running pair looks roughly flat. That is my inference from rounded figures, since Circana publishes no average price.
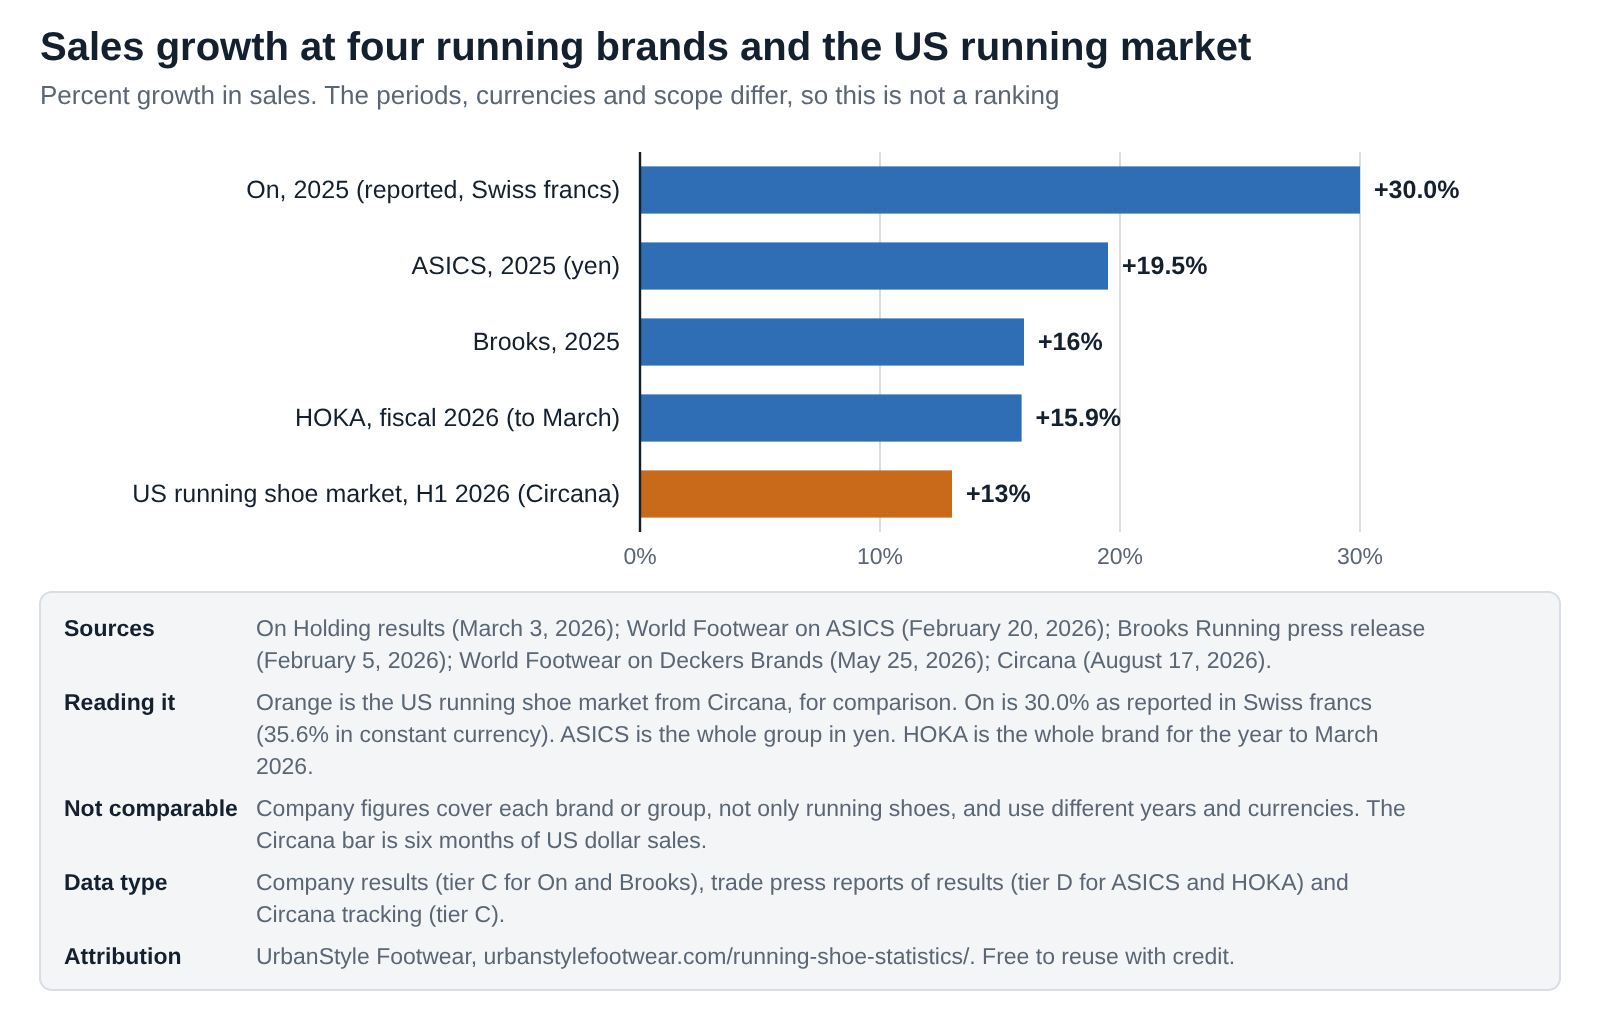
- Four running brands reported double-digit growth: On 30.0% in 2025, ASICS 19.5%, Brooks 16% and HOKA 15.9% in its year to March 2026. The periods, currencies and scope differ and none is running only, so it is not a ranking.
- Recreational runners had 7.7 injuries per 1,000 hours of running and novices 17.8, about 2.3 times as many (my calculation), in a meta-analysis of 13 studies. The studies defined injury differently.
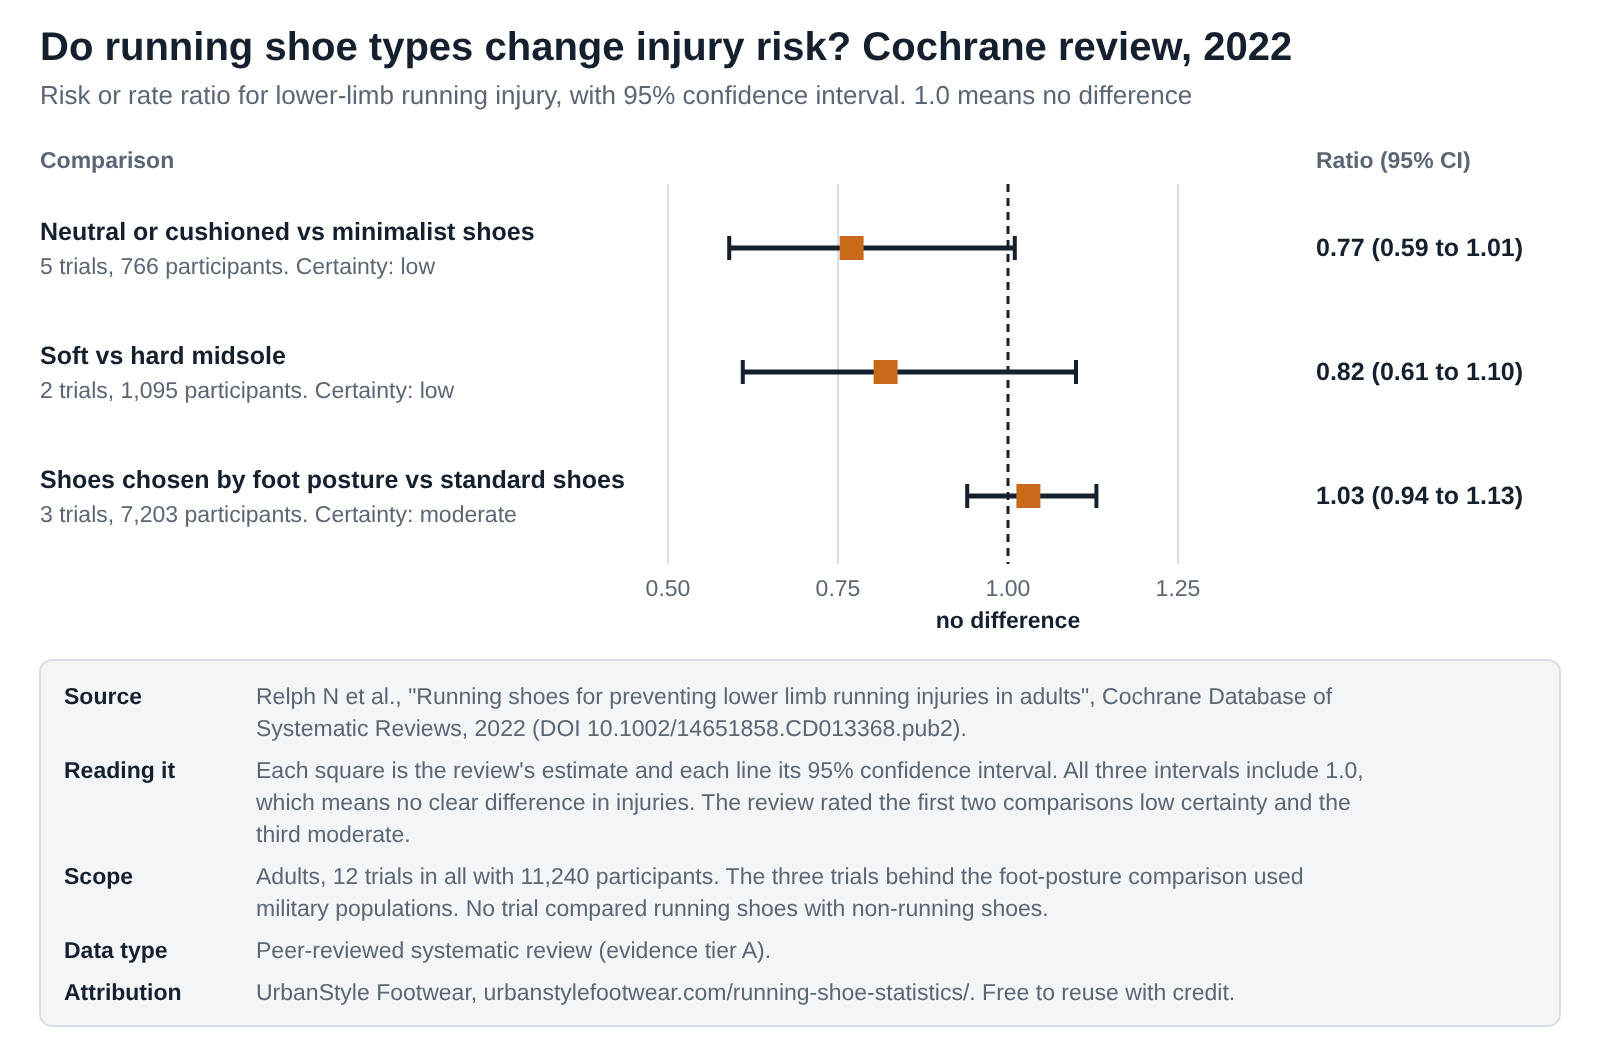
- No shoe type has a clear injury edge. A Cochrane review of 12 trials with 11,240 participants found little or no clear difference between types of running shoe, mostly at low or very low certainty. Choosing shoes by foot posture probably makes little or no difference, but those trials used military recruits.
- Carbon-plate racing shoes have a measured effect, in a narrow setting. In a lab study of 18 male high-caliber runners, a Nike prototype lowered the energy cost of running by about 4%, with individual gains of roughly 1.6% to 6.3%.
- Shoe life is brand guidance. Brooks says performance running shoes typically last 300 to 500 miles, or 4 to 6 months of regular use. I found no independent test.
What we know about running shoes and what we don’t
Here’s where the public evidence stands as of October 2026. Official statistics barely touch running, so most of this rests on trade groups, companies and journals.
| Question | Evidence status | Why |
|---|---|---|
| How many Americans run | Industry estimate | OIA says 52.3 million road runners in 2025. No official count, and definitions differ by source |
| Running shoe sales growth | Industry tracking | Circana gives percent changes for the first half of 2026, not dollar totals |
| Running shoe market size in dollars | No verified figure | Published forecasts range from $2.9 billion to about $53 billion with no public methods |
| Average price of a running shoe | No verified figure | Only my inference that it was roughly flat in the first half of 2026 |
| Pairs bought per runner | No verified figure | I found no source I could open |
| Brand share of US running sales | No verified figure | Brooks claims the number one spot at specialty retail, but I could not tell what data it rests on |
| How often runners get injured | Peer-reviewed | Meta-analysis of 13 studies, with varying injury definitions |
| Whether shoe type prevents injury | No clear effect | Cochrane review, low to very low certainty for most comparisons |
| Whether carbon plate shoes help | Small study | One lab study of 18 men; I did not review later studies |
| How long shoes last | Brand guidance | Brooks says 300 to 500 miles; no independent test found |
15 running shoe statistics you can cite
Each card has one number, one sentence of context and its source. “Copy text” opens a box with the sentence, the source and a link back here. Please cite the original source for any single statistic. Cards marked E are my own calculations, and the method is on the card or in the dataset.
The Outdoor Industry Association counted 52.3 million US road runners in 2025, second only to hiking among outdoor activities in its summary. It is a trade-group survey, not an official count.
Copy text
52.3M US road runners, 2025: The Outdoor Industry Association counted 52.3 million US road runners in 2025, second only to hiking among outdoor activities in its summary. It is a trade-group survey, not an official count. Source: Outdoor Industry Association, 2026. Via UrbanStyle Footwear: https://urbanstylefootwear.com/running-shoe-statistics/
About 29 million of those road runners did not run often enough to count as core, which OIA defines as 50 or more outings a year (Outdoor Industry Association).
Copy text
about 29M road runners who are not core: About 29 million of those road runners did not run often enough to count as core, which OIA defines as 50 or more outings a year (Outdoor Industry Association). Source: Outdoor Industry Association, 2026. Via UrbanStyle Footwear: https://urbanstylefootwear.com/running-shoe-statistics/
There were 17.2 million US trail runners in 2025, up 6.6% on the year and 57% since 2019 (Outdoor Industry Association).
Copy text
17.2M US trail runners, 2025: There were 17.2 million US trail runners in 2025, up 6.6% on the year and 57% since 2019 (Outdoor Industry Association). Source: Outdoor Industry Association, 2026. Via UrbanStyle Footwear: https://urbanstylefootwear.com/running-shoe-statistics/
RunRepeat counted 432,562 US marathon participants in 2024, 12.8% below the 2014 peak of 496,178. Women were 41% of participants.
Copy text
432,562 US marathon participants, 2024: RunRepeat counted 432,562 US marathon participants in 2024, 12.8% below the 2014 peak of 496,178. Women were 41% of participants. Source: RunRepeat, 2025. Via UrbanStyle Footwear: https://urbanstylefootwear.com/running-shoe-statistics/
Average participation per race grew 5% from 2024 to 2025 on RunSignup, after 8% in 2024 and 11% in 2023 (RunSignup RaceTrends).
Copy text
+5% per-race participation, 2025: Average participation per race grew 5% from 2024 to 2025 on RunSignup, after 8% in 2024 and 11% in 2023 (RunSignup RaceTrends). Source: RunSignup RaceTrends, 2026. Via UrbanStyle Footwear: https://urbanstylefootwear.com/running-shoe-statistics/
US running shoe dollar sales rose 13% in the first half of 2026, against 1% for all footwear, according to Circana. Running units also rose 13%, while total footwear units fell.
Copy text
+13% vs +1% running vs all US footwear, H1 2026: US running shoe dollar sales rose 13% in the first half of 2026, against 1% for all footwear, according to Circana. Running units also rose 13%, while total footwear units fell. Source: Circana, H1 2026. Via UrbanStyle Footwear: https://urbanstylefootwear.com/running-shoe-statistics/
Because running dollars and units both rose 13%, the average price per pair looks roughly flat. Circana publishes no average price, so this is my inference from rounded figures (UrbanStyle calculation).
Copy text
about flat average running shoe price, H1 2026: Because running dollars and units both rose 13%, the average price per pair looks roughly flat. Circana publishes no average price, so this is my inference from rounded figures (UrbanStyle calculation). Source: UrbanStyle calculation. Via UrbanStyle Footwear: https://urbanstylefootwear.com/running-shoe-statistics/
US footwear prices were 3.6% higher in August 2026 than a year earlier (UrbanStyle calculation from BLS index values). It covers all footwear, not running shoes.
Copy text
+3.6% all footwear prices, August 2026: US footwear prices were 3.6% higher in August 2026 than a year earlier (UrbanStyle calculation from BLS index values). It covers all footwear, not running shoes. Source: UrbanStyle calculation. Via UrbanStyle Footwear: https://urbanstylefootwear.com/running-shoe-statistics/
On Holding reported 2025 net sales of CHF 3,014.0 million, up 30.0% as reported and 35.6% in constant currency. Shoes were about 93% of sales (UrbanStyle calculation).
Copy text
+30.0% On net sales growth, 2025: On Holding reported 2025 net sales of CHF 3,014.0 million, up 30.0% as reported and 35.6% in constant currency. Shoes were about 93% of sales (UrbanStyle calculation). Source: On Holding, full year 2025. Via UrbanStyle Footwear: https://urbanstylefootwear.com/running-shoe-statistics/
HOKA net sales rose 15.9% to about $2.59 billion in the year to March 31, 2026, according to trade reports of Deckers results (secondary reporting).
Copy text
+15.9% HOKA net sales growth, fiscal 2026: HOKA net sales rose 15.9% to about $2.59 billion in the year to March 31, 2026, according to trade reports of Deckers results (secondary reporting). Source: World Footwear on Deckers. Via UrbanStyle Footwear: https://urbanstylefootwear.com/running-shoe-statistics/
Brooks reported 2025 revenue growth of 16%, with North America up 13%, Europe, Middle East and Africa up 22% and Asia Pacific and Latin America up 66% (Brooks press release).
Copy text
+16% Brooks revenue growth, 2025: Brooks reported 2025 revenue growth of 16%, with North America up 13%, Europe, Middle East and Africa up 22% and Asia Pacific and Latin America up 66% (Brooks press release). Source: Brooks press release, 2025. Via UrbanStyle Footwear: https://urbanstylefootwear.com/running-shoe-statistics/
A meta-analysis of 13 studies found 7.7 injuries per 1,000 hours of running for recreational runners and 17.8 for novices, though the studies defined injury differently (Videbaek et al., 2015).
Copy text
7.7 vs 17.8 injuries per 1,000 hours of running: A meta-analysis of 13 studies found 7.7 injuries per 1,000 hours of running for recreational runners and 17.8 for novices, though the studies defined injury differently (Videbaek et al., 2015). Source: Videbaek et al., 2015 (DOI 10.1007/s40279-015-0333-8). Via UrbanStyle Footwear: https://urbanstylefootwear.com/running-shoe-statistics/
A Cochrane review of 12 trials with 11,240 participants found little or no clear difference in running injuries between types of running shoe. Certainty was low or very low for most comparisons (Relph et al., 2022).
Copy text
12 trials found little or no clear shoe-type effect on injury: A Cochrane review of 12 trials with 11,240 participants found little or no clear difference in running injuries between types of running shoe. Certainty was low or very low for most comparisons (Relph et al., 2022). Source: Relph et al., Cochrane 2022 (DOI 10.1002/14651858.CD013368.pub2). Via UrbanStyle Footwear: https://urbanstylefootwear.com/running-shoe-statistics/
In 18 male high-caliber runners, a Nike prototype lowered the energy cost of running by about 4% against two other marathon racing shoes. Individual gains ranged from about 1.6% to 6.3% (Hoogkamer et al., 2018).
Copy text
4% lower energy cost in a racing-shoe prototype: In 18 male high-caliber runners, a Nike prototype lowered the energy cost of running by about 4% against two other marathon racing shoes. Individual gains ranged from about 1.6% to 6.3% (Hoogkamer et al., 2018). Source: Hoogkamer et al., 2018 (DOI 10.1007/s40279-017-0811-2). Via UrbanStyle Footwear: https://urbanstylefootwear.com/running-shoe-statistics/
Brooks says performance running shoes typically last 300 to 500 miles, or 4 to 6 months of regular use. It is manufacturer guidance and shows no test data.
Copy text
300 to 500 miles typical life of performance running shoes: Brooks says performance running shoes typically last 300 to 500 miles, or 4 to 6 months of regular use. It is manufacturer guidance and shows no test data. Source: Brooks support page. Via UrbanStyle Footwear: https://urbanstylefootwear.com/running-shoe-statistics/
How many people run in the US?
Short answer. The Outdoor Industry Association counted 52.3 million US road runners in 2025, plus 17.2 million trail runners. There is no official count, and the figure depends on how a “runner” is defined.
I looked for a government number first and there isn’t one. The most recent count I could trace is OIA’s 2026 Running Report, which covers 2025. Its public summary is titled “Running Is Growing. But It’s Becoming a Casual Habit, Not a Core Pursuit”, and the numbers back that up.
Embed this chart
<figure style="margin:0"><a href="https://urbanstylefootwear.com/running-shoe-statistics/"><img src="https://urbanstylefootwear.com/wp-content/uploads/2026/10/usf-us-runners-by-type-2025.png" alt="Chart of US runners in 2025: 52.3 million road runners, about 29 million casual, about 23 million core, 17.2M trail" width="800" style="max-width:100%;height:auto"></a><figcaption>Source: UrbanStyle Footwear, based on Outdoor Industry Association 2026 Running Report data. <a href="https://urbanstylefootwear.com/running-shoe-statistics/">Running Shoe Statistics 2026</a></figcaption></figure>Click the code, press Ctrl+C (Cmd+C on Mac), and paste it into any web page. Please keep the attribution link.
View as table
| Group | Millions of people | Basis |
|---|---|---|
| US road runners, 2025 | 52.3 | Outdoor Industry Association 2026 running report |
| Casual road runners (not core) | 29.0 | Outdoor Industry Association 2026 running report |
| Core road runners (50+ outings a year) | 23.3 | Outdoor Industry Association 2026 running report; the core figure is an UrbanStyle calculation (52.3 minus about 29) |
| US trail runners, 2025 | 17.2 | Outdoor Industry Association 2026 running report |
- Casual runners are most of the growth. OIA says casual road running has grown about 7% a year over three years, while core road running (50 or more outings a year) is down about 1.1%. About 29 million road runners did not run often enough to count as core, which is 55% of the total (my calculation).
- Trail running is smaller and growing. OIA puts trail runners at 17.2 million, up 6.6% in 2025 and 57% since 2019, with core trail runners up 7.8%.
- The public page has gaps. It doesn’t show the sample size, the survey method or the definition of a runner. The full report is for members, and I haven’t read it.
What the race data says
- Marathons. RunRepeat, using World Athletics data, counted 432,562 US marathon participants in 2024 from 6,352 events. That is 12.8% below the 2014 peak of 496,178. Women were 41% of participants, and the average finish time was 4:34 against 4:39 in 2019. RunRepeat excluded elite runners, walks, charity runs and obstacle races.
- All race sizes. RunSignup’s 2026 RaceTrends report says per-race participation grew an average of 5% from 2024 to 2025, after 8% in 2024 and 11% in 2023. It covers more than 97,000 events and 12.2 million registrations, and 86% of race weekends had fewer than 500 participants.
- The top races. Running USA says participation at the nation’s top races rose in 2025 across the 5K, 10K, half marathon and marathon. The release gives no figures.
- Everything else. The Sports & Fitness Industry Association says about 250 million Americans took part in at least one activity in 2025, a record. That covers 126 activities and not only running, and I couldn’t read its running-specific figures because they are in paid reports.
What you can safely say. “The Outdoor Industry Association counted 52.3 million US road runners in 2025, though about 29 million of them did not run often enough to count as core.” Name the source and the year every time.
My read. Participation is healthy but shallower than the headline suggests. More people are running a little, fewer are running a lot, and marathon numbers haven’t recovered their 2014 peak.
Sources: Outdoor Industry Association 2026 Running Report summary (tier C), RunRepeat “The State of US Marathons 2025” (tier C), RunSignup RaceTrends via Running USA (tier C), Running USA release via Endurance Sportswire (tier C), SFIA 2026 topline release (tier C). The casual share and core count are my calculations (tier E).Are running shoe sales growing in 2026?
Short answer. Yes. Circana says US running shoe sales rose 13% in dollars and 13% in units in the first half of 2026 against the first half of 2025. All US footwear dollar sales rose only 1%, with units down.
Circana tracks US retail sales, and its August 17, 2026 post is the freshest running footwear data I could find at the source. It reports changes, not totals, so I can tell you the direction and the size of the move but not how many dollars or pairs that is.
Embed this chart
<figure style="margin:0"><a href="https://urbanstylefootwear.com/running-shoe-statistics/"><img src="https://urbanstylefootwear.com/wp-content/uploads/2026/10/usf-us-footwear-sales-growth-by-category-h1-2026.png" alt="Chart of US footwear sales growth in the first half of 2026: running up 13%, performance up 6%, all footwear up 1%" width="800" style="max-width:100%;height:auto"></a><figcaption>Source: UrbanStyle Footwear, based on Circana Retail Tracking Service data, first half of 2026. <a href="https://urbanstylefootwear.com/running-shoe-statistics/">Running Shoe Statistics 2026</a></figcaption></figure>Click the code, press Ctrl+C (Cmd+C on Mac), and paste it into any web page. Please keep the attribution link.
View as table
| Category | Dollar sales change, H1 2026 | Unit sales change | Source |
|---|---|---|---|
| Running footwear | +13% | +13% | Circana Retail Tracking Service |
| Performance footwear | +6% | up | Circana Retail Tracking Service |
| All US footwear | +1% | down | Circana Retail Tracking Service |
- Running led. Circana’s own words are that running shoes “continued to lead gains, with category dollar and unit sales both climbing +13%”.
- Performance footwear rose 6% in dollars with units up, and cross-training, golf and volleyball also grew.
- Everything else was flat. Total footwear dollars rose 1%, held up by higher average selling prices while units fell. Circana says sport lifestyle footwear declined and running-inspired styles grew, though not enough to offset it.
- The price story. Running dollars and units both rose 13%, so the average price per pair looks roughly flat, within about a percentage point either way because of rounding. That is my inference. Circana gives no average price.
- The outlook is cautious. Circana’s Future of Footwear report expects 2026 to end roughly flat for the industry, with price gains offsetting lower unit demand. It says nearly half of consumers report delaying purchases or choosing lower-priced alternatives.
What this does not tell you
It doesn’t give a dollar size for running, an average price, a brand split or a definition of the running category beyond Circana’s own. For the wider picture of footwear prices, see my US footwear market statistics: all footwear prices were up 3.6% in August 2026 from a year earlier (BLS index values, my calculation), but that is not a running shoe price.
Sources: Circana, August 17, 2026 (tier C); Endurance Sportswire reprint of the same Circana data; BLS CPI footwear via FRED series CUUR0000SEAE, updated September 11, 2026 (tier B). The implied price change is my inference (tier E).Which running brands are growing fastest?
Short answer. Of the four brands I could check, On reported the fastest growth (30.0% in 2025), ahead of ASICS (19.5%), Brooks (16%) and HOKA (15.9% in its year to March 2026). All four grew faster than the US running market did in the first half of 2026 (13%), but the figures aren’t comparable.
I looked at the companies that publish growth figures. Pick a brand below to see its numbers and why I wouldn’t line it up against the others.
See each brand’s growth figure and its limits
Choose a brand to see the figure, the period it covers and how I would read it.
Select a brand above.
HOKA. Fiscal 2026, year to March 31, 2026. Net sales of about $2.59 billion, up 15.9%, according to trade reports of Deckers Brands results. Deckers expects HOKA to grow by a low double-digit percentage in fiscal 2027. HOKA is one brand inside Deckers, whose total net sales were $5.47 billion. How to read it: This is secondary reporting (tier D) because I could not open the Deckers release. The figure covers the whole brand and not only running shoes, and the fiscal year ends in March, so it does not line up with the calendar-year brands.
On. Calendar year 2025. Net sales of CHF 3,014.0 million, up 30.0% as reported and 35.6% in constant currency. Shoes were CHF 2,804.4 million, about 93% of sales (my calculation). On expects growth of at least 23% in constant currency in 2026. How to read it: Company results (tier C), in Swiss francs. The gap between 30.0% and 35.6% is exchange rates. The 2026 figure is a forecast. It covers the whole brand, not only running.
Brooks. Calendar year 2025. Revenue up 16% on 2024: North America up 13%, Europe, Middle East and Africa up 22%, and Asia Pacific and Latin America up 66%. Brooks also says it held the number one position in performance running footwear at US specialty retail in the fourth quarter. How to read it: Company press release (tier C) with no dollar figure. I could not tell what data the number one claim rests on, so treat it as Brooks's own statement.
ASICS. Calendar year 2025. Net sales of 810.9 billion yen, up 19.5%. ASICS is targeting 950 billion yen, up 17.2%, for 2026. How to read it: Secondary reporting (tier D) of company results, so I did not open the ASICS filing. The figure is the whole group, and I found no global running-only number.
Embed this chart
<figure style="margin:0"><a href="https://urbanstylefootwear.com/running-shoe-statistics/"><img src="https://urbanstylefootwear.com/wp-content/uploads/2026/10/usf-running-brand-sales-growth-2025-2026.png" alt="Chart of sales growth: On 30%, ASICS 19.5%, Brooks 16%, HOKA 15.9% and the US running shoe market up 13%" width="800" style="max-width:100%;height:auto"></a><figcaption>Source: UrbanStyle Footwear, based on company results and trade reports for On, ASICS, Brooks and HOKA, and Circana data. <a href="https://urbanstylefootwear.com/running-shoe-statistics/">Running Shoe Statistics 2026</a></figcaption></figure>Click the code, press Ctrl+C (Cmd+C on Mac), and paste it into any web page. Please keep the attribution link.
View as table
| Measure | Growth | Period and basis |
|---|---|---|
| On, 2025 (reported, Swiss francs) | +30.0% | Calendar 2025, as reported in Swiss francs; 35.6% in constant currency |
| ASICS, 2025 (yen) | +19.5% | Calendar 2025, yen, trade report |
| Brooks, 2025 | +16% | Calendar 2025, revenue |
| HOKA, fiscal 2026 (to March) | +15.9% | Year to March 31, 2026, brand net sales, trade report |
| US running shoe market, H1 2026 (Circana) | +13% | First half of 2026 against first half of 2025, dollar sales |
- It isn’t a ranking. On’s figure is in Swiss francs for calendar 2025, ASICS is the whole group in yen, HOKA is one brand inside Deckers for a year ending in March, and Brooks gives only a percentage.
- None of them is running only. HOKA, On and ASICS sell more than road running shoes, and I found no running-only figure for any of them.
- Reported against constant currency. On’s growth was 35.6% in constant currency, which strips out exchange-rate moves. The 30.0% in the chart is what it reported.
- Who is missing. Nike, New Balance, Saucony, Mizuno and others weren’t in the results I could read at the source, so this is not the whole market.
How often do runners get injured, and do running shoes prevent it?
Short answer. Recreational runners had about 7.7 injuries per 1,000 hours of running and novices 17.8. No type of running shoe has been shown to prevent injury: a Cochrane review of 12 trials found little or no clear difference.
How often runners get hurt
This comes from a meta-analysis in Sports Medicine that pooled 13 studies (eight prospective cohort studies and five randomised controlled trials).
| Type of runner | Injuries per 1,000 hours | 95% confidence interval | Studies |
|---|---|---|---|
| Novice runners | 17.8 | 16.7 to 19.1 | 5 |
| Recreational runners | 7.7 | 6.9 to 8.7 | 5 |
| Ultra-marathon runners | 7.2 | Not reported | 1 |
To make the rate concrete, I did some rough arithmetic. A runner who logs about 150 hours a year (around three hours a week for 50 weeks) would expect roughly 1.2 injuries at the recreational rate and 2.7 at the novice rate. That assumes risk is steady per hour, which it isn’t, so treat it as an illustration and not a prediction. The studies also defined injury in different ways, and the paper does not pool an overall rate across all runner types.
Does the shoe matter?
The Cochrane Library review is the best evidence I found on this. It covers 12 trials with 11,240 participants, and it found that most comparisons showed no clear difference in injuries.
Embed this chart
<figure style="margin:0"><a href="https://urbanstylefootwear.com/running-shoe-statistics/"><img src="https://urbanstylefootwear.com/wp-content/uploads/2026/10/usf-running-shoe-type-and-injury-risk-cochrane-review.png" alt="Chart of Cochrane results on running shoe type and injury risk: all three confidence intervals include 1.0" width="800" style="max-width:100%;height:auto"></a><figcaption>Source: UrbanStyle Footwear, based on the 2022 Cochrane review of running shoes and injury prevention. <a href="https://urbanstylefootwear.com/running-shoe-statistics/">Running Shoe Statistics 2026</a></figcaption></figure>Click the code, press Ctrl+C (Cmd+C on Mac), and paste it into any web page. Please keep the attribution link.
View as table
| Comparison | Ratio | 95% CI low | 95% CI high | Trials | Participants | Certainty of evidence |
|---|---|---|---|---|---|---|
| Neutral or cushioned vs minimalist shoes | 0.77 | 0.59 | 1.01 | 5 | 766 | Low |
| Soft vs hard midsole | 0.82 | 0.61 | 1.10 | 2 | 1,095 | Low |
| Shoes chosen by foot posture vs standard shoes | 1.03 | 0.94 | 1.13 | 3 | 7,203 | Moderate |
- Cushioned vs minimalist. Neutral or cushioned shoes “may make little or no difference” against minimalist shoes (5 trials, 766 people, low certainty).
- Soft vs hard midsoles. Also little or no difference (2 trials, 1,095 people, low certainty).
- Motion control and stability shoes. The review rated the evidence very low certainty, so it is uncertain whether either reduces injuries.
- Choosing by foot posture. Prescribing shoes by foot type probably makes little or no difference (3 trials, 7,203 people, moderate certainty). All three trials used military recruits, so they may not apply to recreational runners.
- What it can’t say. No trial compared running shoes with non-running shoes, so the review doesn’t tell you whether to wear running shoes at all.
What you can safely say. “A 2022 Cochrane review of 12 trials found little or no clear difference in injury rates between types of running shoe, though the certainty of the evidence was mostly low.” Don’t say shoes can’t affect injuries, because the review says the evidence is uncertain, not that the effect is zero.
My read. I’d choose shoes on fit and comfort and not pay extra for an injury-prevention promise the research doesn’t back. The bigger gap in these numbers is between novices and everyone else, which is about how you ramp up, not what you wear.
Sources: Videbaek et al., Sports Medicine, 2015 (tier A, DOI 10.1007/s40279-015-0333-8); Relph et al., Cochrane Database of Systematic Reviews, 2022 (tier A, DOI 10.1002/14651858.CD013368.pub2). Illustration arithmetic is mine (tier E).Do carbon plate running shoes really make you faster?
Short answer. In one lab study of 18 male high-caliber runners, a Nike racing-shoe prototype lowered the energy cost of running by about 4%. That is real evidence of an effect, but not a promise that the same shoe makes you 4% faster.
The study is Hoogkamer and colleagues, published in Sports Medicine in 2018. They compared a Nike prototype with the Nike Zoom Streak 6 and the adidas Adios BOOST 2 at 14, 16 and 18 km/h.
| Comparison (prototype against) | Average energy cost change | Range across individual runners |
|---|---|---|
| Nike Zoom Streak 6 | 4.16% lower | 1.59% to 6.26% lower |
| adidas Adios BOOST 2 | 4.01% lower | 1.97% to 6.08% lower |
- Small and specific. Eighteen men, all high-caliber runners, tested in a lab. It tells you little about recreational runners, women or longer wear.
- A prototype. The shoe tested was a Nike prototype, not a retail shoe off the shelf.
- Energy cost isn’t a race time. Lower energy cost at a given speed suggests you could go faster, but it is not a measured finishing time.
- Not every runner gained the same. The individual range was from roughly 1.6% to 6.3%.
- What I didn’t check. I didn’t review later studies of other carbon-plate shoes, or who funded this one.
- Rules. World Athletics limits sole thickness and the number of rigid plates in competition shoes. The limits date from 2020 and I haven’t read the 2026 rulebook, so I haven’t quoted numbers. Check the current rule if it matters for your race.
For most recreational runners I’d treat these shoes as an optional race-day purchase, not a training necessity. That’s my opinion, not a finding of the study.
Source: Hoogkamer W, Kipp S, Frank JH, Farina EM, Luo G, Kram R, Sports Medicine, 2018, DOI 10.1007/s40279-017-0811-2 (tier A).How long do running shoes last?
Short answer. Brooks says performance running shoes typically last 300 to 500 miles, or 4 to 6 months of regular use. That is manufacturer guidance, and I found no independent test behind it.
This is the figure most guides repeat, and the manufacturer’s own support page is where I could trace it. Brooks also says what you use the shoes for matters, because everyday walking or work puts steady pressure on the mesh and cushioning and breaks it down faster, and that rotating between pairs helps. Unworn shoes can deteriorate too, especially the adhesives, so cool, dry storage slows it.
- The two numbers agree. At 20 miles a week, 300 to 500 miles takes 15 to 25 weeks, about 3.5 to 6 months (my arithmetic), which fits Brooks’s 4 to 6 months.
- Signs to replace them. Brooks lists smooth, worn-down tread, a compressed midsole, tears or fraying in the upper, shoes that feel flat or unsupportive, and new pain or soreness without a change in routine.
- The gap. A manufacturer has a reason to say shoes wear out. I’d use the range as a prompt to inspect your shoes, not as a hard deadline.
Why do running statistics from different websites disagree?
Short answer. They count different things: different definitions of a runner, brands against the market, dollars against units, different years and currencies, and forecasts with no public method.
Almost every mismatch I hit came down to one of these eight.
| Reason | Example from my research | What to do |
|---|---|---|
| Who counts as a runner | 52.3 million road runners (OIA), against 250 million active Americans across 126 activities (SFIA) | Check the activity and the definition |
| Participants, finishers or registrations | 432,562 marathon participants (RunRepeat), against 12.2 million registrations across all race sizes (RunSignup) | Never add or compare them |
| Brand or market | On grew 30.0%, while the US running market grew 13% | Say which one you mean |
| Reported or constant currency | On grew 30.0% as reported and 35.6% in constant currency | Name the basis |
| Fiscal or calendar year | HOKA’s year ends in March; On and Brooks report calendar 2025 | Put the period in the sentence |
| Dollars or units | Running dollars and units both +13%, while all footwear dollars +1% and units down | Check both before saying people bought more |
| Forecasts with no method | Global running shoe market figures from $2.9 billion to about $53 billion on two roundup pages | Don’t quote one without its method |
| Different injury definitions | The 13 injury studies defined an injury in different ways, which is why their rates are not directly comparable | Use injury rates as a guide |
What you can safely say. “There is no official count of US runners or reliable running shoe market size. Published figures differ because they define runners and markets differently.” Then name the figure you’re quoting and its source.
Who measures what?
Running data comes from five kinds of source, and each answers a different question. Government statistics barely appear, which is part of why this page has so many industry numbers. Select a step to see what it covers and how I use it.
1Trade-group participation surveysOutdoor Industry Association and the Sports & Fitness Industry Association
Ask people which activities they did and how often. They give the only national runner counts, but the definition of a runner, the sample and the method are mostly behind membership or paid reports, and they are not official statistics.
2Race platforms and results databasesRunSignup, RunRepeat and Running USA
Count people who entered or finished races. They show real participation in organised events, but say nothing about people who run without racing, and participants, finishers and registrations are different counts.
3Retail trackingCircana
Tracks what US shoppers buy at retail. The public posts give percentage changes in dollars and units, so I can tell you direction and size of change, but not totals, prices or brand split.
4Company resultsOn Holding, Brooks, Deckers (HOKA) and ASICS
Report sales for the whole brand or group, in different currencies and fiscal years. Useful for growth, but never running only, and the publisher has a reason to present growth well.
5Peer-reviewed researchVidebaek et al., Relph et al. (Cochrane) and Hoogkamer et al.
Measure injuries and the effect of shoes directly. They are the strongest evidence on this page, but they cover specific groups and settings and say nothing about sales or national participation. The only official series I use is the BLS consumer price index for footwear.
How good is the evidence behind running shoe statistics?
Short answer. Mostly industry research. Of the 57 rows in this page’s dataset, 58% are industry research or company statements (tier C), 16% are peer-reviewed (tier A) and only 2% are official statistics (tier B).
| Evidence tier | Rows | Share |
|---|---|---|
| A Peer-reviewed research | 9 | 16% |
| B Official statistics | 1 | 2% |
| C Industry research and company statements | 33 | 58% |
| D Secondary reporting | 5 | 9% |
| E UrbanStyle calculations | 9 | 16% |
| Total | 57 | 100% |
- The peer-reviewed rows are the strongest, and they are about injuries and shoe performance, not sales or participation.
- Tier C is a mixed bag. Trade-group surveys, race platforms and company results are useful, but the publishers have an interest in a growing market and rarely show a full method.
- Counts are not quality scores. A tier A row is not automatically right for your question, and a tier C row is not automatically wrong. The tier tells you where to look first.
What I’m watching next
I don’t forecast. These are the releases that would change this page, and what I’ll do when they land.
- Circana’s full-year 2026 footwear report. It would give a full-year running figure to replace the first-half one. I expect it in early 2027, but I haven’t seen a date.
- Company results. New quarterly results from On, Deckers (for HOKA), ASICS and Brooks would update the brand explorer and chart.
- The next OIA Running Report and RunSignup RaceTrends. Each would give a second year of runner and race data. I’ll update the counts when they appear.
- Running-specific SFIA figures. If I can read them at the source, I’ll add them.
- A trustworthy average price or pairs per runner. I found neither, and I’d add them if an official or well-documented source appears.
- Corrections. If you know of an official source for the number of US runners or a documented running shoe market size, email me.
Every change goes in the freshness log.
Where other running shoe statistics articles go wrong
I read two of the pages that rank for running statistics before building this one. Some of what follows I saw there, and the rest are traps that are easy to fall into. This is not a complete audit of anyone’s work.
- Problem 1Global market forecasts that contradict each other on the same page, such as $2.9 billion and $10.1 billion for 2032, with no explanation.
- Problem 2Participation counts with no definition of a runner, and global and US figures mixed together.
- Problem 3Performance claims about shoes with no source attached.
- Problem 4Survey percentages with no sample size, date or question wording.
- Problem 5Brand revenue quoted without the period, currency or whether it is the whole company.
- Problem 6A lab result for elite runners presented as a promise for every runner.
- Problem 7No downloadable data, so nobody can check or reuse the numbers.
How can the evidence help you choose running shoes?
This is practical advice, separate from the research. It reflects what the studies above do and don’t show, plus my own opinions where I say so.
- Choose on fit and comfort first. The Cochrane review found no shoe type with a clear injury edge, so a shoe that fits you beats a shoe with a promise. Measure with my foot measuring guide and use the size conversion calculator if you’re ordering a different brand.
- Skip the foot-type shopping. Choosing shoes by foot posture probably makes little or no difference to injuries, though the trials were in military recruits.
- Write the date on the shoe and track miles. Brooks says 300 to 500 miles is typical, and I’d inspect the tread and midsole at the low end of that range.
- Ramp up slowly if you’re new. Novices had about 2.3 times the injury rate of recreational runners. That’s my reading of the arithmetic, not a finding about training plans.
- Treat carbon plates as a race-day choice. The 4% result is from 18 elite-level men in a lab. Decide whether the cost makes sense for how you race.
- Know the return policy. Fit problems are common, and return windows differ by brand. See my shoe return statistics before you order online.
- Stay on budget. Prices rose 3.6% in the year to August 2026 for all footwear, so a plan that worked last year may buy slightly less. See my best running shoes under $100 and the Prime Day shoe deals page.
Sources and evidence tiers
Evidence hierarchy
- APeer-reviewed research. Original data or systematic reviews in journals: the injury meta-analysis, the Cochrane review and the carbon-plate energy study.
- BOfficial statistics. Only the BLS consumer price index for footwear appears on this page.
- CIndustry research, surveys and company statements. OIA, SFIA, RunRepeat, RunSignup, Running USA, Circana, and the company results from On and Brooks. Useful, but the publisher may have a commercial interest.
- DSecondary reporting. Trade press reports of HOKA and ASICS results that I could not check against the company release, and the market-size forecasts on roundup pages.
- EEstimates and calculations. My own arithmetic and comparisons, with the method stated.
Primary versus secondary data
Primary source: the organisation that collected or published the data. Secondary source: an article summarising someone else’s data. Where I could only read a secondary source, the table says so.
Source table
| Source | Year | Sample | Geography | Finding used | Tier | Series ID | Primary source |
|---|---|---|---|---|---|---|---|
| Videbaek S, Bueno AM, Nielsen RO, Rasmussen S, "Incidence of Running-Related Injuries Per 1000 h of running in Different Types of Runners: A Systematic Review and Meta-Analysis", Sports Medicine, 2015 | 2015 | Systematic review and meta-analysis of 13 studies (8 prospective cohort studies, 5 randomised controlled trials) | Mixed | Pooled injury incidence of 17.8 per 1,000 hours for novice runners and 7.7 for recreational runners | A | DOI 10.1007/s40279-015-0333-8 | Videbaek et al. (Springer) |
| Relph N et al., "Running shoes for preventing lower limb running injuries in adults", Cochrane Database of Systematic Reviews, 2022 | 2022 | Cochrane systematic review of 12 trials with 11,240 participants | Mixed | Little or no clear difference in injury rates between types of running shoe; certainty low to very low for shoe-type comparisons and moderate for choosing shoes by foot posture | A | DOI 10.1002/14651858.CD013368.pub2 | Cochrane review (PubMed) |
| Hoogkamer W, Kipp S, Frank JH, Farina EM, Luo G, Kram R, "A Comparison of the Energetic Cost of Running in Marathon Racing Shoes", Sports Medicine, 2018 (online 2017) | 2018 | Laboratory study of 18 male high-caliber runners | Laboratory | A Nike prototype lowered the energy cost of running by 4.16% against the Nike Zoom Streak 6 and 4.01% against the adidas Adios BOOST 2, averaged over three speeds | A | DOI 10.1007/s40279-017-0811-2 | Hoogkamer et al. (PMC) |
| US Bureau of Labor Statistics, CPI for All Urban Consumers: Footwear, read through FRED | 2026 | Price index (1982-84=100), not seasonally adjusted, monthly | United States | Footwear index of 151.979 in August 2026 against 146.675 in August 2025 | B | FRED series CUUR0000SEAE (updated Sept 11, 2026) | FRED series page |
| Circana (Beth Goldstein), "Performance shoe sales pick up the pace amid selective U.S. consumer spending in the footwear market" (August 17, 2026) | 2026 | Circana Retail Tracking Service, US footwear sales, first half of 2026 against first half of 2025 | United States | Running shoe dollar and unit sales both up 13%; performance footwear dollars up 6%; total footwear dollars up 1% with units down | C | n/a | Circana post |
| Outdoor Industry Association, "2026 Running Report" (2025 participation; public summary "Running Is Growing. But It's Becoming a Casual Habit, Not a Core Pursuit") | 2025 | Participation survey; sample and method are in the members-only report and were not on the public page | United States | 52.3 million US road runners in 2025; 17.2 million trail runners; core runners are those with 50 or more outings a year | C | n/a | OIA running report summary |
| RunRepeat with World Athletics, "The State of US Marathons 2025" (August 28, 2025) | 2025 | 10,482,628 race results from 6,352 US marathon events, 1984 to 2025; elite runners, walks, charity runs and obstacle races excluded | United States | 432,562 marathon participants in 2024, 12.8% below the 2014 peak of 496,178; 41% female | C | n/a | RunRepeat report |
| RunSignup, annual RaceTrends report (published February 3, 2026), read through Running USA | 2025 | More than 97,000 race events and 12.2 million registrations on RunSignup | United States | Per-race participation grew an average of 5% from 2024 to 2025, after 8% in 2024 and 11% in 2023 | C | n/a | Running USA summary |
| Running USA, "2025's Top Races: Tracking Growth" industry insights report (press release, January 20, 2026), read through Endurance Sportswire | 2025 | Finisher data from the nation's top races; the release gives no figures | United States | Participation among the top races rose in 2025, with growth across the 5K, 10K, half marathon and marathon | C | n/a | Release (Endurance Sportswire) |
| Sports & Fitness Industry Association (SFIA), 2026 Topline Participation Report on 2025 data (press release) | 2025 | Survey of Americans aged 6 and over covering 126 activities; running figures are in paid reports and were not read | United States | About 250 million Americans took part in at least one activity in 2025; 158.8 million were core participants; 32% met the federal 150-minute guideline | C | n/a | SFIA release |
| On Holding AG, "On Announces Fourth Quarter and Full Year Results, and the Filing of its Annual Report on Form 20-F for 2025" (March 3, 2026) | 2025 | Company results, Swiss francs | Global | Net sales of CHF 3,014.0 million, up 30.0% reported and 35.6% in constant currency; shoes CHF 2,804.4 million; 2026 outlook of at least 23% constant-currency growth | C | n/a | On press release |
| Brooks Running, "Brooks Running Delivers Record Breaking Global Growth in 2025" (press release, February 5, 2026) | 2025 | Company statement; no dollar revenue given | Global | Revenue up 16%; North America up 13%, Europe, Middle East and Africa up 22%, Asia Pacific and Latin America up 66% | C | n/a | Brooks release |
| Brooks Running support page, "When is it time to replace my shoes?" | 2026 | Manufacturer guidance, no test data shown | Global | Performance running shoes typically last 300 to 500 miles, or 4 to 6 months of regular use | C | n/a | Brooks support page |
| World Footwear, "Strong full-year 2026 for Deckers" (May 25, 2026), reporting Deckers Brands results for the year to March 31, 2026 | 2026 | Trade press report of company results; the Deckers release itself could not be opened | Global | HOKA net sales of about $2.59 billion, up 15.9%; Deckers total $5.47 billion, up 9.8%; HOKA expected to grow by a low double-digit percentage in fiscal 2027 | D | n/a | World Footwear report |
| World Footwear, "ASICS reports strong full-year 2025 results" (February 20, 2026) | 2025 | Trade press report of company results; the ASICS filing was not read | Global | Net sales of 810.9 billion yen, up 19.5%; 2026 target of 950 billion yen, up 17.2% | D | n/a | World Footwear report |
| Two running statistics roundup pages that quote market research (read October 19, 2026; not named here) | 2026 | Market-research forecasts repeated without methods | Global | Global running shoe market figures of $2.9 billion and $10.1 billion for 2032 on one page, and $23.5 billion for 2026 and about $53 billion for 2024 on another | D | n/a | Why the numbers disagree |
| UrbanStyle Footwear, "US Footwear Market Statistics" (updated October 8, 2026) | 2026 | Research page with sourced dataset | United States | Context for footwear prices, spending and the Circana first-half 2026 figures; calculations are tier E | E | n/a | US Footwear Market Statistics |
| UrbanStyle Footwear calculations on this page | 2026 | Arithmetic on figures from the sources above; method stated | United States | Differences, shares and implied changes on this page | E | n/a | Methodology |
Methodology and limitations
How I built this page. I looked for official statistics first, then research and company releases, then trade reports, and only then articles. For each figure I recorded the source, date, sample and what kind of evidence it is, and I opened the original wherever it was open to me. I read the Circana, OIA, RunRepeat, RunSignup, SFIA, On Holding, Brooks and the three research papers’ pages on October 19, 2026, and the BLS series through FRED. Where I calculated something, such as a difference, a share or an illustration, it’s labelled E and the method is in the dataset.
What I left out. I left out foot-strike percentages because I could not verify them at the source, running participation counts from paid SFIA reports, global runner and Parkrun figures that I only saw second-hand, brand market shares, any average price or pairs-per-runner claim, and market-size forecasts from paid research.
Limitations you should know about
- OIA’s method isn’t public. The public page doesn’t show the sample, the definition of a runner or the survey method, and “core runner” counts rest on its 50-outings rule.
- Circana gives changes, not totals. I have no dollar size, no average price and no brand split, and the average-price inference rests on rounded percentages.
- Two brand figures are second-hand. HOKA and ASICS come from trade press reports of company results, and I could not open the releases themselves.
- Brand figures aren’t running only. They cover whole brands or groups, with different years and currencies.
- The injury review has limits. Injury definitions varied between studies and it pools no overall rate across runner types.
- The Cochrane review has gaps. Certainty is mostly low or very low, and the foot-posture trials used military recruits.
- The carbon-plate study is small. It tested 18 men with a prototype, and I haven’t reviewed later work.
- Shoe life is manufacturer guidance. I found no independent test.
- World Athletics rules. I haven’t read the 2026 rulebook, so I haven’t quoted any limits.
- The page is US-focused. The injury and shoe research is international and mixes regions.
Data freshness
| Date | Change |
|---|---|
| October 19, 2026 | First publication. Data read from Circana, the Outdoor Industry Association, RunRepeat, RunSignup, SFIA, On Holding, Brooks, trade reports on Deckers and ASICS, BLS and three peer-reviewed papers. Downloadable dataset, four charts and calculations with stated methods. |
| When a newer Circana, OIA or company release appears | Planned update of the matching figures. |
| January 2027 | Next scheduled full review. |
Last full source review: October 19, 2026. Next scheduled review: January 2027.
Corrections. If you spot an error or have better data, email info@urbanstylefootwear.com with the subject “Data correction”. I’ll check it and note any change in the table above. How I test and review products is explained in our methodology.
For journalists and researchers
You can use the statistics and charts on this page with credit to UrbanStyle Footwear. Wherever you can, please cite the original source printed with each statistic. My own calculations are marked tier E and can be cited to me.
A sentence you can use. “The Outdoor Industry Association counted 52.3 million US road runners in 2025, and Circana says US running shoe sales rose 13% in both dollars and units in the first half of 2026, against 1% for all footwear. A 2022 Cochrane review of 12 trials found little or no clear difference in injury rates between types of running shoe.” (Sources: OIA; Circana; Relph et al., Cochrane Database of Systematic Reviews)
Media kit
All figures with value, unit, geography, segment, basis, period, source and evidence tier.
Four charts with source, scope and data type printed on each image. SVG versions are under each chart above.
The 15 citable statistics on one printable PDF.
Every source with year, sample, geography, tier, series ID and link.
Ready-made citations below. Media and research enquiries go to info@urbanstylefootwear.com.
Cite this page
Suggested citation
UrbanStyle Footwear. “Running Shoe Statistics 2026: US Runners, Sales, Brands and Injury Evidence.” Updated October 19, 2026. https://urbanstylefootwear.com/running-shoe-statistics/
APA style
Vahith, A. (2026, October 19). Running shoe statistics 2026: US runners, sales, brands and injury evidence. UrbanStyle Footwear. https://urbanstylefootwear.com/running-shoe-statistics/
Link (HTML)
<a href="https://urbanstylefootwear.com/running-shoe-statistics/">Running Shoe Statistics 2026 by UrbanStyle Footwear</a>Click any citation, then press Ctrl+C (Cmd+C on Mac) to copy it.
For individual statistics, UrbanStyle recommends citing the original source listed in the source table whenever possible.
Data requests. Data correction or dataset request: info@urbanstylefootwear.com
Frequently asked questions
How many people run in the US?
The Outdoor Industry Association counted 52.3 million US road runners in 2025, and about 29 million of them did not run often enough to count as core (50 or more outings a year). That is a trade-group survey, not an official count, so other sources give different numbers depending on how they define a runner. See how many people run in the US.
Are running shoe sales growing in 2026?
Yes. Circana says US running shoe dollar and unit sales both rose 13% in the first half of 2026 against the same months of 2025. All US footwear dollar sales rose only 1%, with units down. See running shoe sales.
How much does the average running shoe cost?
I could not find a verified US average. Circana does not publish one, but because running dollars and units both rose 13% in the first half of 2026, the average price looks roughly flat (my inference). All footwear prices were up 3.6% in August 2026 (BLS). For options at a set budget, see my best running shoes under $100.
Which running shoe brand is growing fastest?
On reported the fastest growth among the four I checked: 30.0% in 2025 as reported, against ASICS at 19.5%, Brooks at 16% and HOKA at 15.9% in its year to March 2026. That is not a ranking, because the periods, currencies and scope differ and none of them is running only. See running brand growth.
How long do running shoes last?
Brooks says performance running shoes typically last 300 to 500 miles, or 4 to 6 months of regular use. That is manufacturer guidance and I found no independent test data, so treat it as a guide and watch for worn tread, a flat midsole or new aches. See how long running shoes last.
How often do runners get injured?
A meta-analysis of 13 studies found 7.7 injuries per 1,000 hours of running for recreational runners and 17.8 for novices (Videbaek et al., 2015). The studies defined injury differently, so use the numbers as a rough guide. See running injuries and shoes.
Do the right running shoes prevent injuries?
The best evidence I found says there is no clear proof. A Cochrane review of 12 trials with 11,240 people found little or no clear difference in injuries between types of running shoe, with low or very low certainty for most comparisons (Relph et al., 2022). Comfort and fit still matter, they are just not shown to cut injuries.
Do carbon plate running shoes make you faster?
In one lab study of 18 male high-caliber runners, a Nike prototype lowered the energy cost of running by about 4% against two other marathon racing shoes, with individual gains from about 1.6% to 6.3% (Hoogkamer et al., 2018). It shows an effect for those runners in that setting, not a guaranteed time saving for you. See carbon plate shoes.
Should I choose running shoes by foot type or pronation?
The Cochrane review found that choosing shoes based on foot posture probably makes little or no difference to injuries (moderate certainty), though all three trials used military recruits and may not apply to recreational runners. Fit and comfort are the safer guide. My foot measuring guide helps with fit.
How many people run marathons in the US?
RunRepeat counted 432,562 US marathon participants in 2024, which is 12.8% below the 2014 peak of 496,178. Women were 41% of participants. See how many people run.
Is running getting more popular?
It depends on the measure. OIA says running is growing but becoming a casual habit, with casual road running up about 7% a year over three years and core running down. RunSignup says per-race participation grew 5% in 2025, and Running USA says the top races grew. US marathon participation is still below its 2014 peak.
Why do running shoe market size figures disagree?
They come from market-research forecasts with different years, regions and definitions, and the public pages rarely show the method. Two roundups I read quoted figures from $2.9 billion to about $53 billion. I use growth rates from Circana and company results and no single market size. See why the numbers disagree.
Which of these running statistics are official?
Very few. The only official statistics here are the BLS consumer price indexes. The rest come from trade groups, race platforms, companies and academic research, and I label each one by tier. See the evidence tiers.
Where can I download the data?
Use the download bar near the top or the media kit, which has a CSV and an XLSX of every figure on this page, with source and evidence tier. For wider US footwear data, see the footwear statistics hub. I last checked every figure against its source on October 19, 2026, and I plan to review the page again in January 2027.
Can I use these statistics in my article?
Yes, with credit to UrbanStyle Footwear, and cite the original source for any single statistic where you can. The datasets, charts and a printable list of key statistics are in the media kit, with citation formats.