
Shoe Ownership Statistics 2026: How Many Shoes People Buy and Own Around the World
How many pairs of shoes does the average person own? I went looking for the official number and found that nobody measures it. What is measured is how many pairs each country buys, imports and spends money on. This page puts those numbers together for 62 countries, explains what the popular ownership figures are really based on, and gives you the data to check every figure yourself.
Six headline numbers on shoes bought and owned. Select one to see what it counts and where it comes from.
Select a topic above, for example “United States”, to see what the number counts.
3.0 pairsThe world made 24.6 billion pairs of shoes in 2025 for 8.2 billion people, about 3.0 pairs each (my calculation from the World Footwear Yearbook and World Bank, tier E).
5.7 pairsAmericans bought about 5.7 pairs per person in 2025, level with Ghana at the top among countries of 20 million people or more (my calculation from the Yearbook's 1,950 million pairs and the World Bank, tier E).
4,817MChina consumes the most shoes: 4,817 million pairs in 2025, about 3.4 per person (Yearbook, tier C; per person my calculation).
1.9 pairsIndia is the second-largest market at 2,772 million pairs, but that is about 1.9 pairs per person (Yearbook and World Bank, tier E).
1.6 pairsAfricans bought about 1.6 pairs per person in 2025, against 4.6 in North America and 4.1 in Europe (World Footwear Yearbook 2026, tier C).
Not measuredNo statistics office counts how many shoes people own. Published ownership figures come from polls that rarely show their method, so I measure pairs bought instead.
Each number names its source and evidence tier. All fifteen of my citable statistics are further down this page.
Shoe ownership and consumption statistics at a glance
Quick answer. No official statistic counts how many shoes people own. What is measured is how many they buy. The world made 24.6 billion pairs in 2025, about 3 pairs per person. People in the US bought about 5.7 pairs each, in the five largest Western European countries about 4.7 to 5.3, in China 3.4, in India 1.9 and in Africa 1.6 on average. Polls about ownership exist, but the ones I found don’t publish their method, so treat any “average person owns X pairs” figure with care.
Key findings
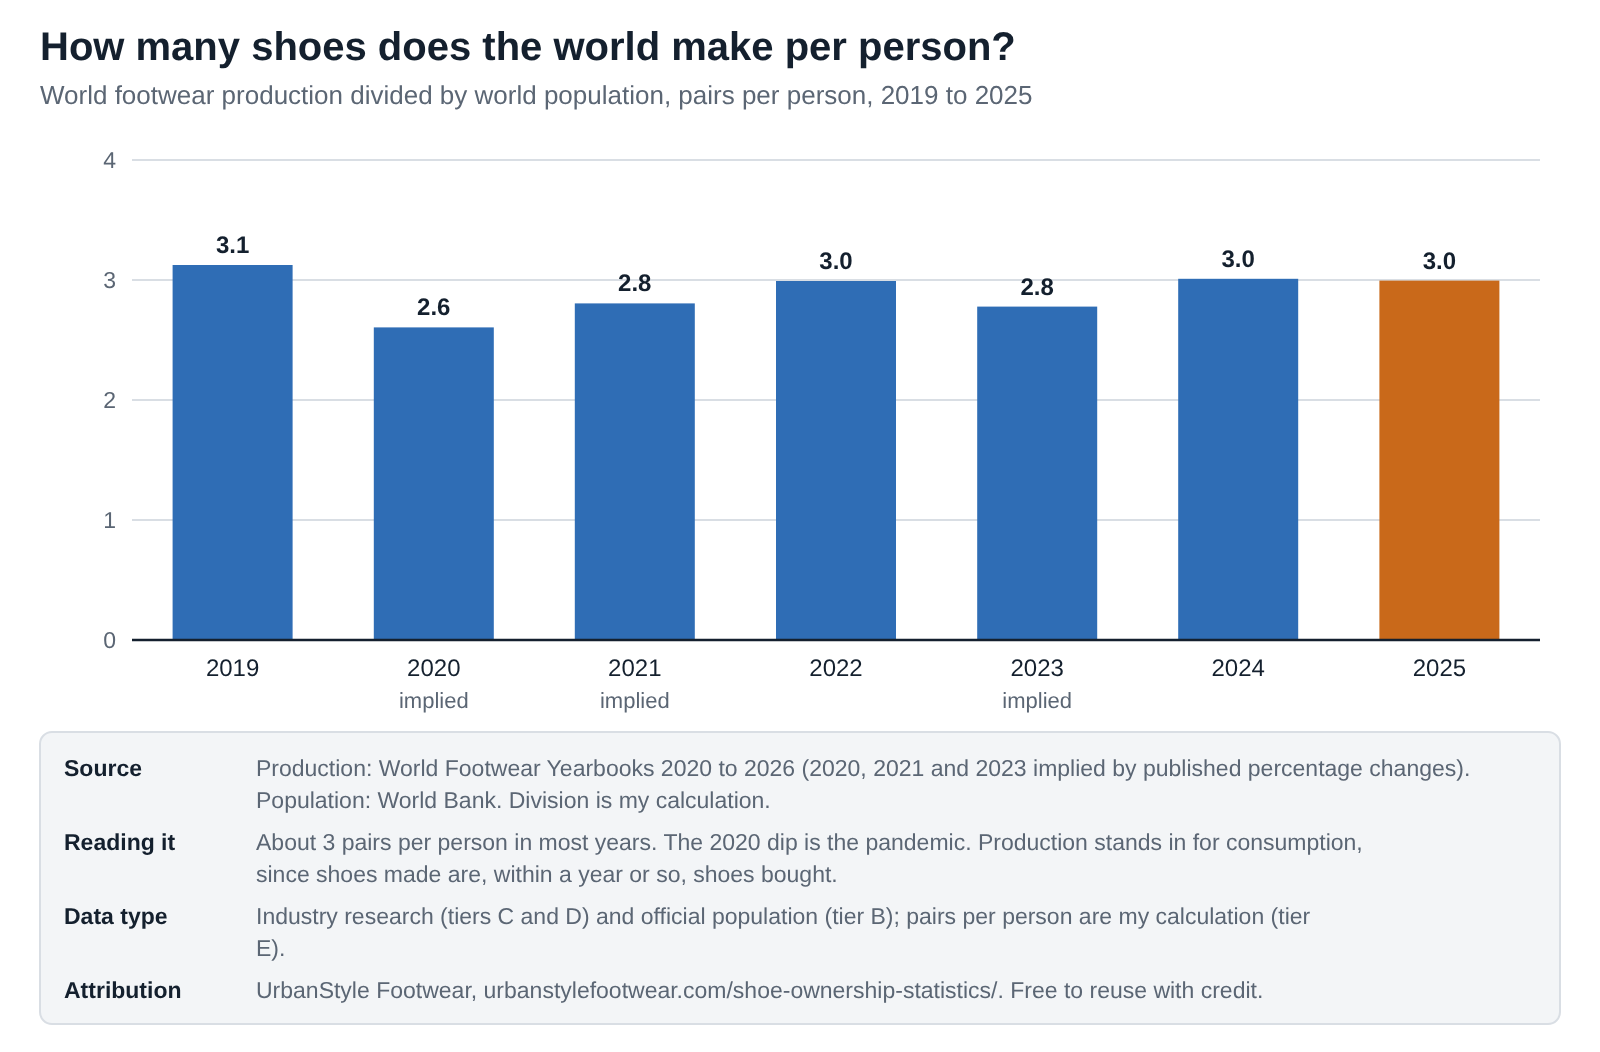
- About 3 pairs per person worldwide. 24.6 billion pairs were made in 2025 for 8.2 billion people. The figure was 3.1 in 2019 and 2.6 in the pandemic year of 2020.
- Three countries buy almost 4 in 10 pairs. China (4,817 million), India (2,772 million) and the US (1,950 million) consumed about 39% of world output in 2025.
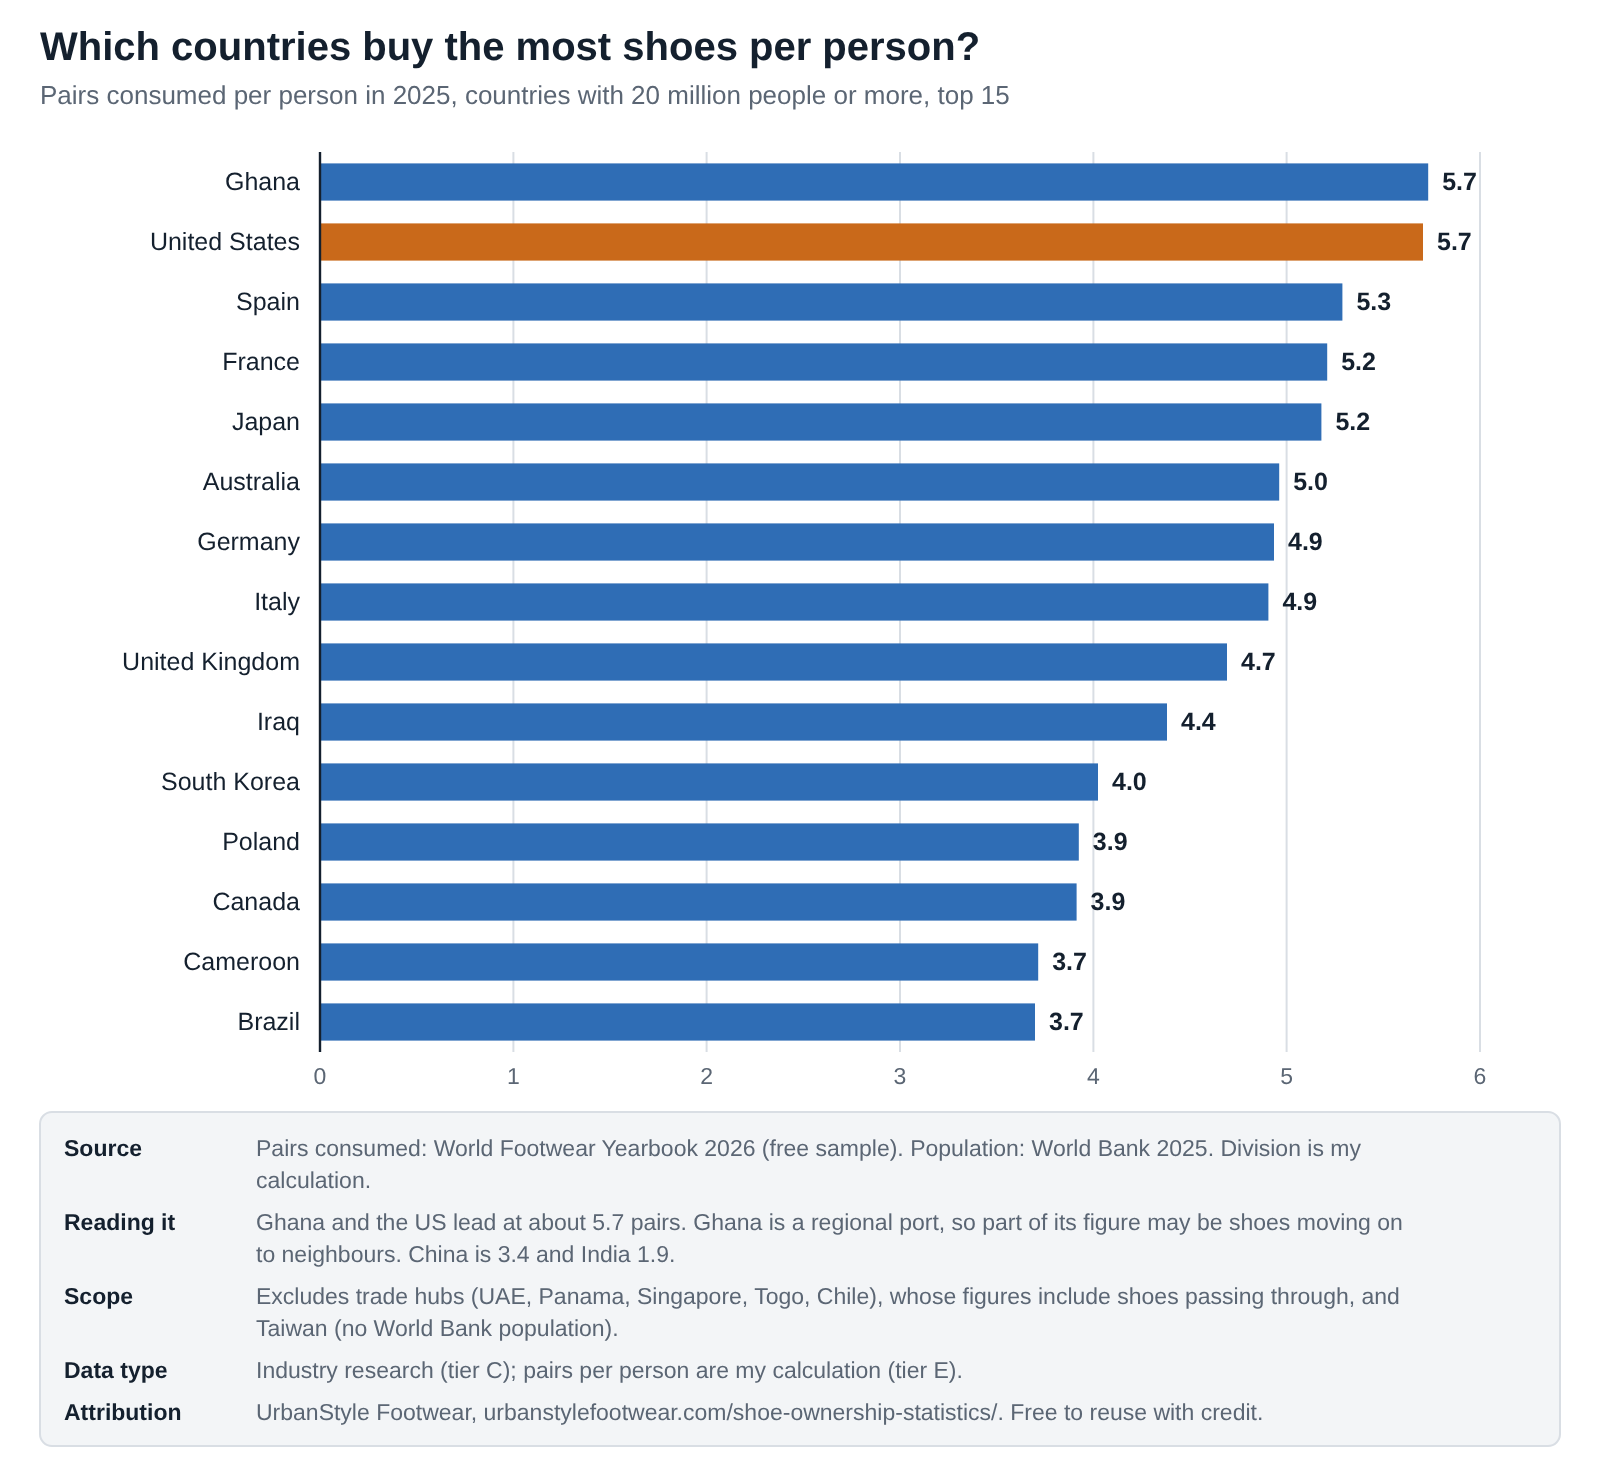
- The US and Ghana top the per-person list among countries of 20 million people or more, at about 5.7 pairs each, ahead of Spain, France and Japan at about 5.2.
- India is a giant market of light buyers: second in total pairs but about 1.9 pairs per person, against 3.4 in China.
- Africa buys the fewest shoes per person: 1.6 pairs on average, and under 1 pair in Ethiopia and the DR Congo by my calculation.
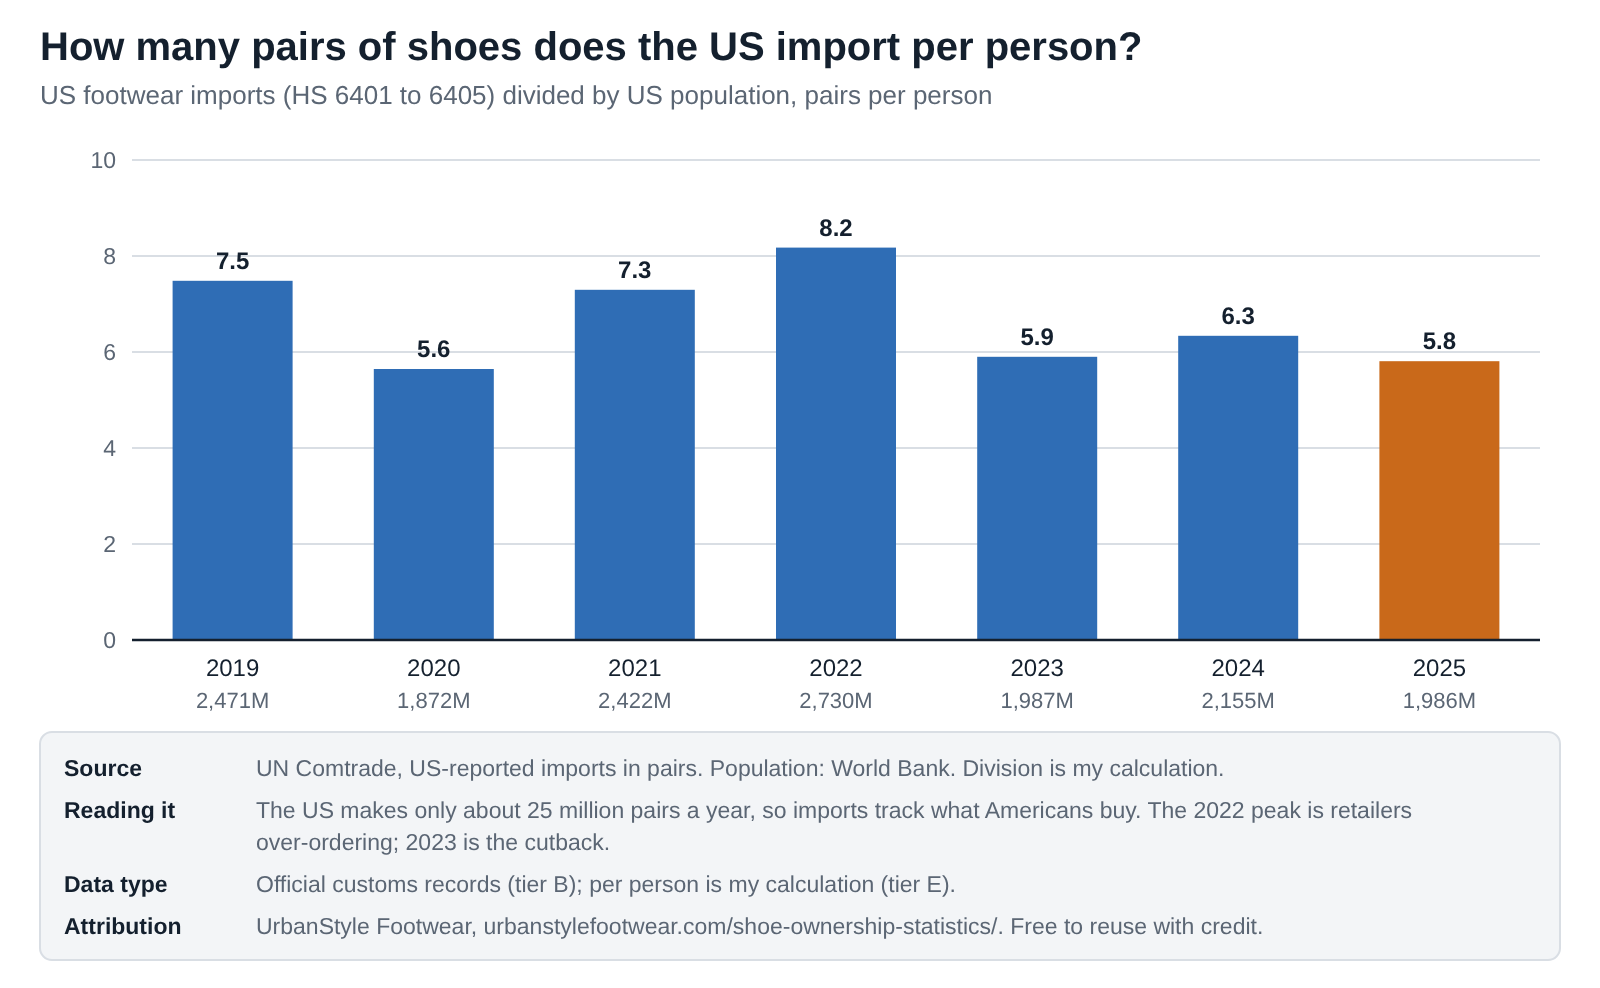
- US imports swing far more than real buying. Imports per person went from 5.6 pairs in 2020 to 8.2 in 2022 and back to 5.8 in 2025, as retailers over-ordered and then cut back.
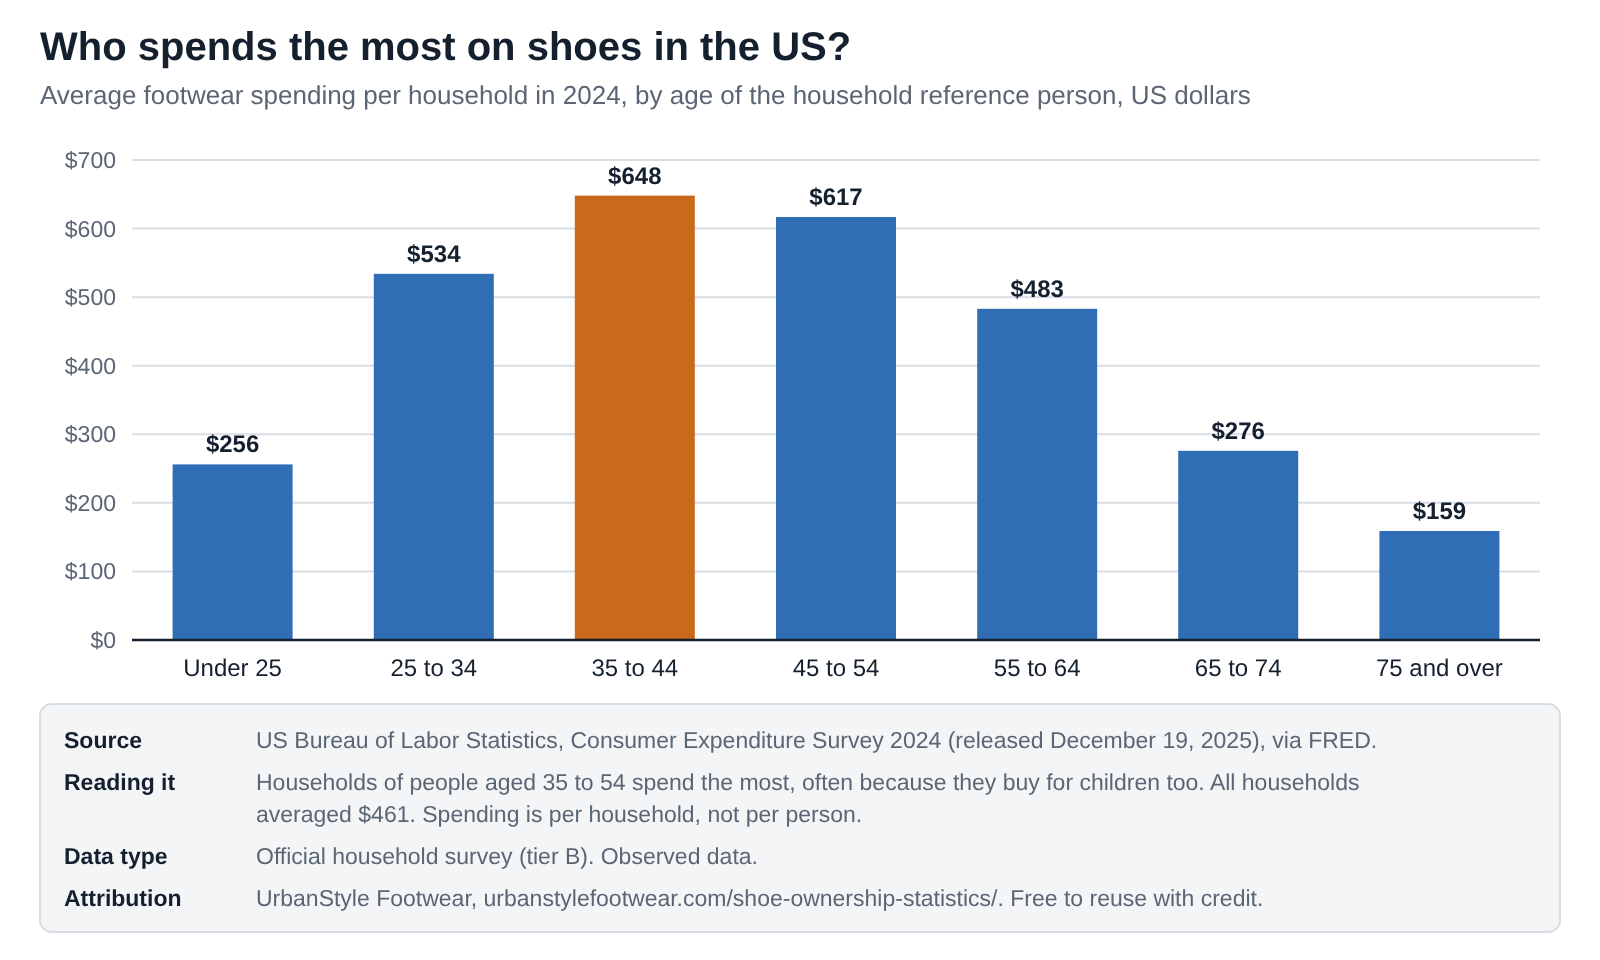
- Middle-aged and richer households spend the most. US households aged 35 to 44 spent $648 on shoes in 2024; the richest fifth spent $840, almost three times the poorest fifth.
- Ownership is not measured. Popular figures such as “the average woman owns 27 pairs” trace back to polls without a published sample or method.
What I noticed while putting this together
I started where most people start: the question “how many shoes does the average person own?” Every article I read had an answer, and they didn’t agree. When I followed the links, the numbers led to brand surveys, old news stories and other blogs. None of them pointed to a statistics office, because no statistics office measures it.
So I switched to what is measured. The World Footwear Yearbook estimates how many pairs each country uses, and its free sample lists 62 countries. Dividing by population gave me pairs per person, and that is where the surprises came from. Panama came out at almost 26 pairs per person and the UAE at almost 24. Those aren’t shoe lovers; they’re trade hubs, where shoes land and then move on.
The US numbers needed a cross-check too, because the US makes only about 1% of its own shoes. Customs records gave me imports for every year since 2019, and they line up well with the Yearbook’s figure for 2025. They also show how much imports swing when retailers over-order, which is worth knowing before you quote any one year.
What shoe ownership data can and can’t tell you
Here is where the evidence stands as of October 2026.
| Question | Evidence status | Why |
|---|---|---|
| Pairs bought per country | Industry estimate | World Footwear Yearbook, 62 countries, same method |
| Pairs bought per person | Calculation on an estimate | Yearbook pairs divided by World Bank population |
| US pairs imported | Official data | Customs records, counted in pairs |
| US spending on shoes | Official data | BEA national accounts and BLS household survey |
| Pairs owned per person | No official figure | Only polls, which rarely publish their method |
| Pairs owned by men vs women | No official figure | Not split by sex in any official source I found |
| People with no shoes | Not measured | WHO measures diseases linked to going barefoot, not shoelessness |
Four kinds of source exist. Pick one to see what it measures and where it falls short.
See what each type of source counts and where it falls short
Choose a source to see what it records and how I would read it.
Select a source above.
Pairs consumed. 2025. The World Footwear Yearbook estimates how many pairs each country uses: production plus imports minus exports. It is the only source that covers more than 60 countries the same way. How to read it: Industry research (tier C). In trade hubs such as the UAE or Panama, some shoes counted as consumed are really passing through.
Pairs imported. 2019 to 2025. Customs records count every pair that crosses the border. For the US, which makes about 1% of its shoes, imports are close to what people buy. How to read it: Official (tier B) and yearly, but imports also swing with retailer stock: imports jumped in 2022 as retailers stocked up, then fell in 2023.
Money spent. 2010 to 2025. National accounts (BEA) and the BLS household survey measure what people spend on shoes. How to read it: Official (tier B), but money is not pairs. The household survey also captures only about half of the national accounts total.
Ownership polls. 2021. Brands and pollsters ask people how many pairs they own. How to read it: The only direct measure of ownership, but the polls I found don't publish their sample or method, and people guess. Treat them as rough (tier D).
15 shoe ownership and consumption statistics you can cite
Each card has one number, one sentence of context and its source. “Copy text” opens a box with the sentence, the source and a link back here. Please cite the original source for any single statistic. Cards marked E are my calculations.
The world made 24.6 billion pairs of shoes in 2025 for 8.2 billion people, about 3.0 pairs per person (my calculation from the World Footwear Yearbook 2026 and World Bank).
Copy text
3.0 pairs made per person worldwide, 2025: The world made 24.6 billion pairs of shoes in 2025 for 8.2 billion people, about 3.0 pairs per person (my calculation from the World Footwear Yearbook 2026 and World Bank). Source: UrbanStyle calculation. Via UrbanStyle Footwear: https://urbanstylefootwear.com/shoe-ownership-statistics/
The US consumed 1,950 million pairs of shoes in 2025, about 5.7 pairs per person, joint highest with Ghana among countries of 20 million people or more (my calculation from the Yearbook and World Bank).
Copy text
5.7 pairs per American, 2025: The US consumed 1,950 million pairs of shoes in 2025, about 5.7 pairs per person, joint highest with Ghana among countries of 20 million people or more (my calculation from the Yearbook and World Bank). Source: UrbanStyle calculation. Via UrbanStyle Footwear: https://urbanstylefootwear.com/shoe-ownership-statistics/
China consumed 4,817 million pairs of shoes in 2025, India 2,772 million and the US 1,950 million; together that is about 39% of world production (World Footwear Yearbook 2026; share my calculation).
Copy text
4,817M pairs consumed in China, 2025: China consumed 4,817 million pairs of shoes in 2025, India 2,772 million and the US 1,950 million; together that is about 39% of world production (World Footwear Yearbook 2026; share my calculation). Source: World Footwear Yearbook 2026 (Consumption table; Map 2). Via UrbanStyle Footwear: https://urbanstylefootwear.com/shoe-ownership-statistics/
Asia accounted for 56% of world footwear consumption in 2025 and Africa 10.7% (World Footwear Yearbook 2026).
Copy text
56% of shoes are bought in Asia: Asia accounted for 56% of world footwear consumption in 2025 and Africa 10.7% (World Footwear Yearbook 2026). Source: World Footwear Yearbook 2026 (Consumption table; Map 2). Via UrbanStyle Footwear: https://urbanstylefootwear.com/shoe-ownership-statistics/
North Americans bought about 4.6 pairs of shoes per person in 2025, Europeans 4.1, Asians 2.6 and Africans 1.6 (World Footwear Yearbook 2026).
Copy text
4.6 vs 1.6 pairs per person, North America vs Africa: North Americans bought about 4.6 pairs of shoes per person in 2025, Europeans 4.1, Asians 2.6 and Africans 1.6 (World Footwear Yearbook 2026). Source: World Footwear Yearbook 2026 (Consumption table; Map 2). Via UrbanStyle Footwear: https://urbanstylefootwear.com/shoe-ownership-statistics/
India is the world's second-largest shoe market at 2,772 million pairs, but that is about 1.9 pairs per person in 2025, against 3.4 in China (my calculation from the Yearbook and World Bank).
Copy text
1.9 pairs per person in India: India is the world's second-largest shoe market at 2,772 million pairs, but that is about 1.9 pairs per person in 2025, against 3.4 in China (my calculation from the Yearbook and World Bank). Source: UrbanStyle calculation. Via UrbanStyle Footwear: https://urbanstylefootwear.com/shoe-ownership-statistics/
Germans bought about 4.9 pairs per person in 2025, the French 5.2, the British 4.7 and Spaniards 5.3 (my calculation from the Yearbook and World Bank).
Copy text
4.9 pairs per person in Germany: Germans bought about 4.9 pairs per person in 2025, the French 5.2, the British 4.7 and Spaniards 5.3 (my calculation from the Yearbook and World Bank). Source: UrbanStyle calculation. Via UrbanStyle Footwear: https://urbanstylefootwear.com/shoe-ownership-statistics/
The US imported 1,986 million pairs of shoes in 2025, about 5.8 per person, down from 2,730 million in 2022 (UN Comtrade; per person my calculation).
Copy text
1.99B pairs imported by the US, 2025: The US imported 1,986 million pairs of shoes in 2025, about 5.8 per person, down from 2,730 million in 2022 (UN Comtrade; per person my calculation). Source: UN Comtrade (HS 6401 to 6405, quantity unit: pairs). Via UrbanStyle Footwear: https://urbanstylefootwear.com/shoe-ownership-statistics/
US shoe imports peaked at about 8.2 pairs per person in 2022, when retailers over-ordered, then fell to 5.9 in 2023 (my calculation from UN Comtrade and World Bank).
Copy text
8.2 pairs imported per American in 2022: US shoe imports peaked at about 8.2 pairs per person in 2022, when retailers over-ordered, then fell to 5.9 in 2023 (my calculation from UN Comtrade and World Bank). Source: UrbanStyle calculation. Via UrbanStyle Footwear: https://urbanstylefootwear.com/shoe-ownership-statistics/
The average US household spent $461 on footwear in 2024, up from $419 in 2019 and $314 in 2020 (BLS Consumer Expenditure Survey).
Copy text
$461 US footwear spending per household, 2024: The average US household spent $461 on footwear in 2024, up from $419 in 2019 and $314 in 2020 (BLS Consumer Expenditure Survey). Source: BLS Consumer Expenditure Survey (CXUFOOTWEARLB0101M, LB0102M to LB0106M, LB0402M to LB0409M). Via UrbanStyle Footwear: https://urbanstylefootwear.com/shoe-ownership-statistics/
US households headed by someone aged 35 to 44 spent $648 on footwear in 2024, the most of any age group; those aged 75 and over spent $159 (BLS Consumer Expenditure Survey).
Copy text
$648 households aged 35 to 44: US households headed by someone aged 35 to 44 spent $648 on footwear in 2024, the most of any age group; those aged 75 and over spent $159 (BLS Consumer Expenditure Survey). Source: BLS Consumer Expenditure Survey (CXUFOOTWEARLB0101M, LB0102M to LB0106M, LB0402M to LB0409M). Via UrbanStyle Footwear: https://urbanstylefootwear.com/shoe-ownership-statistics/
The richest fifth of US households spent $840 on footwear in 2024, about 2.8 times the $302 spent by the poorest fifth (BLS Consumer Expenditure Survey; ratio my calculation).
Copy text
2.8x richest vs poorest households: The richest fifth of US households spent $840 on footwear in 2024, about 2.8 times the $302 spent by the poorest fifth (BLS Consumer Expenditure Survey; ratio my calculation). Source: BLS Consumer Expenditure Survey (CXUFOOTWEARLB0101M, LB0102M to LB0106M, LB0402M to LB0409M). Via UrbanStyle Footwear: https://urbanstylefootwear.com/shoe-ownership-statistics/
Dividing US footwear spending in 2025 ($121.15 billion, BEA) by pairs consumed (1,950 million, Yearbook) gives about $62 a pair (my calculation).
Copy text
about $62 US spending per pair: Dividing US footwear spending in 2025 ($121.15 billion, BEA) by pairs consumed (1,950 million, Yearbook) gives about $62 a pair (my calculation). Source: UrbanStyle calculation. Via UrbanStyle Footwear: https://urbanstylefootwear.com/shoe-ownership-statistics/
About 4 million people in 17 countries have podoconiosis, a disabling leg swelling caused by walking barefoot on irritant soil that footwear prevents (WHO).
Copy text
4 million people with podoconiosis: About 4 million people in 17 countries have podoconiosis, a disabling leg swelling caused by walking barefoot on irritant soil that footwear prevents (WHO). Source: WHO podoconiosis fact sheet. Via UrbanStyle Footwear: https://urbanstylefootwear.com/shoe-ownership-statistics/
No national statistics office publishes how many pairs of shoes people own. Polls that ask rarely publish their method, so pairs bought per year is the measurable figure (my review of sources).
Copy text
Not counted shoes owned: No national statistics office publishes how many pairs of shoes people own. Polls that ask rarely publish their method, so pairs bought per year is the measurable figure (my review of sources). Source: UrbanStyle calculation. Via UrbanStyle Footwear: https://urbanstylefootwear.com/shoe-ownership-statistics/
How many pairs of shoes does the world buy each year?
Short answer. About 24.6 billion pairs were made in 2025, roughly 3.0 pairs for every person on earth. The figure has hovered around 3 since 2019, apart from the 2020 dip to 2.6. (World Footwear Yearbook; World Bank; my calculation)
Embed this chart
<figure style="margin:0"><a href="https://urbanstylefootwear.com/shoe-ownership-statistics/"><img src="https://urbanstylefootwear.com/wp-content/uploads/2026/10/usf-world-shoes-per-person-2019-2025.png" alt="Bar chart of world shoe production per person: 3.1 pairs in 2019, 2.6 in 2020, 3.0 in 2024 and 3.0 in 2025" width="800" style="max-width:100%;height:auto"></a><figcaption>Source: UrbanStyle Footwear, based on World Footwear Yearbooks and World Bank population (UrbanStyle calculation). <a href="https://urbanstylefootwear.com/shoe-ownership-statistics/">Shoe Ownership Statistics 2026</a></figcaption></figure>Click the code, press Ctrl+C (Cmd+C on Mac), and paste it into any web page. Please keep the attribution link.
View as table
| Year | World production, billion pairs | World population | Pairs per person | Production figure |
|---|---|---|---|---|
| 2019 | 24.3 | 7,777,162,476 | 3.12 | published |
| 2020 | 20.5 | 7,853,863,139 | 2.61 | implied |
| 2021 | 22.2 | 7,919,567,995 | 2.81 | implied |
| 2022 | 23.9 | 7,988,550,201 | 2.99 | published |
| 2023 | 22.4 | 8,062,923,417 | 2.78 | implied |
| 2024 | 24.5 | 8,140,897,523 | 3.01 | published |
| 2025 | 24.6 | 8,215,424,893 | 2.99 | published |
I use production as the world total because, over a year or so, the shoes made are the shoes bought. The 62 countries in the Yearbook’s free consumption ranking add up to 20,532 million pairs, about 83% of world output; the rest is spread across smaller countries.
Sources: World Footwear Yearbooks 2020 to 2026 (tiers C and D); World Bank population (tier B). Per-person figures are my calculations (tier E).Which countries buy the most shoes?
Short answer. In total pairs in 2025: 1. China 4,817 million, 2. India 2,772 million, 3. United States 1,950 million, then Brazil (787 million), Japan (639 million) and Pakistan (620 million). (World Footwear Yearbook 2026)
Filter by region. Countries marked with a dagger (†) are trade or re-export hubs, where some shoes counted as consumed are passing through.
| # | Country | Pairs, 2025 (million) | Population, 2025 (million) | Pairs per person |
|---|---|---|---|---|
| 1 | China | 4,817 | 1,406.6 | 3.4 |
| 2 | India | 2,772 | 1,463.9 | 1.9 |
| 3 | United States | 1,950 | 341.8 | 5.7 |
| 4 | Brazil | 787 | 212.8 | 3.7 |
| 5 | Japan | 639 | 123.4 | 5.2 |
| 6 | Pakistan | 620 | 255.2 | 2.4 |
| 7 | Bangladesh | 455 | 175.7 | 2.6 |
| 8 | Germany | 412 | 83.5 | 4.9 |
| 9 | Russia | 373 | 143.5 | 2.6 |
| 10 | Indonesia | 370 | 285.7 | 1.3 |
| 11 | France | 358 | 68.7 | 5.2 |
| 12 | Mexico | 340 | 131.9 | 2.6 |
| 13 | United Kingdom | 326 | 69.5 | 4.7 |
| 14 | Italy | 289 | 58.9 | 4.9 |
| 15 | Türkiye | 283 | 85.9 | 3.3 |
| 16 | United Arab Emirates † | 273 | 11.5 | 23.7 |
| 17 | Spain | 261 | 49.4 | 5.3 |
| 18 | Nigeria | 258 | 237.5 | 1.1 |
| 19 | Philippines | 226 | 116.8 | 1.9 |
| 20 | Thailand | 210 | 71.6 | 2.9 |
| 21 | South Korea | 208 | 51.7 | 4.0 |
| 22 | Iraq | 206 | 47.0 | 4.4 |
| 23 | Ghana | 201 | 35.1 | 5.7 |
| 24 | South Africa | 198 | 64.7 | 3.1 |
| 25 | Chile † | 180 | 19.9 | 9.1 |
| 26 | Vietnam | 177 | 101.6 | 1.7 |
| 27 | Iran | 173 | 92.4 | 1.9 |
| 28 | Canada | 163 | 41.7 | 3.9 |
| 29 | Tanzania | 150 | 70.5 | 2.1 |
| 30 | Poland | 143 | 36.4 | 3.9 |
| 31 | Australia | 137 | 27.6 | 5.0 |
| 32 | Argentina | 133 | 45.9 | 2.9 |
| 33 | Malaysia | 133 | 36.0 | 3.7 |
| 34 | Kenya | 132 | 57.5 | 2.3 |
| 35 | Panama † | 118 | 4.6 | 25.8 |
| 36 | Colombia | 118 | 53.4 | 2.2 |
| 37 | Cameroon | 111 | 29.9 | 3.7 |
| 38 | Togo † | 108 | 8.6 | 12.6 |
| 39 | Peru | 107 | 34.6 | 3.1 |
| 40 | Taiwan | 106 | n/a | n/a |
| 41 | Morocco | 101 | 38.4 | 2.6 |
| 42 | Saudi Arabia | 100 | 37.0 | 2.7 |
| 43 | Senegal | 93 | 18.9 | 4.9 |
| 44 | Ethiopia | 87 | 135.5 | 0.6 |
| 45 | Guinea | 87 | 15.1 | 5.8 |
| 46 | Egypt | 84 | 118.4 | 0.7 |
| 47 | Netherlands | 79 | 18.1 | 4.4 |
| 48 | Mozambique | 76 | 35.6 | 2.1 |
| 49 | Portugal | 73 | 10.8 | 6.8 |
| 50 | Greece | 67 | 10.4 | 6.4 |
| 51 | Yemen | 63 | 41.8 | 1.5 |
| 52 | Angola | 62 | 39.0 | 1.6 |
| 53 | Austria | 59 | 9.2 | 6.4 |
| 54 | Romania | 58 | 19.0 | 3.0 |
| 55 | Singapore † | 57 | 6.1 | 9.3 |
| 56 | Algeria | 56 | 47.4 | 1.2 |
| 57 | Somalia | 53 | 19.7 | 2.7 |
| 58 | DR Congo | 53 | 112.8 | 0.5 |
| 59 | Myanmar | 51 | 54.9 | 0.9 |
| 60 | Venezuela | 51 | 28.5 | 1.8 |
| 61 | Cambodia | 51 | 17.8 | 2.9 |
| 62 | Switzerland | 50 | 9.1 | 5.5 |
Which countries buy the most shoes per person?
Short answer. Among countries of 20 million people or more, Ghana and the US lead at about 5.7 pairs per person in 2025, followed by Spain (5.3), France (5.2) and Japan (5.2). The lowest are the DR Congo (0.5), Ethiopia (0.6) and Egypt (0.7). (My calculation from the Yearbook and World Bank)
Embed this chart
<figure style="margin:0"><a href="https://urbanstylefootwear.com/shoe-ownership-statistics/"><img src="https://urbanstylefootwear.com/wp-content/uploads/2026/10/usf-shoes-bought-per-person-by-country-2025.png" alt="Bar chart of 2025 pairs bought per person: Ghana 5.7, US 5.7, Spain 5.3, France 5.2, Japan 5.2, Germany 4.9, UK 4.7" width="800" style="max-width:100%;height:auto"></a><figcaption>Source: UrbanStyle Footwear, based on the World Footwear Yearbook 2026 and World Bank population (UrbanStyle calculation). <a href="https://urbanstylefootwear.com/shoe-ownership-statistics/">Shoe Ownership Statistics 2026</a></figcaption></figure>Click the code, press Ctrl+C (Cmd+C on Mac), and paste it into any web page. Please keep the attribution link.
View as table
| Country | Pairs consumed 2025, million | Population 2025 | Pairs per person |
|---|---|---|---|
| Ghana | 201 | 35,064,272 | 5.7 |
| United States | 1,950 | 341,784,857 | 5.7 |
| Spain | 261 | 49,355,143 | 5.3 |
| France | 358 | 68,720,337 | 5.2 |
| Japan | 639 | 123,366,734 | 5.2 |
| Australia | 137 | 27,614,411 | 5.0 |
| Germany | 412 | 83,491,249 | 4.9 |
| Italy | 289 | 58,915,656 | 4.9 |
| United Kingdom | 326 | 69,487,000 | 4.7 |
| Iraq | 206 | 47,020,774 | 4.4 |
| South Korea | 208 | 51,684,564 | 4.0 |
| Poland | 143 | 36,435,861 | 3.9 |
| Canada | 163 | 41,651,653 | 3.9 |
| Cameroon | 111 | 29,879,337 | 3.7 |
| Brazil | 787 | 212,812,405 | 3.7 |
Small trade hubs show much higher figures: Panama about 25.8 pairs per person, the UAE 23.7, Togo 12.6, Singapore 9.3 and Chile 9.1. The Yearbook estimates consumption as production plus imports minus exports, so shoes that arrive and move on without being fully recorded as exports can count as “consumed”. My reading is that these figures say more about trade routes than about wardrobes, so I keep them out of the ranking. Ghana is also a regional port, so part of its figure may be shoes moving on to its neighbours.
Below the 20 million line, several European countries come out higher than any large country: Portugal about 6.8 pairs per person, Greece and Austria about 6.4 and Switzerland 5.5. Canada, at 3.9, buys noticeably fewer pairs per person than the US. All of these are in the full table above.
Sources: World Footwear Yearbook 2026 (tier C); World Bank population 2025 (tier B). Per-person figures and the hub reading are my analysis (tier E).How do regions compare?
Short answer. North America 4.6 pairs per person, Europe 4.1, Asia 2.6 and Africa 1.6 in 2025. Asia buys 56% of the world’s shoes and Africa 10.7%. (World Footwear Yearbook 2026)
| Region | Pairs per person, 2025 | Share of world consumption |
|---|---|---|
| North America | 4.6 | not stated |
| Europe | 4.1 | not stated |
| Asia | 2.6 | 56.0% |
| Africa | 1.6 | 10.7% |
Asia buys most of the world’s shoes because most of the world’s people live there, not because Asians buy more each. North Americans buy almost three times as many pairs per person as Africans.
Source: World Footwear Yearbook 2026 and World Footwear, August 18, 2026 (tier C). The free sample doesn’t clearly label the other regions’ shares, so I leave them out.How many pairs of shoes do Americans buy each year?
Short answer. About 1.95 billion pairs in 2025, or 5.7 per person (World Footwear Yearbook 2026). Customs records show 1,986 million pairs imported, and the US makes only about 25 million itself, so the two sources agree closely.
Embed this chart
<figure style="margin:0"><a href="https://urbanstylefootwear.com/shoe-ownership-statistics/"><img src="https://urbanstylefootwear.com/wp-content/uploads/2026/10/usf-us-shoe-imports-per-person-2019-2025.png" alt="Bar chart of US shoe imports per person: 7.5 pairs in 2019, 5.6 in 2020, 8.2 in 2022, 5.9 in 2023 and 5.8 in 2025" width="800" style="max-width:100%;height:auto"></a><figcaption>Source: UrbanStyle Footwear, based on UN Comtrade and World Bank population (UrbanStyle calculation). <a href="https://urbanstylefootwear.com/shoe-ownership-statistics/">Shoe Ownership Statistics 2026</a></figcaption></figure>Click the code, press Ctrl+C (Cmd+C on Mac), and paste it into any web page. Please keep the attribution link.
View as table
| Year | US imports, million pairs | US population | Imported pairs per person |
|---|---|---|---|
| 2019 | 2,471 | 330,226,227 | 7.5 |
| 2020 | 1,872 | 331,578,104 | 5.6 |
| 2021 | 2,422 | 332,100,166 | 7.3 |
| 2022 | 2,730 | 333,996,304 | 8.2 |
| 2023 | 1,987 | 336,755,052 | 5.9 |
| 2024 | 2,155 | 340,003,797 | 6.3 |
| 2025 | 1,986 | 341,784,857 | 5.8 |
| Measure, US, 2025 | Million pairs | Source |
|---|---|---|
| Pairs imported (HS 6401 to 6405) | 1,986 | UN Comtrade (tier B) |
| Pairs made in the US | about 25 | FDRA (tier C) |
| Imports plus US production | about 2,011 | My calculation (tier E) |
| Pairs consumed (Yearbook estimate) | 1,950 | World Footwear Yearbook 2026 (tier C) |
The gap of about 60 million pairs is what you’d expect from exports and stock changes. US exports in pairs aren’t complete in Comtrade, so I don’t calculate them. In money terms, Americans spent $121.15 billion on footwear in 2025, about $62 for each pair bought. More on spending is in my footwear spending statistics and US footwear market statistics.
Sources: UN Comtrade (tier B); FDRA (tier C); World Footwear Yearbook 2026 (tier C); BEA (tier B). Per-person and per-pair figures are my calculations (tier E).Who spends the most on shoes in the US?
Short answer. The average US household spent $461 on footwear in 2024. Households headed by someone aged 35 to 44 spent the most ($648), and the richest fifth spent $840, almost three times the poorest fifth ($302). (BLS Consumer Expenditure Survey)
Embed this chart
<figure style="margin:0"><a href="https://urbanstylefootwear.com/shoe-ownership-statistics/"><img src="https://urbanstylefootwear.com/wp-content/uploads/2026/10/usf-us-footwear-spending-by-age-2024.png" alt="Bar chart of US household shoe spending by age in 2024: under 25 $256, 35 to 44 $648, 75 and over $159" width="800" style="max-width:100%;height:auto"></a><figcaption>Source: UrbanStyle Footwear, based on the BLS Consumer Expenditure Survey. <a href="https://urbanstylefootwear.com/shoe-ownership-statistics/">Shoe Ownership Statistics 2026</a></figcaption></figure>Click the code, press Ctrl+C (Cmd+C on Mac), and paste it into any web page. Please keep the attribution link.
View as table
| Age of household reference person | Footwear spending per household 2024, USD |
|---|---|
| Under 25 | 256 |
| 25 to 34 | 534 |
| 35 to 44 | 648 |
| 45 to 54 | 617 |
| 55 to 64 | 483 |
| 65 to 74 | 276 |
| 75 and over | 159 |
| All households | 461 |
| Household income before taxes, 2024 | Footwear spending per household |
|---|---|
| Lowest 20% | $302 |
| Second 20% | $299 |
| Middle 20% | $415 |
| Fourth 20% | $450 |
| Highest 20% | $840 |
| All households | $461 |
The household survey is a different lens from national accounts. Multiplying $461 by 135.76 million households gives about $62.6 billion, about 54% of the BEA’s $116.1 billion for the same year. Household surveys are known to capture less spending than national accounts, so use the survey for comparing groups and the BEA figure for the total.
Sources: BLS Consumer Expenditure Survey via FRED (tier B); BLS news release, December 19, 2025 (tier B); BEA (tier B). The comparison is my calculation (tier E).How many pairs of shoes does the average person own?
Short answer. Nobody measures it officially. The best published poll I could open, a US CivicScience poll from October 2021, found more than a quarter own 2 to 4 pairs, a larger share own 5 to 9, and more than 20% own 15 or more. It doesn’t publish its sample size or method.
Popular figures such as “the average woman owns 27 pairs” or “the average person owns 7 to 8 pairs” appear in many articles. On the pages that quote them, the sources given are brand surveys, old news stories or other blogs, and none gives a sample or method I could check. That doesn’t make them wrong, but it does mean you can’t cite them as statistics.
What you can say with confidence: people in the US buy about 5.7 pairs a year, so anyone who keeps shoes for two or three years will own well over ten pairs, and anyone who wears a pair until it falls apart will own far fewer. That is arithmetic, not a survey, and I label it as such.
Source: CivicScience, October 18, 2021 (tier D, method not published). The last paragraph is my analysis (tier E).How many people in the world go without shoes?
Short answer. There is no measured figure. What is measured are diseases linked to going barefoot: about 4 million people in 17 countries have podoconiosis, which footwear prevents, and about 1.5 billion have soil-transmitted worm infections, with hookworm caught mainly by walking barefoot. (WHO)
The WHO says people with podoconiosis lose 45% of their productive working time, and in Ethiopia alone it estimates the disease costs about 172,000 healthy life-years a year. Ethiopia also has one of the lowest shoe consumption figures on this page, about 0.6 pairs per person. You will see claims that “1 billion” people have no shoes; I found no study behind that number.
Sources: WHO podoconiosis fact sheet, May 1, 2023, and soil-transmitted helminth infections fact sheet, January 18, 2023 (tier B). The comparison with consumption is my analysis (tier E).Why do shoe ownership numbers disagree so much?
Short answer. Because they measure different things: pairs owned (polls), pairs bought (industry estimates), pairs imported (customs) and money spent (national accounts and surveys).
| Measure | What it counts | Example, US | Watch out for |
|---|---|---|---|
| Pairs owned | Shoes in the closet | Poll ranges only | Unpublished methods, guesses |
| Pairs consumed | Production plus imports minus exports | 1,950 million (2025) | Trade hubs, estimates |
| Pairs imported | Pairs crossing the border | 1,986 million (2025) | Retailer stock swings |
| National accounts | All household spending on shoes | $121.15 billion (2025) | Money, not pairs; prices change |
| Household survey | What households report spending | $461 per household (2024) | Captures about half the national total |
Who measures how many shoes people buy?
Select a step to see each source and how I use it.
1FactoriesProduction in each country
Every pair starts here. The world made 24.6 billion pairs in 2025, which I use as the world total.
2CustomsUN Comtrade, national customs
Counts pairs crossing borders. For the US, which makes about 1% of its shoes, imports are close to what people buy.
3Industry yearbookAPICCAPS, World Footwear Yearbook
Estimates pairs consumed in each country as production plus imports minus exports, for 62 countries in the free sample.
4Spending statisticsBEA national accounts, BLS household survey
Measure money spent on shoes, by country total and by household type.
5PollsPollsters and brands
Ask people how many pairs they own. The only direct ownership measure, but rarely with a published method.
How good is the evidence behind shoe ownership statistics?
Short answer. Good for pairs bought and money spent, weak for pairs owned. Of the 204 rows in this page’s dataset, 24% are official statistics (tier B), 35% industry research (tier C), 3% secondary reporting or polls (tier D) and 39% my calculations (tier E).
| Evidence tier | Rows | Share |
|---|---|---|
| A Peer-reviewed research | 0 | 0% |
| B Official statistics | 48 | 24% |
| C Industry research | 71 | 35% |
| D Secondary reporting and polls | 6 | 3% |
| E UrbanStyle calculations | 79 | 39% |
| Total | 204 | 100% |
Where other shoe ownership articles go wrong
I read the pages that rank for shoe ownership and shoe consumption searches. These are problems I saw on them. This is not a complete audit of anyone’s work.
- Problem 1Ownership averages with no sample, method or year.
- Problem 2Pages last updated in 2023 or earlier, presented as current.
- Problem 3Text and tables on the same page giving different numbers for the same thing.
- Problem 4A list of sources at the bottom, but no way to tell which number came from which source.
- Problem 5Pairs owned, pairs bought and money spent mixed together.
- Problem 6“1 billion people without shoes” repeated with no study behind it.
- Problem 7No downloadable data, so nobody can check or reuse the numbers.
Sources and evidence tiers
Evidence hierarchy
- APeer-reviewed research. Not used on this page.
- BOfficial statistics. World Bank, UN Comtrade, BEA, BLS and WHO.
- CIndustry research. The World Footwear Yearbook 2026 and FDRA.
- DSecondary reporting and polls. Trade press summaries of earlier Yearbooks and the CivicScience poll.
- EUrbanStyle calculations. Pairs per person, cross-checks and comparisons, with the method stated.
Source table
| Source | Year | Sample | Geography | Finding used | Tier | Series ID | Primary source |
|---|---|---|---|---|---|---|---|
| APICCAPS, World Footwear Yearbook 2026, free sample report (PDF), consumption ranking and per capita text | 2026 | Industry yearbook, 2025 data | Global | Footwear consumption in 2025 for 62 countries (China 4,817 million pairs to Switzerland 50 million); per capita North America 4.6, Europe 4.1, Asia 2.6, Africa 1.6 pairs; Asia 56% and Africa 10.7% of world consumption; world production 24.6 billion pairs | C | Consumption table; Map 2 | Yearbook sample (PDF) |
| World Footwear, "Asia accounts for 56% of global footwear consumption" (August 18, 2026) | 2026 | Publisher's summary of the Yearbook 2026 | Global | Asia 56% and Africa 10.7% of consumption; per capita North America 4.6, Europe 4.1, Asia 2.6, Africa 1.6 pairs | C | n/a | World Footwear article |
| World Bank, Population, total (SP.POP.TOTL), 2019 to 2025 (read October 26, 2026) | 2025 | Official population estimates | Global | World population 8,215,424,893 in 2025; country populations used for per-person figures | B | SP.POP.TOTL | World Bank indicator |
| United Nations Comtrade, US-reported imports of HS headings 6401 to 6405, quantity in pairs, 2019 to 2025 (public API, read October 26, 2026) | 2025 | Customs records | United States | US footwear imports of 2,471 million pairs in 2019, 1,872 million in 2020, 2,730 million in 2022 and 1,986 million in 2025 | B | HS 6401 to 6405, quantity unit: pairs | UN Comtrade |
| Footwear Distributors and Retailers of America (FDRA), industry facts on its website (as read September 21, 2026) | 2026 | US trade association statement | United States | About 25 million pairs of shoes made in the US | C | n/a | FDRA website |
| US Bureau of Economic Analysis, personal consumption expenditures on footwear, via FRED (DFTWRC1A027NBEA, updated September 30, 2026) | 2025 | US national accounts | United States | Household footwear spending $116.061 billion in 2024 and $121.150 billion in 2025 | B | DFTWRC1A027NBEA | FRED series |
| US Bureau of Labor Statistics, Consumer Expenditure Surveys, footwear, via FRED (CXUFOOTWEARLB0101M and the age and income series; updated December 19, 2025) | 2024 | Household survey | United States | Average footwear spending per household $461 in 2024; by age $159 to $648; by income quintile $299 to $840 | B | CXUFOOTWEARLB0101M, LB0102M to LB0106M, LB0402M to LB0409M | FRED series |
| US Bureau of Labor Statistics, "Consumer Expenditures 2024" news release (December 19, 2025) | 2025 | Official release | United States | 135,760 thousand consumer units in 2024; average annual expenditures $78,535 | B | USDL release cesan | BLS release |
| World Health Organization, "Podoconiosis (non-filarial lymphoedema)" fact sheet (May 1, 2023) | 2023 | Official health fact sheet | Global | About 4 million people affected in 17 countries; prevented by wearing footwear; affected people lose 45% of productive working time; about 172,073 DALYs a year in Ethiopia | B | n/a | WHO fact sheet |
| World Health Organization, "Soil-transmitted helminth infections" fact sheet (January 18, 2023) | 2023 | Official health fact sheet | Global | About 1.5 billion people infected; people become infected with hookworm primarily by walking barefoot on contaminated soil | B | n/a | WHO fact sheet |
| CivicScience, "Trend-conscious consumers love shoe shopping above all other fashion items" (October 18, 2021) | 2021 | Online poll; sample size and method not published on the page | United States | More than a quarter own 2 to 4 pairs; a larger share own 5 to 9; more than 20% own 15 or more | D | n/a | CivicScience article |
| World Footwear, "Footwear production with new record of 24.3 billion pairs" (August 4, 2020) | 2020 | Trade press summary of the Yearbook 2020 | Global | Production 24.3 billion pairs in 2019 | D | n/a | World Footwear article |
| World Footwear, "Growth in production accumulated over a decade wiped away in 2020" (August 3, 2021) | 2021 | Trade press summary of the Yearbook 2021 | Global | Production fell 15.8% in 2020 | D | n/a | World Footwear article |
| World Footwear, "All the facts and numbers of the footwear industry in 2021" (September 28, 2022) | 2022 | Trade press summary of the Yearbook 2022 | Global | Production up 8.6% in 2021, over 22 billion pairs | D | n/a | World Footwear article |
| World Footwear, "2022: global footwear production reaches 23.9 billion pairs" (July 27, 2023) | 2023 | Trade press summary of the Yearbook 2023 | Global | Production 23.9 billion pairs in 2022 | D | n/a | World Footwear article |
| World Footwear, "Footwear production rebounds in 2024" (August 5, 2025) | 2025 | Trade press summary of the Yearbook 2025 | Global | 2023 production fell by about 1.5 billion pairs | D | n/a | World Footwear article |
| UrbanStyle Footwear calculations on this page | 2026 | Arithmetic on figures from the sources above; method stated | Global | Pairs per person, world pairs per person, US imports per person, cross-checks and survey coverage on this page | E | n/a | Methodology |
Methodology and limitations
How I built this page. I took pairs consumed in 2025 for 62 countries and the regional per-person figures from the World Footwear Yearbook 2026 free sample, and divided each country’s pairs by its 2025 population from the World Bank. For the world, I divided production by world population for each year from 2019 to 2025, using the production figures from each year’s Yearbook summary; 2020, 2021 and 2023 are implied by published percentage changes. For the US, I read imports in pairs (HS 6401 to 6405) for 2019 to 2025 from UN Comtrade and household spending from the BEA and the BLS Consumer Expenditure Survey. Everything was read on October 26, 2026.
Choices I made. I measure pairs bought, not pairs owned, because only the first is measured. I rank pairs per person only for countries of 20 million people or more, and I keep five trade hubs out of the ranking. Region groupings in the country table are mine; the regional per-person figures are the Yearbook’s.
Limitations you should know about
- Estimates. Consumption is the Yearbook’s estimate, not a count of sales.
- Trade hubs. Re-exports can inflate consumption in hub countries.
- Population year. I use 2025 World Bank figures; Taiwan is not in that dataset, so it has no per-person figure.
- Ownership. No official data. The poll shown doesn’t publish its method.
- US exports. Comtrade’s 2025 export quantities are incomplete, so the US cross-check stops at imports plus production.
Data freshness
| Date | Change |
|---|---|
| October 26, 2026 | First publication. Yearbook 2026 consumption for 62 countries, World Bank 2025 population, UN Comtrade US imports 2019 to 2025, BEA 2025 and BLS 2024 spending, WHO fact sheets. |
| When BLS publishes 2025 consumer spending | Planned update of the household spending figures. |
| January 2027 | Next scheduled full review. |
Last full source review: October 26, 2026. Next scheduled review: January 2027.
Corrections. If you spot an error or know of an ownership survey with a published method, email info@urbanstylefootwear.com with the subject “Data correction”. How we review products is explained in our methodology.
For journalists and researchers
You can use the statistics and charts on this page with credit to UrbanStyle Footwear. Wherever you can, please cite the original source printed with each statistic. My own calculations are marked tier E and can be cited to me.
A sentence you can use. “The world made 24.6 billion pairs of shoes in 2025, about three for every person, but Americans bought about 5.7 pairs each and Africans about 1.6.” (Sources: World Footwear Yearbook 2026; World Bank; calculation by UrbanStyle Footwear)
Media kit
All figures with value, unit, geography, segment, basis, period, source and evidence tier.
Four charts with source, scope and data type printed on each image. SVG versions are under each chart above.
The 15 citable statistics on one printable PDF.
Every source with year, sample, geography, tier, series ID and link.
All 62 countries: pairs consumed, population, pairs per person and hub flag.
Ready-made citations below. Media and research enquiries go to info@urbanstylefootwear.com.
Cite this page
Suggested citation
UrbanStyle Footwear. “Shoe Ownership Statistics 2026: How Many Shoes People Buy and Own.” Updated October 26, 2026. https://urbanstylefootwear.com/shoe-ownership-statistics/
APA style
Vahith, A. (2026, October 26). Shoe ownership statistics 2026: How many shoes people buy and own. UrbanStyle Footwear. https://urbanstylefootwear.com/shoe-ownership-statistics/
Link (HTML)
<a href="https://urbanstylefootwear.com/shoe-ownership-statistics/">Shoe Ownership Statistics by UrbanStyle Footwear</a>Click any citation, then press Ctrl+C (Cmd+C on Mac) to copy it.
For individual statistics, UrbanStyle recommends citing the original source listed in the source table whenever possible.
Data requests. Data correction or dataset request: info@urbanstylefootwear.com
Frequently asked questions
How many pairs of shoes does the average person own?
No official statistic counts it. National statistics offices measure shoes bought, not shoes in the closet, and the polls that ask about ownership rarely publish their sample or method. One US poll found more than a quarter of people own 2 to 4 pairs and more than 20% own 15 or more. See what we know about ownership.
How many pairs of shoes does the average person buy per year?
About 3.0 pairs worldwide in 2025: 24.6 billion pairs made for 8.2 billion people. It is about 5.7 in the US, 3.4 in China and 1.9 in India, by my calculation from the World Footwear Yearbook 2026.
How many pairs of shoes do Americans buy a year?
About 5.7 pairs per person, or 1,950 million pairs in 2025 (World Footwear Yearbook 2026). Customs records show 1,986 million pairs imported that year, and the US makes only about 25 million pairs itself.
How many shoes are sold in the world each year?
About 24.6 billion pairs were made in 2025, which is the best measure of what the world uses in a year. The 62 countries the Yearbook ranks consumed 20,532 million pairs between them.
Which country buys the most shoes?
China, with 4,817 million pairs in 2025, followed by India (2,772 million) and the US (1,950 million) (World Footwear Yearbook 2026). Per person, Ghana and the US lead among large countries.
Which country buys the most shoes per person?
Among countries with at least 20 million people, Ghana and the US, at about 5.7 pairs per person each in 2025, then Spain, France and Japan at about 5.2. Ghana is a regional trading port, so part of its figure may be shoes moving on to neighbours. Small trade hubs such as Panama and the UAE show far higher figures for the same reason. See pairs per person.
Do women own more shoes than men?
Polls usually say so, but none I found publishes a sample and method I could check, and no official source splits shoe ownership by sex. The US household survey reports spending per household, not per person or by sex.
How much does the average American spend on shoes?
The average US household spent $461 on footwear in 2024 (BLS). National accounts put total US footwear spending at $121.15 billion in 2025, about $62 for each pair bought. See my footwear spending statistics.
Who spends the most on shoes in the US?
Households headed by someone aged 35 to 44 spent $648 in 2024, and the richest fifth of households spent $840, almost three times the poorest fifth (BLS Consumer Expenditure Survey).
Are people buying more shoes than before?
Worldwide, not really. The world made about 3.1 pairs per person in 2019 and 3.0 in 2025. US imports per person swung from 5.6 pairs in 2020 to 8.2 in 2022 and 5.8 in 2025.
How many people in the world don't have shoes?
There is no measured figure. The often-quoted “1 billion people without shoes” has no study behind it that I could find. What is measured: about 4 million people have podoconiosis, a disease footwear prevents, and about 1.5 billion people have soil-transmitted worm infections, with hookworm caught mainly by walking barefoot (WHO).
Why are the UAE and Panama so high per person?
They are trade and re-export hubs. The Yearbook estimates consumption as production plus imports minus exports, so shoes that pass through and are not fully recorded as exports can show up as “consumed”. I flag those countries rather than rank them.
Where do these numbers come from?
Pairs consumed come from the World Footwear Yearbook 2026, population from the World Bank, US imports from UN Comtrade and spending from the BEA and BLS. Every figure has a source and evidence tier in the source table.
Can I use these statistics and download the data?
Yes, with credit to UrbanStyle Footwear, and please cite the original source for any single statistic. The CSV, XLSX, charts and a printable list of key statistics are in the media kit, with citation formats.