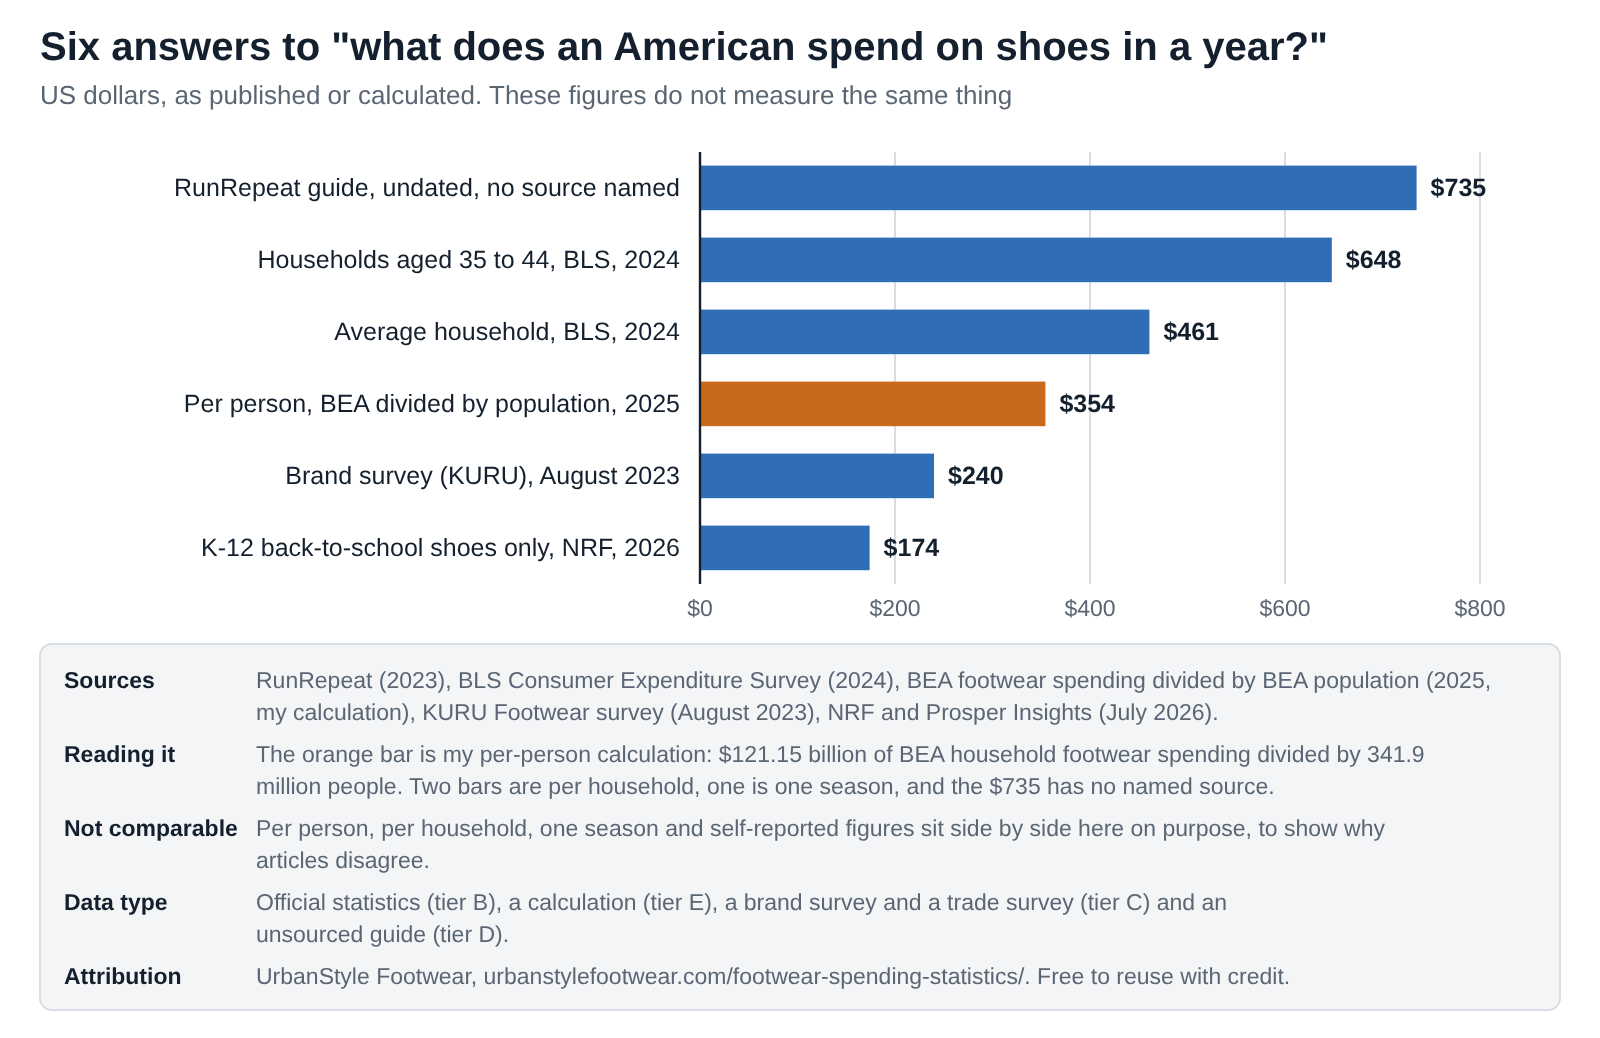

I went looking for what the average American spends on shoes in a year and found six different answers, from $174 to $735. This page shows where each one comes from, which ones I trust and what I left out, with every source dated, linked and graded, and the data free to download.
One question, six answers: what does an American spend on shoes in a year? Select a source to see what each figure counts.
Select a source above, for example “Online guide”, to see why the headline numbers disagree.
$354My calculation: the Bureau of Economic Analysis measured US household footwear spending at $121.15 billion in 2025, and dividing by a population of 341.9 million gives about $354 a year. It counts babies and every kind of seller (tier E, from tier B inputs).
$461The Bureau of Labor Statistics survey found the average US household (it says "consumer unit") spent $461 on footwear in 2024 (tier B). That is per household, so it is not comparable with a per-person figure.
$648Households headed by someone aged 35 to 44 spent the most in 2024, 41% above the all-household average (tier B). Households aged 75 and over spent $159.
$240A KURU Footwear survey of 1,000 Americans in August 2023 found $240 a year on footwear and four pairs bought (tier C). It is self-reported and run by a shoe brand, with a margin of error of 4%.
$735A 2023 RunRepeat guide says Americans spend an average of $735 a year. It names no source or year, and a 2026 article that repeats it also says about $350 (tier D).
$174NRF found the average K-12 back-to-school shopper planned to spend $174.01 on shoes in July 2026 (tier C). That is one season and one group, not a yearly figure.
None of these is an official per-person figure. Full comparison: what does one American spend a year?
Footwear spending at a glance
Quick answer. There is no single official figure for how much the average American spends on shoes a year, because it depends on who you count. Dividing the Bureau of Economic Analysis’s $121.15 billion of 2025 household footwear spending by the population gives about $354 per person (my calculation). The Bureau of Labor Statistics’ household survey found the average household spent $461 in 2024. Brand surveys and online guides give anything from $240 to $735, and the $735 has no source. Households headed by someone aged 35 to 44 spend the most ($648) and those aged 75 and over the least ($159). If you need one sentence for an article, quote the household figure and name the source.
I built this page because every shoe spending article I read gave a different number and almost none said what it was counting. Below you’ll find what I could trace to a real source, what kind of evidence each number is, why the headline figures disagree, and what I left out. If you’re budgeting rather than researching, jump to working out your own budget, or read my footwear buying guide. For the market side, see my US footwear market statistics.
Key findings
- There is no official per-person figure. The Bureau of Economic Analysis (BEA) measured US household footwear spending at $121.15 billion in 2025, which works out to about $354 per person (my calculation). The Bureau of Labor Statistics (BLS) survey puts the average household at $461 in 2024.
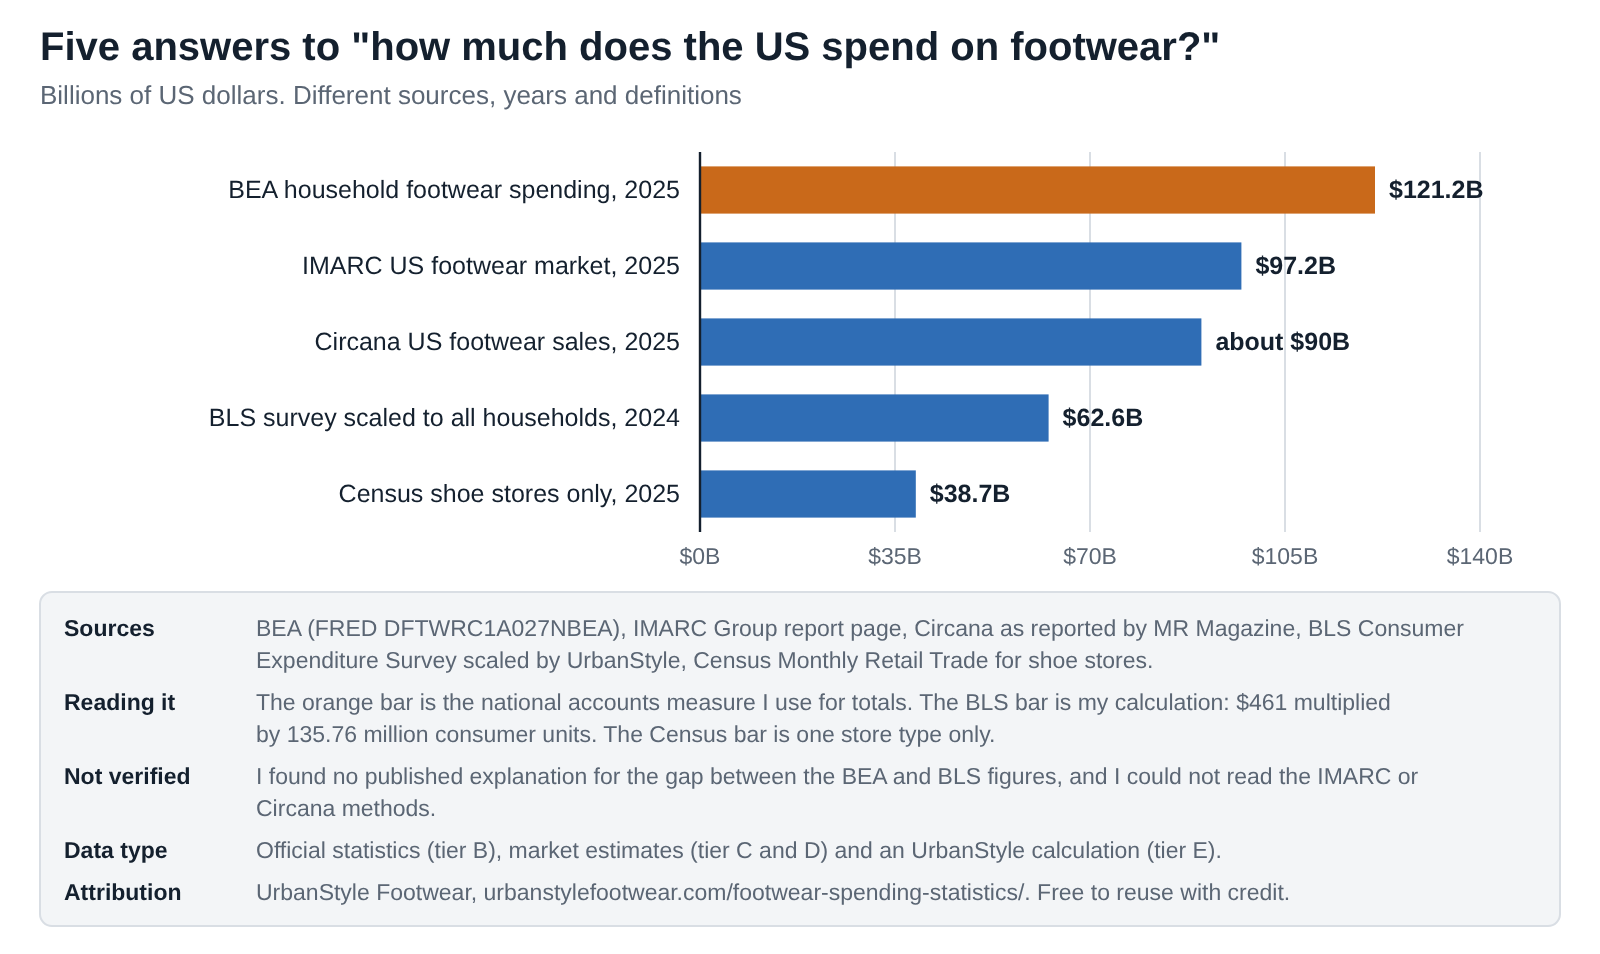
- Total spending is up 4.4% on 2024’s $116.06 billion. Other sources give lower totals: about $90 billion for 2025 (Circana, as reported by MR Magazine) and $97.16 billion (IMARC).
- Two federal measures disagree. For 2024, scaling the BLS household average to every household gives $62.6 billion, while BEA reports $116.1 billion, about 1.85 times as much. I found no published footwear-specific explanation, so I don’t assign a cause.
- Footwear is a small slice of the budget: 0.59% of the $78,535 the average household spent in 2024. Apparel and services together were 2.5%.
- Age matters more than most people expect. Households headed by someone aged 35 to 44 spent $648 in 2024, about 4.1 times the $159 spent by those aged 75 and over. Households aged 25 to 34 spent 53% more in 2024 than in 2021.
- Income matters too, but the data is noisy. The top fifth of households spent $840 and the bottom fifth $302, about 2.8 times as much. The bottom fifth was $130 in 2022.
- Spending is up, mostly through volume rather than higher prices. From 2019 to 2025 BEA footwear spending grew 31.9% in dollars, footwear prices rose 6.9%, and spending after prices rose 23.4%.
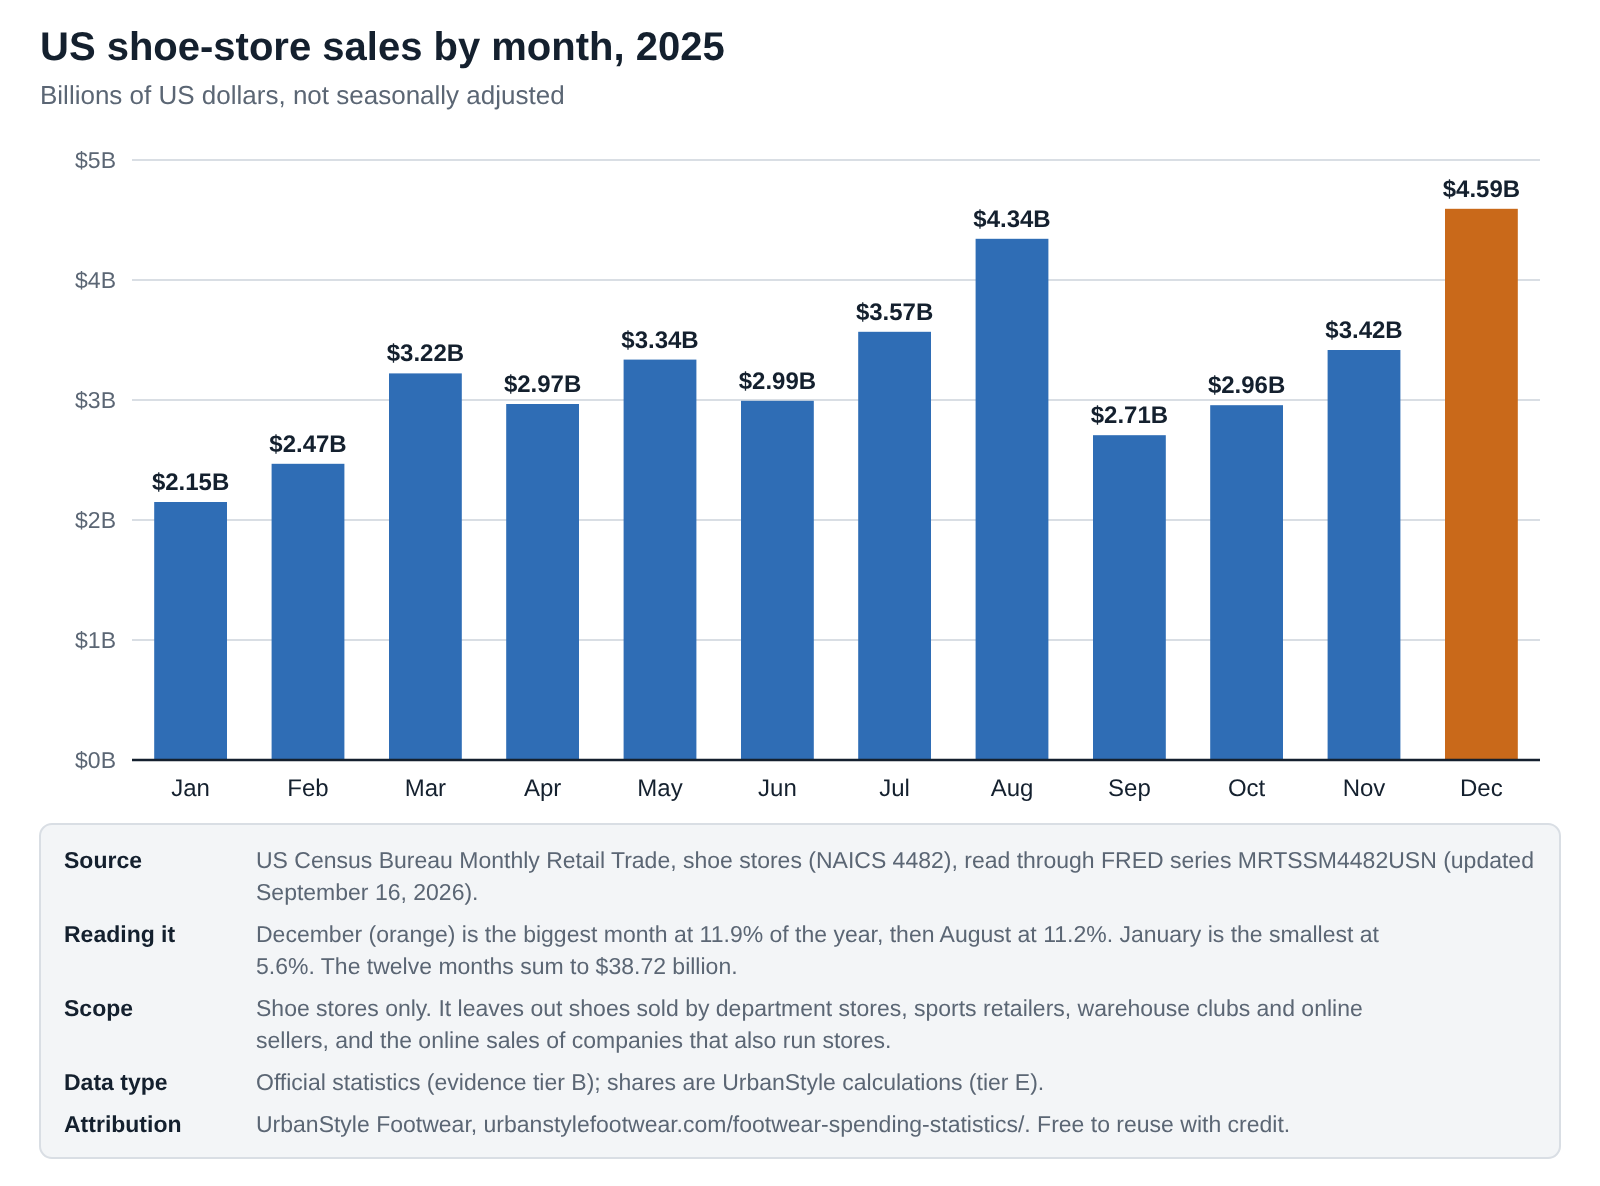
- Shoe stores sell the most in December and August. December 2025 was 11.9% of the year’s $38.72 billion in shoe-store sales and August 11.2%, against 5.6% for January.
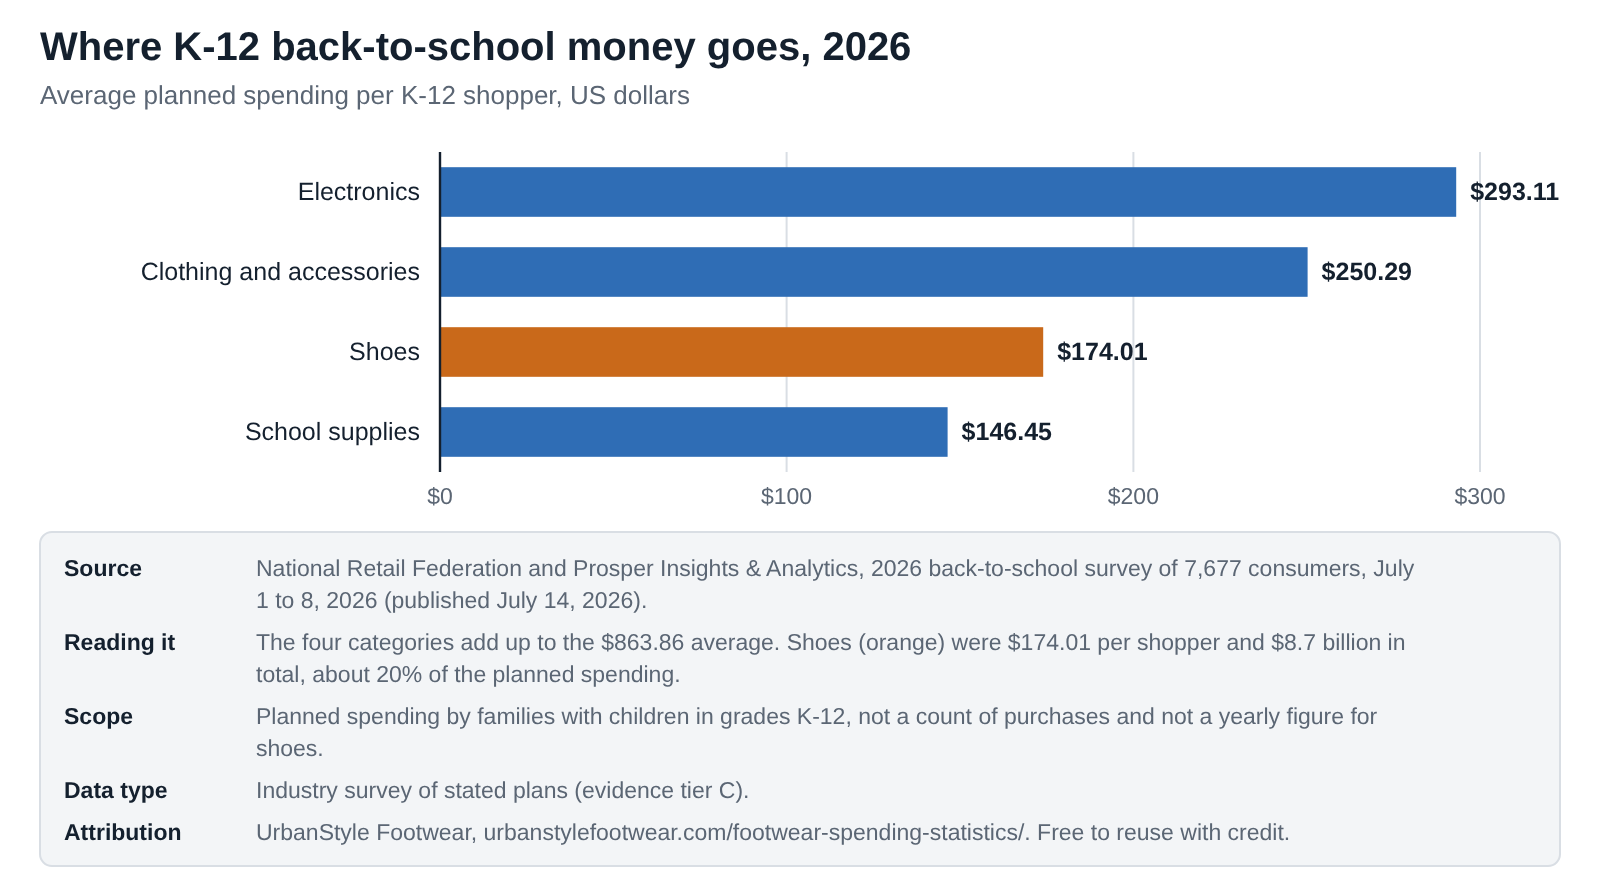
- Back-to-school is a real shoe season. NRF found K-12 shoppers planned to spend $174.01 on shoes in July 2026, $8.7 billion in total, about one dollar in five of their back-to-school budget.
- The 2026 signals are mild. Shoe-store sales for January to July were up 2.9% on a year earlier while footwear prices were up 3.4% in July, and Circana reported dollar sales up 1% in the first half with units down.
What we know and what we don’t
Here’s where the public evidence stands as of October 2026.
| Question | Evidence status | Why |
|---|---|---|
| Total US household footwear spending | Official statistic | BEA: $121.15 billion in 2025, annual, current dollars |
| Average spending per household | Official survey | BLS Consumer Expenditure Survey: $461 in 2024 |
| Average spending per person | No official figure | I calculated about $354 for 2025 from BEA and population data |
| Whether BEA or BLS is closer to the truth | Unresolved | For 2024 BEA is about 1.85 times the BLS-implied total, with no published explanation I could find |
| Spending by age and by income | Official survey | BLS 2021 to 2024 by age, 2022 to 2024 by income; per household and noisy year to year |
| Spending by region | Incomplete | I could read only two of the four regional series, so I left the split out |
| Is spending rising? | Yes, in dollars | BEA and BLS both show growth since 2019; most of the BEA rise is volume, not price |
| Average price per pair | No verified figure | The only per-pair number I found is implied by a brand survey: about $60 |
| Pairs bought per person | No verified figure | A brand survey says four a year; guides give higher numbers without sources |
| Spending by gender | No verified figure | The figures I found had no named source or year |
15 footwear spending statistics you can cite
Each card has one number, one sentence of context and its source. “Copy text” opens a box with the sentence, the source and a link back here. Please cite the original source for any single statistic. Cards marked E are my own calculations, and the method is on the card or in the dataset.
The Bureau of Economic Analysis measured US household spending on footwear at $121.15 billion in 2025, up 4.4% from $116.06 billion in 2024 (my calculation for the growth rate).
Copy text
$121.2B US household footwear spending, 2025: The Bureau of Economic Analysis measured US household spending on footwear at $121.15 billion in 2025, up 4.4% from $116.06 billion in 2024 (my calculation for the growth rate). Source: BEA via FRED (FRED series DFTWRC1A027NBEA (updated Sept 30, 2026)). Via UrbanStyle Footwear: https://urbanstylefootwear.com/footwear-spending-statistics/
Dividing the BEA's $121.15 billion by a US population of 341.9 million gives about $354 per person in 2025. It includes children and all kinds of sellers (UrbanStyle calculation).
Copy text
about $354 per person per year, 2025: Dividing the BEA's $121.15 billion by a US population of 341.9 million gives about $354 per person in 2025. It includes children and all kinds of sellers (UrbanStyle calculation). Source: UrbanStyle calculation. Via UrbanStyle Footwear: https://urbanstylefootwear.com/footwear-spending-statistics/
The average US household spent $461 on footwear in 2024, up from $444 in 2023 (BLS Consumer Expenditure Survey, per consumer unit).
Copy text
$461 average household footwear spending, 2024: The average US household spent $461 on footwear in 2024, up from $444 in 2023 (BLS Consumer Expenditure Survey, per consumer unit). Source: BLS Consumer Expenditure Survey (FRED series CXUFOOTWEARLB0101M (updated Dec 19, 2025)). Via UrbanStyle Footwear: https://urbanstylefootwear.com/footwear-spending-statistics/
Footwear was 0.59% of the $78,535 the average US household spent in 2024 (UrbanStyle calculation from BLS figures). Apparel and services together were 2.5%.
Copy text
0.59% of household spending goes to footwear: Footwear was 0.59% of the $78,535 the average US household spent in 2024 (UrbanStyle calculation from BLS figures). Apparel and services together were 2.5%. Source: UrbanStyle calculation. Via UrbanStyle Footwear: https://urbanstylefootwear.com/footwear-spending-statistics/
Households headed by someone aged 35 to 44 spent $648 on footwear in 2024, the most of any age group and 41% above the average (BLS Consumer Expenditure Survey).
Copy text
$648 households aged 35 to 44, 2024: Households headed by someone aged 35 to 44 spent $648 on footwear in 2024, the most of any age group and 41% above the average (BLS Consumer Expenditure Survey). Source: BLS CE footwear by age (FRED series CXUFOOTWEARLB0402M to CXUFOOTWEARLB0409M (updated Dec 19, 2025)). Via UrbanStyle Footwear: https://urbanstylefootwear.com/footwear-spending-statistics/
Households headed by someone aged 75 or over spent $159 on footwear in 2024, about a quarter of the $648 spent by households aged 35 to 44 (BLS Consumer Expenditure Survey).
Copy text
$159 households aged 75 and over, 2024: Households headed by someone aged 75 or over spent $159 on footwear in 2024, about a quarter of the $648 spent by households aged 35 to 44 (BLS Consumer Expenditure Survey). Source: BLS CE footwear by age (FRED series CXUFOOTWEARLB0402M to CXUFOOTWEARLB0409M (updated Dec 19, 2025)). Via UrbanStyle Footwear: https://urbanstylefootwear.com/footwear-spending-statistics/
The top fifth of households by income spent $840 on footwear in 2024 against $302 for the bottom fifth, about 2.8 times as much (BLS Consumer Expenditure Survey). The bottom fifth was $130 in 2022.
Copy text
$840 vs $302 highest vs lowest income fifth, 2024: The top fifth of households by income spent $840 on footwear in 2024 against $302 for the bottom fifth, about 2.8 times as much (BLS Consumer Expenditure Survey). The bottom fifth was $130 in 2022. Source: BLS CE footwear by income (FRED series CXUFOOTWEARLB0102M to CXUFOOTWEARLB0106M (updated Dec 19, 2025)). Via UrbanStyle Footwear: https://urbanstylefootwear.com/footwear-spending-statistics/
US household footwear spending grew 31.9% in current dollars from 2019 to 2025, while footwear prices rose 6.9% (UrbanStyle calculation from BEA data). After prices, spending rose 23.4%.
Copy text
+31.9% footwear spending growth, 2019 to 2025: US household footwear spending grew 31.9% in current dollars from 2019 to 2025, while footwear prices rose 6.9% (UrbanStyle calculation from BEA data). After prices, spending rose 23.4%. Source: UrbanStyle calculation. Via UrbanStyle Footwear: https://urbanstylefootwear.com/footwear-spending-statistics/
The average household spent 10.0% more on footwear in 2024 ($461) than in 2019 ($419). After footwear prices the rise is about 3% (UrbanStyle calculation from BLS and BEA data).
Copy text
+10.0% average household spending, 2019 to 2024: The average household spent 10.0% more on footwear in 2024 ($461) than in 2019 ($419). After footwear prices the rise is about 3% (UrbanStyle calculation from BLS and BEA data). Source: UrbanStyle calculation. Via UrbanStyle Footwear: https://urbanstylefootwear.com/footwear-spending-statistics/
For 2024 the BEA's $116.1 billion is about 1.85 times the $62.6 billion you get by scaling BLS's $461 to all 135.8 million households (UrbanStyle calculation). I found no published reconciliation.
Copy text
1.85x BEA vs BLS, same year: For 2024 the BEA's $116.1 billion is about 1.85 times the $62.6 billion you get by scaling BLS's $461 to all 135.8 million households (UrbanStyle calculation). I found no published reconciliation. Source: UrbanStyle calculation. Via UrbanStyle Footwear: https://urbanstylefootwear.com/footwear-spending-statistics/
US shoe stores sold $38.72 billion in 2025, about 32% of household footwear spending (Census Bureau monthly data summed by UrbanStyle; BEA for the total).
Copy text
$38.7B US shoe-store sales, 2025: US shoe stores sold $38.72 billion in 2025, about 32% of household footwear spending (Census Bureau monthly data summed by UrbanStyle; BEA for the total). Source: UrbanStyle calculation. Via UrbanStyle Footwear: https://urbanstylefootwear.com/footwear-spending-statistics/
December 2025 was the biggest month for US shoe stores at $4.59 billion, 11.9% of the year, ahead of August at $4.34 billion (11.2%). January was lowest at 5.6% (Census data, UrbanStyle calculation).
Copy text
11.9% of shoe-store sales happen in December: December 2025 was the biggest month for US shoe stores at $4.59 billion, 11.9% of the year, ahead of August at $4.34 billion (11.2%). January was lowest at 5.6% (Census data, UrbanStyle calculation). Source: UrbanStyle calculation. Via UrbanStyle Footwear: https://urbanstylefootwear.com/footwear-spending-statistics/
NRF and Prosper Insights found the average K-12 back-to-school shopper planned to spend $174.01 on shoes in 2026, $8.7 billion in total, about one dollar in five of K-12 back-to-school spending.
Copy text
$174.01 back-to-school shoe spending per K-12 shopper: NRF and Prosper Insights found the average K-12 back-to-school shopper planned to spend $174.01 on shoes in 2026, $8.7 billion in total, about one dollar in five of K-12 back-to-school spending. Source: NRF and Prosper, back-to-school 2026. Via UrbanStyle Footwear: https://urbanstylefootwear.com/footwear-spending-statistics/
In an August 2023 survey of 1,000 Americans, KURU Footwear found people reported spending $240 a year on footwear and buying four pairs. The margin of error was 4%.
Copy text
$240 yearly spend in a brand survey, 2023: In an August 2023 survey of 1,000 Americans, KURU Footwear found people reported spending $240 a year on footwear and buying four pairs. The margin of error was 4%. Source: KURU Footwear survey, 2023. Via UrbanStyle Footwear: https://urbanstylefootwear.com/footwear-spending-statistics/
Circana reported US footwear dollar sales "held steady in 2025 at $90 billion", with units down in the low single digits (as reported by MR Magazine).
Copy text
about $90B US footwear dollar sales tracked by Circana, 2025: Circana reported US footwear dollar sales "held steady in 2025 at $90 billion", with units down in the low single digits (as reported by MR Magazine). Source: Circana 2025 via MR Magazine. Via UrbanStyle Footwear: https://urbanstylefootwear.com/footwear-spending-statistics/
How much does the average American spend on shoes in a year?
Short answer. About $354 per person in 2025 if you divide BEA’s national footwear spending by the population (my calculation), and $461 per household in 2024 according to the BLS survey. Surveys and guides range from $174 to $735, and they aren’t measuring the same thing.
I started by looking for an official per-person figure and there isn’t one. The government publishes spending in two forms. BEA publishes a national total, and BLS publishes what a typical household reports spending in its Consumer Expenditure Survey. To get a per-person number I divided BEA’s $121.15 billion for 2025 by the 341.9 million people BEA counts, which gives about $354. That figure spreads spending across everyone, including children, and across every kind of seller, so don’t read it as what an adult spends on their own shoes. It is mine, not a published statistic.
The other figures I found are all over the place. This table shows what each one covers and what I was able to check.
| Figure | What it covers | Source and date | What I could check | Tier |
|---|---|---|---|---|
| about $354 | Per person, 2025, all kinds of seller | BEA footwear spending divided by BEA population (my calculation) | Read both FRED series, updated September 30 and February 20, 2026 | E |
| $461 | Per household, 2024 | BLS Consumer Expenditure Survey, released December 19, 2025 | Read the FRED series and the release | B |
| $648 | Households headed by someone aged 35 to 44, 2024 | BLS Consumer Expenditure Survey | Read the FRED series | B |
| $240, four pairs | Self-reported, per person, August 2023 | KURU Footwear survey of 1,000 Americans aged 16 and over, published September 8, 2023 | The survey page; the mode isn’t stated and it was run by a shoe brand | C |
| $174.01 | Shoes only, per K-12 back-to-school shopper, July 2026 | NRF and Prosper Insights & Analytics, 7,677 consumers | The press release; one season, planned spending | C |
| $735 | “Americans spend an average of $735 on shoes every year” | RunRepeat guide, published September 20, 2023 | No year or source named for this figure | D |
| about $350 | “The average American spends about $350 annually” | Packlane article, published January 8, 2026 | No source named; the same article repeats the $735 | D |
Embed this chart
<figure style="margin:0"><a href="https://urbanstylefootwear.com/footwear-spending-statistics/"><img src="https://urbanstylefootwear.com/wp-content/uploads/2026/10/usf-six-answers-annual-shoe-spending-per-american.png" alt="Chart of six answers to annual shoe spending per American, from $174 to $735, with $354 per person from BEA data" width="800" style="max-width:100%;height:auto"></a><figcaption>Source: UrbanStyle Footwear, based on BLS, BEA, KURU Footwear, NRF and RunRepeat figures compared by UrbanStyle Footwear. <a href="https://urbanstylefootwear.com/footwear-spending-statistics/">Footwear Spending Statistics 2026</a></figcaption></figure>Click the code, press Ctrl+C (Cmd+C on Mac), and paste it into any web page. Please keep the attribution link.
View as table
| Figure | Annual spend (US dollars) | What it measures | Source and tier |
|---|---|---|---|
| RunRepeat guide | 735 | Americans, average per year; no year or source named | RunRepeat, tier D |
| BLS, households aged 35 to 44 | 648 | Per household, 2024 | BLS Consumer Expenditure Survey, tier B |
| BLS, all households | 461 | Per household, 2024 | BLS Consumer Expenditure Survey, tier B |
| BEA divided by population | 354 | Per person, 2025, all kinds of seller | UrbanStyle calculation, tier E |
| KURU Footwear survey | 240 | Self-reported per person, August 2023 | KURU Footwear, tier C |
| NRF K-12 back-to-school | 174.01 | Shoes only, per K-12 shopper, one season, 2026 | NRF and Prosper Insights, tier C |
Why the numbers differ
- Person or household. BLS reports per “consumer unit”, which is close to a household. A household can be one person or six, so $461 is not comparable with a per-person figure.
- Who answers. BEA estimates national spending. BLS asks households what they bought. KURU asked people to recall a year of buying, and its sponsor sells shoes.
- How long. The NRF number is one season for families with school-age children. The others are a year.
- When. The oldest figure I found is from 2023, and the RunRepeat and Packlane figures carry no year at all.
The BEA-based number is about 48% higher than the KURU survey answer ($354 against $240). I can’t tell you why, because the survey page gives little method, and I’d rather say that than guess.
What you can safely say. The Bureau of Economic Analysis measured US household spending on footwear at $121.15 billion in 2025, which is roughly $354 per person. The Bureau of Labor Statistics survey puts the average household at $461 in 2024. Anything above $500 per person from an article with no named source should be treated as unverified.
My read. For a household budget I’d use the BLS figure and for a national comparison I’d use the BEA figure. I would not use the $735, since I couldn’t trace it to anything.
How does footwear spending change with age?
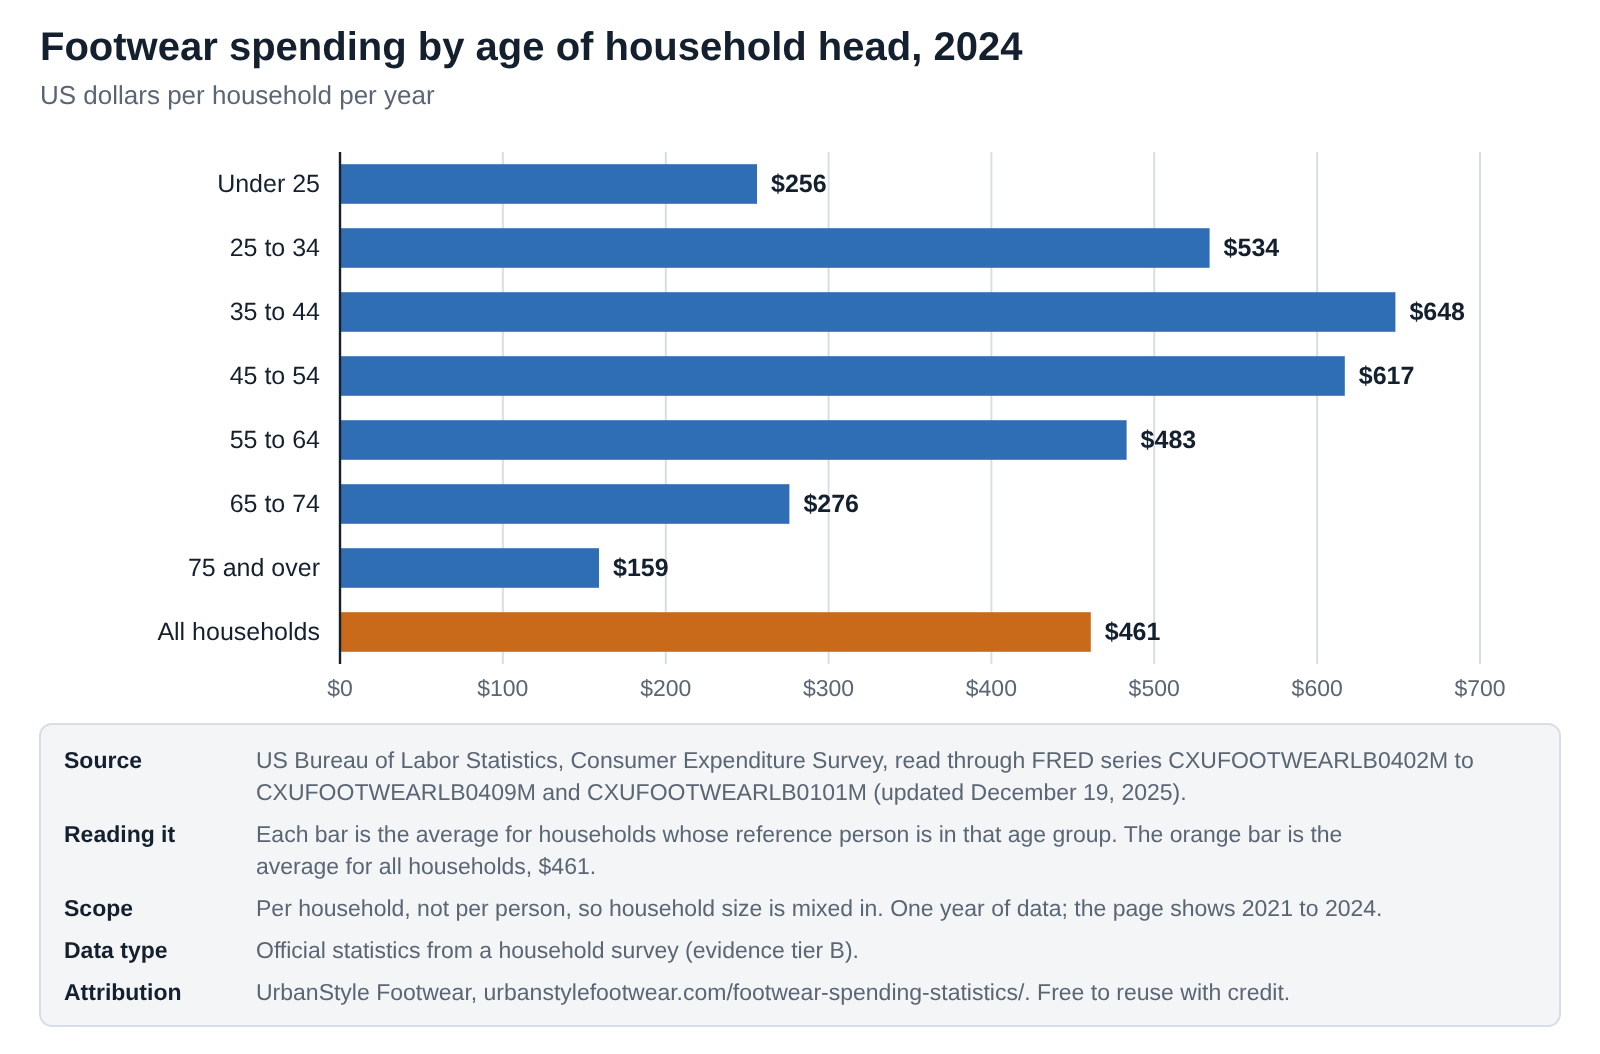
Short answer. It peaks in the middle years. In 2024 households headed by someone aged 35 to 44 spent $648, followed by 45 to 54 ($617) and 25 to 34 ($534). Households aged 75 and over spent $159.
BLS publishes footwear spending by the age of the household’s “reference person”, roughly the person who owns or rents the home. I read all seven age groups for 2021 to 2024. Pick a group below to see its four-year numbers and how it compares with the average.
See what a household of this age spends
Choose an age group to see its four-year footwear spending per household, from the BLS survey, and how to read it.
Select an age group above.
All households, 2021 to 2024. Average footwear spending per household was $461 in 2024, $444 in 2023, $399 in 2022 and $336 in 2021. That is 0.59% of the $78,535 the average household spent in total. How to read it: This is the line every age group below is measured against. It is a household average, not a per-person one.
Under 25, 2021 to 2024. Households headed by someone aged under 25 spent $335 in 2021, $224 in 2022, $325 in 2023 and $256 in 2024, which is 44% below the all-household average of $461. How to read it: This group moves around from year to year ($224 to $335 over four years, and down 21% in 2024), so the range tells you more than any single year.
25 to 34, 2021 to 2024. Households headed by someone aged 25 to 34 spent $348 in 2021, $462 in 2022, $478 in 2023 and $534 in 2024, which is 16% above the all-household average of $461. How to read it: Up every year since 2021, from $348 to $534, a rise of 53%. That is the fastest climb of any group.
35 to 44, 2021 to 2024. Households headed by someone aged 35 to 44 spent $454 in 2021, $598 in 2022, $626 in 2023 and $648 in 2024, which is 41% above the all-household average of $461. How to read it: Up every year, and the highest of any age group in 2024. The gap to the 75 and over group is 4.1 times.
45 to 54, 2021 to 2024. Households headed by someone aged 45 to 54 spent $470 in 2021, $452 in 2022, $632 in 2023 and $617 in 2024, which is 34% above the all-household average of $461. How to read it: This group was the top spender in 2023 ($632 against $626 for 35 to 44), so the top two groups are close.
55 to 64, 2021 to 2024. Households headed by someone aged 55 to 64 spent $320 in 2021, $395 in 2022, $374 in 2023 and $483 in 2024, which is 5% above the all-household average of $461. How to read it: Rose 29% in 2024 alone, from $374 to $483, after dipping in 2023.
65 to 74, 2021 to 2024. Households headed by someone aged 65 to 74 spent $217 in 2021, $266 in 2022, $302 in 2023 and $276 in 2024, which is 40% below the all-household average of $461. How to read it: Spending has stayed in a band of about $217 to $302 across the four years.
75 and over, 2021 to 2024. Households headed by someone aged 75 and over spent $126 in 2021, $181 in 2022, $201 in 2023 and $159 in 2024, which is 66% below the all-household average of $461. How to read it: The lowest of any group in every year shown. The combined 65 and over group spent $227 in 2024.
Embed this chart
<figure style="margin:0"><a href="https://urbanstylefootwear.com/footwear-spending-statistics/"><img src="https://urbanstylefootwear.com/wp-content/uploads/2026/10/usf-footwear-spending-by-age-of-household-head-2024.png" alt="Chart of footwear spending by age of household head in 2024: $648 for ages 35 to 44, $159 for ages 75 and over" width="800" style="max-width:100%;height:auto"></a><figcaption>Source: UrbanStyle Footwear, based on BLS Consumer Expenditure Survey data, 2024. <a href="https://urbanstylefootwear.com/footwear-spending-statistics/">Footwear Spending Statistics 2026</a></figcaption></figure>Click the code, press Ctrl+C (Cmd+C on Mac), and paste it into any web page. Please keep the attribution link.
View as table
| Age of household reference person | Average footwear spending per household, 2024 (US dollars) | Against the all-household average | Source |
|---|---|---|---|
| Under 25 | 256 | -44% | BLS Consumer Expenditure Survey via FRED |
| 25 to 34 | 534 | +16% | BLS Consumer Expenditure Survey via FRED |
| 35 to 44 | 648 | +41% | BLS Consumer Expenditure Survey via FRED |
| 45 to 54 | 617 | +34% | BLS Consumer Expenditure Survey via FRED |
| 55 to 64 | 483 | +5% | BLS Consumer Expenditure Survey via FRED |
| 65 to 74 | 276 | -40% | BLS Consumer Expenditure Survey via FRED |
| 75 and over | 159 | -66% | BLS Consumer Expenditure Survey via FRED |
| All households | 461 | BLS Consumer Expenditure Survey via FRED |
| Age of reference person | 2021 | 2022 | 2023 | 2024 | 2024 against average |
|---|---|---|---|---|---|
| Under 25 | $335 | $224 | $325 | $256 | -44% |
| 25 to 34 | $348 | $462 | $478 | $534 | +16% |
| 35 to 44 | $454 | $598 | $626 | $648 | +41% |
| 45 to 54 | $470 | $452 | $632 | $617 | +34% |
| 55 to 64 | $320 | $395 | $374 | $483 | +5% |
| 65 to 74 | $217 | $266 | $302 | $276 | -40% |
| 75 and over | $126 | $181 | $201 | $159 | -66% |
| All households | $336 | $399 | $444 | $461 |
- Household, not person. A household headed by someone aged 35 to 44 can include children, and children need shoes. That may be part of why this group spends the most, but BLS doesn’t say, and I haven’t checked household sizes.
- Single years bounce. The under-25 group fell from $325 to $256 in 2024 and 55 to 64 rose from $374 to $483. BLS publishes standard errors that I haven’t read, so I haven’t tested whether those moves are statistically significant. The four-year pattern is more reliable than any one year.
- Younger adults are spending more. Households aged 25 to 34 went from $348 in 2021 to $534 in 2024, the fastest climb of any group.
Do richer households spend more on shoes?
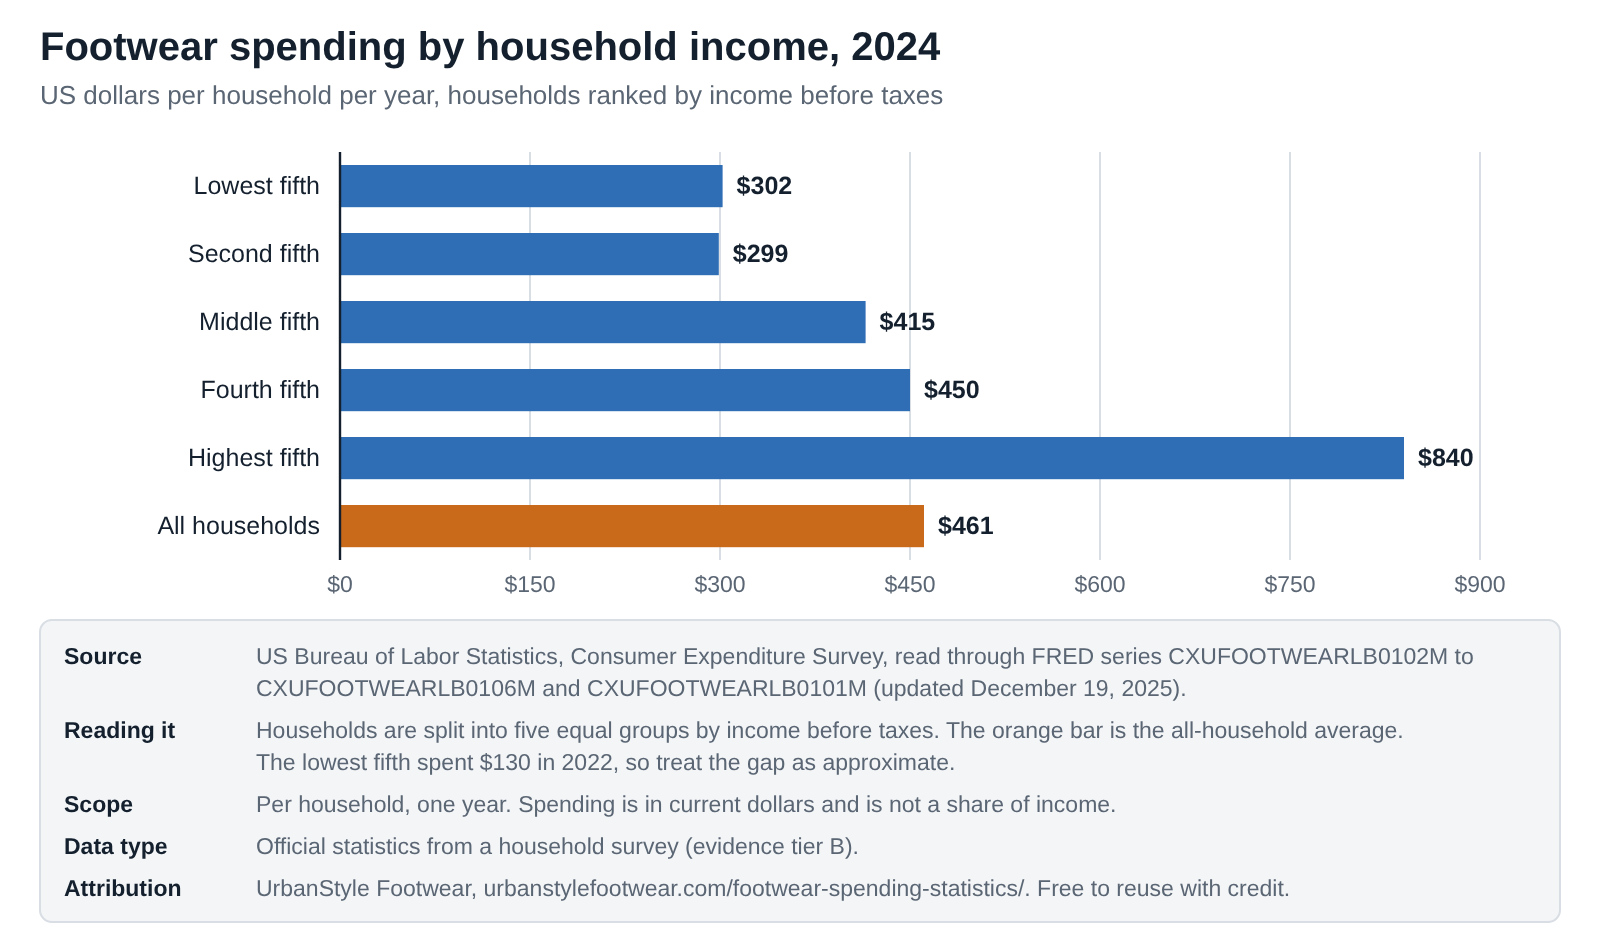
Short answer. Yes, at the top. In 2024 the highest-income fifth of households spent $840 on footwear against $302 for the lowest fifth, about 2.8 times as much. The three middle fifths sat between $299 and $450.
BLS also splits households into five equal groups by income before taxes. The pattern is not a smooth ladder. The lowest and second fifths were almost identical in 2024 ($302 and $299), and the fourth fifth fell from $575 to $450 in a year while the top fifth kept rising.
Embed this chart
<figure style="margin:0"><a href="https://urbanstylefootwear.com/footwear-spending-statistics/"><img src="https://urbanstylefootwear.com/wp-content/uploads/2026/10/usf-footwear-spending-by-household-income-2024.png" alt="Chart of 2024 household footwear spending by income: $840 for the top fifth, $302 for the lowest fifth" width="800" style="max-width:100%;height:auto"></a><figcaption>Source: UrbanStyle Footwear, based on BLS Consumer Expenditure Survey data, 2024. <a href="https://urbanstylefootwear.com/footwear-spending-statistics/">Footwear Spending Statistics 2026</a></figcaption></figure>Click the code, press Ctrl+C (Cmd+C on Mac), and paste it into any web page. Please keep the attribution link.
View as table
| Fifth of households by income before taxes | Average footwear spending per household, 2024 (US dollars) | Source |
|---|---|---|
| Lowest fifth | 302 | BLS Consumer Expenditure Survey via FRED |
| Second fifth | 299 | BLS Consumer Expenditure Survey via FRED |
| Middle fifth | 415 | BLS Consumer Expenditure Survey via FRED |
| Fourth fifth | 450 | BLS Consumer Expenditure Survey via FRED |
| Highest fifth | 840 | BLS Consumer Expenditure Survey via FRED |
| All households | 461 | BLS Consumer Expenditure Survey via FRED |
- The bottom jumped. The lowest fifth spent $130 in 2022, $214 in 2023 and $302 in 2024. I wouldn’t read a trend into a swing that large from a survey, and I haven’t checked its standard error.
- The top is steady. The highest fifth went $625, $771, $840 over the same three years, and its 2024 figure is 82% above the all-household average of $461 (my calculation).
- Not a share of income. These are dollars. I haven’t worked out what share of each group’s budget they represent, because I didn’t pull each group’s total spending.
How much does the US spend on footwear in total?
Short answer. BEA says $121.15 billion in 2025, up 4.4% from $116.06 billion in 2024. Circana tracked about $90 billion and IMARC estimates $97.16 billion. Scaling the BLS household survey to every household gives only $62.6 billion for 2024.
I use BEA for national totals because it is an official, annual series that can be adjusted for inflation. Other sources are useful as cross-checks, but they define the market differently and mostly don’t publish how.
Embed this chart
<figure style="margin:0"><a href="https://urbanstylefootwear.com/footwear-spending-statistics/"><img src="https://urbanstylefootwear.com/wp-content/uploads/2026/10/usf-five-estimates-total-us-footwear-spending.png" alt="Chart comparing five estimates of total US footwear spending: BEA $121.2B, IMARC $97.2B, Circana $90B, BLS $62.6B" width="800" style="max-width:100%;height:auto"></a><figcaption>Source: UrbanStyle Footwear, based on BEA, IMARC, Circana, BLS and Census figures compared by UrbanStyle Footwear. <a href="https://urbanstylefootwear.com/footwear-spending-statistics/">Footwear Spending Statistics 2026</a></figcaption></figure>Click the code, press Ctrl+C (Cmd+C on Mac), and paste it into any web page. Please keep the attribution link.
View as table
| Estimate | US footwear spending (billion US dollars) | How derived | Source and tier |
|---|---|---|---|
| BEA household footwear spending, 2025 | 121.15 | National accounts | BEA, tier B |
| IMARC US footwear market, 2025 | 97.16 | As stated; method not shown | IMARC Group, tier C |
| Circana US footwear sales, 2025 | 90 | Rounded, as reported | MR Magazine reporting Circana, tier D |
| BLS survey scaled to all households, 2024 | 62.6 | $461 multiplied by 135.76 million consumer units | UrbanStyle calculation, tier E |
| Census shoe stores only, 2025 | 38.72 | Sum of 12 months; one store type | Census Bureau, tier B and E |
| Source | Year | US footwear spending | What it is | Tier |
|---|---|---|---|---|
| BEA | 2025 | $121.15 billion | Household spending on footwear, national accounts | B |
| BEA | 2024 | $116.06 billion | Same series, for comparison with the BLS survey | B |
| IMARC Group | 2025 | $97.16 billion | Market estimate; the public page doesn’t show the method | C |
| Circana via MR Magazine | 2025 | about $90 billion | Retail tracking, “held steady in 2025 at $90 billion”; units down in the low single digits | D |
| BLS scaled by me | 2024 | $62.6 billion | $461 multiplied by 135.76 million consumer units | E |
| Census shoe stores | 2025 | $38.72 billion | One kind of store, 12 months summed by me; about 32% of the BEA figure | B |
The 85% gap between two federal numbers
This is the one I spent the most time on. For 2024, BEA reports $116.06 billion. If I take BLS’s $461 per household and multiply by the 135.76 million households it counts, I get $62.6 billion. BEA is about 1.85 times higher, a gap of roughly $53 billion. On a per-person basis that is $341 against $184.
The two programs use different methods. BLS asks households what they bought, and BEA estimates spending for the whole economy. The people covered are not exactly the same either. I looked for a published explanation of the footwear gap specifically and didn’t find one, so I’m not going to assign a cause. What I do is use BEA for totals and per-person estimates, and BLS to compare groups with each other, because the ratios between groups don’t depend on the level.
If you’re writing about online sales, the dollar estimates in my online shoe shopping statistics page imply markets larger than BEA’s total, which is another reason to check what any “market size” is measuring.
What you can safely say. “The Bureau of Economic Analysis measured US household footwear spending at $121.15 billion in 2025.” If you quote a second number, name its source and say what it counts.
Is footwear spending rising, and is it just prices?
Short answer. It is rising, and mostly through volume rather than higher prices. From 2019 to 2025 BEA footwear spending grew 31.9% in dollars while footwear prices rose 6.9%, so spending after prices rose 23.4%.
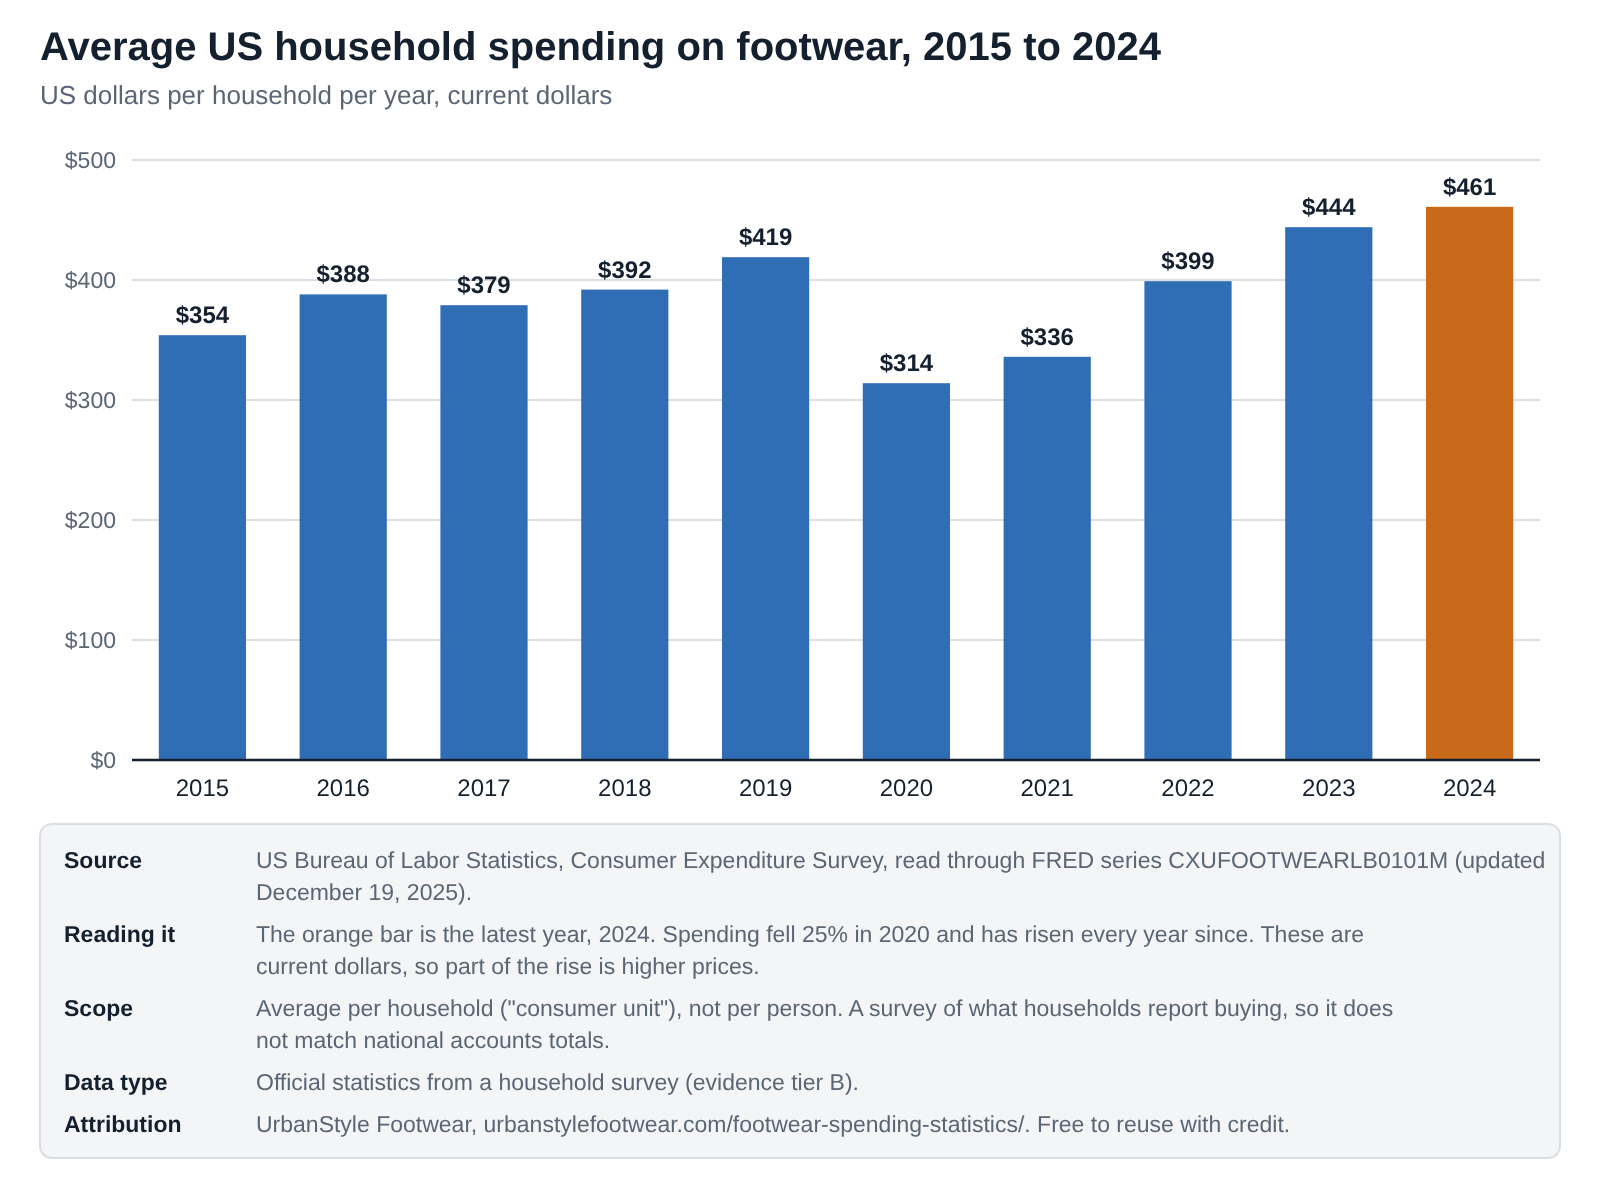
The BLS household average tells a gentler story. It went from $419 in 2019 to $461 in 2024, up 10.0%, or about 3% once I adjust for footwear prices. Both series show the same shape: a pandemic dip, a sharp rebound and growth since.
Embed this chart
<figure style="margin:0"><a href="https://urbanstylefootwear.com/footwear-spending-statistics/"><img src="https://urbanstylefootwear.com/wp-content/uploads/2026/10/usf-us-household-footwear-spending-2015-2024.png" alt="Chart of average US household footwear spending 2015 to 2024, rising from $354 to $461 after a 2020 dip to $314" width="800" style="max-width:100%;height:auto"></a><figcaption>Source: UrbanStyle Footwear, based on BLS Consumer Expenditure Survey data, 2015 to 2024. <a href="https://urbanstylefootwear.com/footwear-spending-statistics/">Footwear Spending Statistics 2026</a></figcaption></figure>Click the code, press Ctrl+C (Cmd+C on Mac), and paste it into any web page. Please keep the attribution link.
View as table
| Year | Average footwear spending per household (US dollars) | Source |
|---|---|---|
| 2015 | 354 | BLS Consumer Expenditure Survey via FRED (CXUFOOTWEARLB0101M) |
| 2016 | 388 | BLS Consumer Expenditure Survey via FRED (CXUFOOTWEARLB0101M) |
| 2017 | 379 | BLS Consumer Expenditure Survey via FRED (CXUFOOTWEARLB0101M) |
| 2018 | 392 | BLS Consumer Expenditure Survey via FRED (CXUFOOTWEARLB0101M) |
| 2019 | 419 | BLS Consumer Expenditure Survey via FRED (CXUFOOTWEARLB0101M) |
| 2020 | 314 | BLS Consumer Expenditure Survey via FRED (CXUFOOTWEARLB0101M) |
| 2021 | 336 | BLS Consumer Expenditure Survey via FRED (CXUFOOTWEARLB0101M) |
| 2022 | 399 | BLS Consumer Expenditure Survey via FRED (CXUFOOTWEARLB0101M) |
| 2023 | 444 | BLS Consumer Expenditure Survey via FRED (CXUFOOTWEARLB0101M) |
| 2024 | 461 | BLS Consumer Expenditure Survey via FRED (CXUFOOTWEARLB0101M) |
| Measure | 2019 | Latest | Change | Source and tier |
|---|---|---|---|---|
| BEA footwear spending, current dollars | $91.87 billion | $121.15 billion (2025) | +31.9% | BEA, B |
| BEA footwear spending, chained 2017 dollars | $91.84 billion | $113.33 billion (2025) | +23.4% | BEA, B |
| BEA footwear price index (2017 = 100) | 100.03 | 106.90 (2025) | +6.9% | BEA, B |
| BEA footwear spending per person, current dollars | about $278 | about $354 (2025) | +27.5% | My calculation, E |
| BLS average per household, current dollars | $419 | $461 (2024) | +10.0% | BLS, B; change is E |
| BLS average per household after footwear prices | $419 | $431.8 in 2017 dollars (2024) | +3.1% | My calculation, E |
- The 2020 dip. The BLS average fell 25% in 2020, from $419 to $314. BEA’s total fell 11.4% that year and then rose 29.9% in 2021.
- Prices have lagged other things. The footwear consumer price index rose 7.0% from December 2019 to December 2025, against 26.1% for all items. That is part of why spending after prices looks strong.
- 2026 is warmer on prices. The footwear index was up 3.6% in August 2026 from a year earlier, against 3.4% for all items.
When do Americans spend the most on shoes?
Short answer. In December and August. US shoe stores sold $4.59 billion in December 2025 (11.9% of the year) and $4.34 billion in August (11.2%), against $2.15 billion in January (5.6%).
Census publishes monthly sales for shoe stores, so this is the only monthly view I could trace to an official source. I summed the twelve months of 2025 to $38.72 billion and worked out each month’s share.
Embed this chart
<figure style="margin:0"><a href="https://urbanstylefootwear.com/footwear-spending-statistics/"><img src="https://urbanstylefootwear.com/wp-content/uploads/2026/10/usf-us-shoe-store-sales-by-month-2025.png" alt="Chart of US shoe-store sales by month in 2025, peaking at $4.59 billion in December and $4.34 billion in August" width="800" style="max-width:100%;height:auto"></a><figcaption>Source: UrbanStyle Footwear, based on US Census Bureau Monthly Retail Trade data for shoe stores, 2025. <a href="https://urbanstylefootwear.com/footwear-spending-statistics/">Footwear Spending Statistics 2026</a></figcaption></figure>Click the code, press Ctrl+C (Cmd+C on Mac), and paste it into any web page. Please keep the attribution link.
View as table
| Month (2025) | Shoe-store sales (billion US dollars) | Share of year (%) | Source |
|---|---|---|---|
| Jan | 2.150 | 5.6 | Census Monthly Retail Trade via FRED (MRTSSM4482USN), not seasonally adjusted |
| Feb | 2.468 | 6.4 | Census Monthly Retail Trade via FRED (MRTSSM4482USN), not seasonally adjusted |
| Mar | 3.222 | 8.3 | Census Monthly Retail Trade via FRED (MRTSSM4482USN), not seasonally adjusted |
| Apr | 2.967 | 7.7 | Census Monthly Retail Trade via FRED (MRTSSM4482USN), not seasonally adjusted |
| May | 3.336 | 8.6 | Census Monthly Retail Trade via FRED (MRTSSM4482USN), not seasonally adjusted |
| Jun | 2.993 | 7.7 | Census Monthly Retail Trade via FRED (MRTSSM4482USN), not seasonally adjusted |
| Jul | 3.569 | 9.2 | Census Monthly Retail Trade via FRED (MRTSSM4482USN), not seasonally adjusted |
| Aug | 4.343 | 11.2 | Census Monthly Retail Trade via FRED (MRTSSM4482USN), not seasonally adjusted |
| Sep | 2.707 | 7.0 | Census Monthly Retail Trade via FRED (MRTSSM4482USN), not seasonally adjusted |
| Oct | 2.956 | 7.6 | Census Monthly Retail Trade via FRED (MRTSSM4482USN), not seasonally adjusted |
| Nov | 3.417 | 8.8 | Census Monthly Retail Trade via FRED (MRTSSM4482USN), not seasonally adjusted |
| Dec | 4.593 | 11.9 | Census Monthly Retail Trade via FRED (MRTSSM4482USN), not seasonally adjusted |
- Two peaks. December is the holiday season and August lines up with back-to-school, though Census doesn’t say why. No other month gets above 9.2% (July).
- Sales are not discounts. A busy month means people bought, not that prices were low. I haven’t measured discounts, so I can’t tell you which month is cheapest.
- 2026 so far. Shoe-store sales for January to July 2026 were $21.30 billion, up 2.9% on the same months of 2025 ($20.71 billion), not seasonally adjusted. Footwear prices were up 3.4% in July, so volume through shoe stores looks roughly flat.
- What it leaves out. Shoe stores were only about 32% of household footwear spending in 2025. Department stores, sports retailers, warehouse clubs and online sellers are not in this series, and Census counts the online sales of companies with stores elsewhere.
How much do families spend on back-to-school shoes?
Short answer. NRF and Prosper Insights found the average K-12 shopper planned to spend $174.01 on shoes in July 2026, $8.7 billion in total. That is about 20% of the $863.86 planned for all K-12 back-to-school items.
This is the most recent spending number with a shoe line in it. NRF’s survey of 7,677 consumers ran July 1 to 8, 2026, with a margin of error of 1.1 percentage points.
Embed this chart
<figure style="margin:0"><a href="https://urbanstylefootwear.com/footwear-spending-statistics/"><img src="https://urbanstylefootwear.com/wp-content/uploads/2026/10/usf-back-to-school-spending-by-category-2026.png" alt="Chart of 2026 K-12 back-to-school spending per shopper: electronics $293, clothing $250, shoes $174, supplies $146" width="800" style="max-width:100%;height:auto"></a><figcaption>Source: UrbanStyle Footwear, based on NRF and Prosper Insights & Analytics 2026 back-to-school survey. <a href="https://urbanstylefootwear.com/footwear-spending-statistics/">Footwear Spending Statistics 2026</a></figcaption></figure>Click the code, press Ctrl+C (Cmd+C on Mac), and paste it into any web page. Please keep the attribution link.
View as table
| Category | Average planned spending per K-12 shopper, 2026 (US dollars) | Total (billion US dollars) | Source |
|---|---|---|---|
| Electronics | 293.11 | 14.7 | NRF and Prosper Insights & Analytics, July 2026 |
| Clothing and accessories | 250.29 | 12.5 | NRF and Prosper Insights & Analytics, July 2026 |
| Shoes | 174.01 | 8.7 | NRF and Prosper Insights & Analytics, July 2026 |
| School supplies | 146.45 | 7.3 | NRF and Prosper Insights & Analytics, July 2026 |
- The categories add up. Electronics ($293.11), clothing and accessories ($250.29), shoes ($174.01) and school supplies ($146.45) sum exactly to the $863.86 average (my check).
- Everyone, not only buyers. $8.7 billion divided by $174.01 is about 50 million shoppers, the same base as the $43.3 billion total. That tells me the shoe average includes every K-12 shopper, not just those who plan to buy shoes. That’s my inference from the arithmetic, not something NRF states.
- Total spending is planned to rise. NRF puts K-12 spending at a record $43.3 billion against $39.4 billion in 2025, up 9.9% (my calculation). I didn’t find a 2025 shoe figure to compare, so I can’t say whether shoes went up.
- Online is slipping. 50% of K-12 shoppers planned to shop online, down from 55% in 2025. That’s all back-to-school items, not only shoes.
- Athletic is expected to grow. AlixPartners and FDRA’s June 2026 survey expected athletic and athleisure spending to rise 11%.
- College is separate. NRF reports college spending of $103.5 billion but gives no shoe line for it.
Are people buying more pairs or paying more per pair?
Short answer. The latest evidence points to price. Circana reported US footwear dollar sales up 1% in the first half of 2026 with units down and average prices up. In a spring 2026 survey, 39% of those planning to spend more said they would buy the same amount and pay more per pair.
- Circana, first half of 2026. Total US footwear dollar sales were up 1%, unit sales fell overall and average selling prices rose. Performance footwear rose 6% and running 13%. Circana gives no percentages for units or price.
- Circana, 2025. Dollar sales “held steady in 2025 at $90 billion” and units fell in the low single digits. In the fourth quarter dollars rose 2% on average prices up 8%, with units down. (Reported by MR Magazine.)
- AlixPartners and FDRA, spring 2026. Price is the number one influence on what people buy and the number one reason they abandon a purchase. Among those planning to spend more, 39% said they would buy the same amount and pay more per pair, up from 35% in 2025.
- Not for lack of need. Among those planning to spend less, only about 3 in 10 said it was because they don’t need shoes, down from over half in 2025. The report reads this as an affordability problem.
I’d call this a reasonable picture rather than a measured fact. The surveys record intentions, Circana’s tracking has its own coverage, and no source I could read splits the change in dollars into volume and price for 2026.
Sources: Circana (tier C), MR Magazine reporting Circana (tier D), AlixPartners and FDRA spring 2026 report (tier C).Who measures what
Footwear spending can be counted in five ways, and each source on this page does one of them. That’s the main reason the numbers don’t line up. Select a step to see what is counted and how I use it.
1National accountsBEA personal consumption expenditures on footwear
Estimates what households spend on footwear across the whole economy, from all kinds of sellers. It is the only official national total, and it comes with a price index, so I use it for totals, per-person figures and inflation-adjusted trends.
2Household surveysBLS Consumer Expenditure Survey
Asks households what they bought and reports averages per household, by age, income and other groups. Good for comparing groups. For 2024 it scales to well under the national accounts total, so I use it for comparisons and not for totals.
3Store sales surveysCensus Monthly Retail Trade for shoe stores
Counts the sales of shoe-store establishments each month. It is the only official monthly series, but it covers one kind of store and not the other places people buy shoes.
4Market trackers and researchCircana, IMARC Group
Track or model total US footwear sales. Their public pages give headline figures but not the full method, so I use them as cross-checks, not as the base.
5Consumer surveysNRF and Prosper, AlixPartners and FDRA, KURU Footwear
Ask people what they plan to spend or recall spending. Useful for the why, but they record stated intentions and memory, and the publisher is often a retailer or a brand.
What I’m watching next
I don’t forecast. These are the releases that would change this page, and what I’ll do when they land.
- BLS 2025 Consumer Expenditure results. The latest available are for 2024, released December 19, 2025. When 2025 appears I’ll update every household, age and income figure.
- Monthly Census retail trade. New shoe-store months arrive regularly. I’ll refresh the 2026 comparison at my next review.
- Circana’s full-year 2026 report. The 2025 report appeared on February 5, 2026, so I expect early 2027.
- NRF back-to-school 2027. Next July. It would give a second year for the shoe line.
- The regional split. BLS publishes footwear spending by region. I’ll add it once I can read all four regions.
- A real reconciliation. If BEA or BLS publish a footwear-specific explanation for the gap between their numbers, or you know of one, email me.
Every change goes in the freshness log.
Where other shoe spending articles go wrong
I read several of the pages that rank for this topic before writing. They’re a useful starting point, and they share some habits I tried to avoid.
- Problem 1They state a yearly figure with no year or source, and sometimes two conflicting figures in one article.
- Problem 2They mix per-person, per-household and per-season numbers as if they were the same.
- Problem 3They quote a market-research total as “what Americans spend” without saying how it was built.
- Problem 4They give a percentage with no base, such as a household spend of “38%” with nothing to say 38% of what.
- Problem 5They don’t date the numbers, so a 2020 or 2023 figure sits in a 2026 article.
- Problem 6They read a rise in dollars as buying more, without checking prices.
- Problem 7They quote one survey without saying that a shoe brand ran it.
- Problem 8They give false precision where the honest answer is a range.
- Problem 9They never say what the figure leaves out.
Working out your own shoe budget
This is practical advice, separate from the research above. National averages are a sanity check, not a target.
- Start with your own year. Count the pairs you bought last year and what you paid. If you’re at $461 for a household, you’re average. If you’re well above, check whether it’s running shoes you replace often or a few big purchases.
- Budget by person. A household with children will spend more because kids outgrow shoes. For school-age children, NRF’s 2026 number of $174.01 per family is a reasonable starting point for the back-to-school round.
- Don’t confuse busy with cheap. Stores sell the most in August and December, but I haven’t measured discounts. Compare prices, and see my Prime Day shoe deals.
- Spend where it counts. A pair you wear daily or run in is worth more than a pair you wear twice. My best running shoes under $100 and New Balance vs Brooks vs Hoka comparisons help.
- Get the size right. A wrong size costs you the price of the shoe or the hassle of a return. Measure first with my foot measuring guide and use the size conversion calculator. See also my shoe return statistics.
- Plan for prices to creep up. The footwear price index was up 3.6% in August 2026 from a year earlier, so a budget that was enough last year may buy slightly less.
Sources and evidence tiers
Evidence hierarchy
- APeer-reviewed research. Original data in a peer-reviewed journal. I found none on household footwear spending and none is cited here.
- BOfficial statistics. BEA, BLS and Census Bureau data. The strongest evidence on this page, though the two federal measures of footwear spending disagree.
- CIndustry research, surveys and company statements. NRF and Prosper, AlixPartners and FDRA, Circana, IMARC and the KURU survey. Useful, but the publisher may have a commercial interest.
- DSecondary reporting. Articles that report a figure I couldn’t open at its source, or that give no source at all, such as the RunRepeat and Packlane figures.
- EEstimates and calculations. My own arithmetic and comparisons, with the method stated.
Primary versus secondary data
Primary source: the organisation that collected or published the data. Secondary source: an article summarising someone else’s data. Where I could only read a secondary source, the table says so.
Source table
| Source | Year | Sample | Geography | Finding used | Tier | Series ID | Primary source |
|---|---|---|---|---|---|---|---|
| US Bureau of Economic Analysis, Personal consumption expenditures: Footwear (NIPA Table 2.5.5), read through FRED | 2025 | National accounts estimate, annual, current dollars | United States | Household spending on footwear: $121.150 billion in 2025, $116.061 billion in 2024, $91.872 billion in 2019 | B | FRED series DFTWRC1A027NBEA (updated Sept 30, 2026) | FRED series page |
| US Bureau of Economic Analysis, Real personal consumption expenditures: Footwear (chained 2017 dollars), read through FRED | 2025 | National accounts estimate, annual, inflation-adjusted | United States | Price-adjusted footwear spending of $113.333 billion in 2025, $108.699 billion in 2024 and $91.843 billion in 2019 (chained 2017 dollars) | B | FRED series DFTWRX1A020NBEA (updated Sept 30, 2026) | FRED series page |
| US Bureau of Economic Analysis, Personal consumption expenditures: Footwear, chain-type price index (2017=100), read through FRED | 2025 | National accounts price index, annual | United States | Footwear price index of 106.898 in 2025, 106.773 in 2024 and 100.032 in 2019 | B | FRED series DFTWRG3A086NBEA (updated Sept 30, 2026) | FRED series page |
| US Bureau of Economic Analysis, Population, read through FRED | 2025 | National accounts population, January 1 of each year | United States | Population of 341.944 million (2025), 340.095 million (2024) and 330.513 million (2019), used for per-person figures | B | FRED series B230RC0A052NBEA (updated Feb 20, 2026) | FRED series page |
| US Bureau of Labor Statistics, Consumer Expenditure Survey: Footwear, all consumer units, read through FRED | 2024 | Household survey, average annual spending per consumer unit | United States | Average footwear spending of $461 per consumer unit in 2024, $444 in 2023 and $419 in 2019 | B | FRED series CXUFOOTWEARLB0101M (updated Dec 19, 2025) | FRED series page |
| US Bureau of Labor Statistics, Consumer Expenditure Survey: Footwear by age of reference person, read through FRED | 2024 | Household survey, average annual spending per consumer unit, by age of reference person | United States | Footwear spending in 2024 of $256 (under 25), $534 (25 to 34), $648 (35 to 44), $617 (45 to 54), $483 (55 to 64), $276 (65 to 74), $159 (75 and over) | B | FRED series CXUFOOTWEARLB0402M to CXUFOOTWEARLB0409M (updated Dec 19, 2025) | FRED series page (35 to 44) |
| US Bureau of Labor Statistics, Consumer Expenditure Survey: Footwear by quintile of income before taxes, read through FRED | 2024 | Household survey, average annual spending per consumer unit, by fifth of income before taxes | United States | Footwear spending in 2024 of $302 (lowest fifth), $299, $415, $450 and $840 (highest fifth) | B | FRED series CXUFOOTWEARLB0102M to CXUFOOTWEARLB0106M (updated Dec 19, 2025) | FRED series page (highest fifth) |
| US Bureau of Labor Statistics, Consumer Expenditures 2024 news release | 2024 | Household survey, all spending categories | United States | 135,760 thousand consumer units; average annual expenditures of $78,535 per consumer unit in 2024; apparel and services $2,001 (2.5%) | B | Released Dec 19, 2025 | BLS news release |
| US Census Bureau, Monthly Retail Trade: Shoe stores (NAICS 4482), read through FRED | 2026 | Monthly retail sales of shoe-store establishments, not seasonally adjusted | United States | Monthly shoe-store sales from $2.150 billion (January 2025) to $4.593 billion (December 2025); $38.72 billion for 2025 (UrbanStyle sum of 12 months); January to July 2026 of $21.298 billion | B | FRED series MRTSSM4482USN (updated Sept 16, 2026) | FRED series page |
| US Bureau of Labor Statistics, CPI for All Urban Consumers: Footwear, US city average, read through FRED | 2026 | Price index (1982-84=100), not seasonally adjusted, monthly | United States | Footwear index of 151.979 in August 2026 against 146.675 in August 2025, and 150.520 in July 2026 against 145.534 in July 2025 | B | FRED series CUUR0000SEAE (updated Sept 11, 2026) | FRED series page |
| US Bureau of Labor Statistics, CPI for All Urban Consumers: All items, read through FRED | 2026 | Price index (1982-84=100), not seasonally adjusted, monthly | United States | All-items index of 334.980 in August 2026 against 323.976 in August 2025 | B | FRED series CPIAUCNS (updated Sept 11, 2026) | FRED series page |
| National Retail Federation and Prosper Insights & Analytics, 2026 back-to-school survey (press release, July 14, 2026) | 2026 | Online survey of 7,677 consumers, July 1 to 8, 2026, margin of error 1.1 percentage points | United States | K-12 families planned to spend $863.86 on average and $43.3 billion in total (up from $39.4 billion); on shoes $174.01 per shopper and $8.7 billion; online chosen by 50% of K-12 shoppers (55% in 2025) | C | n/a | NRF press release |
| AlixPartners and FDRA, U.S. Consumer and Executive Footwear Survey, Spring 2026 (report PDF) | 2026 | Online consumer survey of 1,006 US adult footwear consumers aged 15 and over, March 9 to 23, 2026, described as nationally representative | United States | Price is the number one influencer of what people buy and of purchase abandonment; among those planning to spend more, 39% will buy the same amount and pay more per pair (35% in 2025); among those planning to spend less, only 3 in 10 said they do not need shoes (over half in 2025) | C | n/a | Spring 2026 report (PDF) |
| AlixPartners and FDRA, 2026 back-to-school footwear survey, press release | 2026 | Online survey of more than 1,000 US consumers aged 15 and over who intend to shop for back-to-school footwear, fielded June 2026 | United States | Athletic and athleisure spending expected up 11%; back-to-school footwear sales split evenly between in-store and online | C | n/a | AlixPartners press release |
| Circana, "Performance shoe sales pick up the pace amid selective US consumer spending in the footwear market" (Aug 17, 2026) | 2026 | Retail tracking, first half 2026 against first half 2025 | United States | Total US footwear dollar sales up 1% in the first half of 2026; unit sales fell overall; average prices rose; performance footwear +6%, running +13% | C | n/a | Circana release |
| MR Magazine, "Circana issues Q4 2025 footwear industry pulse report" (Feb 5, 2026), reporting Circana Consumer Tracking Service data | 2025 | Trade-press report of Circana retail tracking, full year 2025 | United States | US footwear dollar sales "held steady in 2025 at $90 billion"; units down in the low single digits; Q4 2025 dollars up 2% and average prices up 8% | D | n/a | MR Magazine article |
| IMARC Group, "United States Footwear Market" (public report page, last updated September 29, 2026) | 2026 | Market research report page; the public page does not describe its estimation method | United States | US footwear market of USD 97.16 billion in 2025 | C | n/a | IMARC report page |
| KURU Footwear, "American Footwear Spending: A 2023 Survey" (published September 8, 2023) | 2023 | Proprietary survey of 1,000 Americans aged 16 and older, August 2023, margin of error 4% at 95% confidence; mode not stated | United States | Respondents reported spending $240 a year on footwear and buying four pairs a year; $14,640 over a lifetime; 12 pairs owned | C | n/a | KURU survey page |
| RunRepeat, "Shoe Consumption Statistics" (published September 20, 2023, updated September 21, 2023) | 2023 | Statistics article; sources listed at the end but not tied to individual figures | Global and United States | "Americans spend an average of $735 on shoes every year", with no year or source named | D | n/a | RunRepeat article |
| Packlane, "Step Into the Stats: How Many Shoes Do Americans Buy Each Year?" (published January 8, 2026, modified September 17, 2026) | 2026 | Blog article; some figures sourced to RunRepeat, Statista and Circana via SGB Online | United States | Repeats the $735 annual figure without a source and, in its key takeaways, says the average American spends about $350 a year, also without a source | D | n/a | Packlane article |
| UrbanStyle Footwear calculations from the sources above | 2026 | Arithmetic on published figures; method stated beside each | United States | Derived per-person figures, changes, shares and ratios | E | n/a | Methodology |
Methodology and limitations
How I built this page. I started with official statistics, then survey publishers’ own reports, then market research, and only then articles. For each figure I recorded the source, date, sample and what kind of evidence it is, and I opened the original wherever it was open to me. Where I calculated something, such as a per-person figure, a share, a sum or a change, it’s labelled E and the method is in the dataset. I read the BEA, BLS, Census, NRF, KURU, Circana, IMARC, RunRepeat and Packlane pages on October 9, 2026.
What I left out. I didn’t use any yearly spending figure I couldn’t tie to a named source (the $735 and the $350 appear only to show that they are unsourced), a “38% household spend” with no base, or figures for spending by gender. I also left out spending by region. BLS publishes it, but I could read only two of the four regional series, and a half-finished split would mislead.
Limitations you should know about
- BEA and BLS disagree. For 2024 the BEA total is about 1.85 times the BLS-implied total, and I found no published reconciliation. Every per-person and total figure here depends on which one you accept.
- My per-person figure is a calculation. It divides national spending by everyone in the population, including children, and uses BEA’s population estimate, which differs a little in coverage from BLS’s.
- BLS figures are per household and from a survey. They are noisy, particularly for small groups such as households under 25 and the lowest income fifth. I haven’t read or tested the standard errors.
- Age and income figures are one reference person’s group, and household size is mixed in.
- The after-prices BLS figure is approximate. I divided each year by BEA’s footwear price index, which mixes a survey with a national-accounts index.
- The NRF shoe line is planned spending. It covers one season for families with school-age children, and my reading that it covers all K-12 shoppers is an inference from the arithmetic.
- The Circana $90 billion is reported second-hand. I read it in MR Magazine, not in a Circana document, and it is rounded.
- Shoe-store sales are narrow. They cover one kind of store and are not seasonally adjusted.
Data freshness
| Date | Change |
|---|---|
| October 9, 2026 | First publication. Data read from BEA, BLS (Consumer Expenditure Survey and CPI), the Census Bureau, NRF and Prosper Insights, AlixPartners and FDRA, Circana, IMARC, and the KURU, RunRepeat and Packlane pages. Downloadable dataset, charts and calculations with stated methods. |
| When BLS publishes 2025 data | Planned update of the household, age and income figures. |
| January 2027 | Next scheduled full review. |
Last full source review: October 9, 2026. Next scheduled review: January 2027.
Corrections. If you spot an error or have better data, email info@urbanstylefootwear.com with the subject “Data correction”. I’ll check it and note any change in the table above. How I test and review products is explained in our methodology.
For journalists and researchers
You can use the statistics and charts on this page with credit to UrbanStyle Footwear. Wherever you can, please cite the original source printed with each statistic. My own calculations are marked tier E and can be cited to me.
A sentence you can use. “The US Bureau of Economic Analysis measured household spending on footwear at $121.15 billion in 2025, roughly $354 per person, while the Bureau of Labor Statistics’ household survey put the average household’s spending at $461 in 2024.” (Sources: BEA; BLS; per-person figure calculated by UrbanStyle Footwear)
Media kit
All figures with value, unit, geography, segment, basis, period, source and evidence tier.
Seven charts with source, scope and data type printed on each image. SVG versions are under each chart above.
The 15 citable statistics on one printable PDF.
Every source with year, sample, geography, tier, series ID and link.
Ready-made citations below. Media and research enquiries go to info@urbanstylefootwear.com.
Cite this page
Suggested citation
UrbanStyle Footwear. “Footwear Spending Statistics 2026: How Much Do Americans Really Spend on Shoes?.” Updated October 9, 2026. https://urbanstylefootwear.com/footwear-spending-statistics/
APA style
Vahith, A. (2026, October 9). Footwear spending statistics 2026: How much do Americans really spend on shoes? UrbanStyle Footwear. https://urbanstylefootwear.com/footwear-spending-statistics/
Link (HTML)
<a href="https://urbanstylefootwear.com/footwear-spending-statistics/">Footwear Spending Statistics 2026 by UrbanStyle Footwear</a>Click any citation, then press Ctrl+C (Cmd+C on Mac) to copy it.
For individual statistics, UrbanStyle recommends citing the original source listed in the source table whenever possible.
Data requests. Data correction or dataset request: info@urbanstylefootwear.com
Frequently asked questions
How much does the average American spend on shoes per year?
There is no official per-person figure, so it depends on how you count. Dividing the Bureau of Economic Analysis’s $121.15 billion of 2025 household footwear spending by the population gives about $354 per person (my calculation). The Bureau of Labor Statistics’ household survey found the average household spent $461 in 2024. Surveys and guides give anything from $240 to $735. See the comparison.
How much does the average household spend on footwear?
$461 in 2024, according to the Bureau of Labor Statistics Consumer Expenditure Survey, up from $444 in 2023 and $419 in 2019. That is 0.59% of the $78,535 the average household spent in total. BLS had not published 2025 results when I last checked.
How much do Americans spend on shoes in total?
The Bureau of Economic Analysis measured household footwear spending at $121.15 billion in 2025. Other sources give lower figures: about $90 billion (Circana, as reported by MR Magazine) and $97.16 billion (IMARC). Scaling the BLS household survey up to every household gives only $62.6 billion for 2024. See why the totals differ.
Why do surveys give such different numbers for shoe spending?
They count different things: per person or per household, a year or one season, the US or the world, what people recall or what national accounts record. The figures I found run from $174 (K-12 back-to-school shoes only) to $735 (an unsourced guide). My comparison table shows what each covers.
Which age group spends the most on footwear?
Households headed by someone aged 35 to 44, at $648 in 2024, followed by 45 to 54 ($617) and 25 to 34 ($534). Households aged 75 and over spent the least, $159. These are household figures, not per person, and single years can swing, so see the four-year view.
Do higher-income households spend more on shoes?
Yes. The top fifth of households by income spent $840 on footwear in 2024 against $302 for the bottom fifth, about 2.8 times as much. The bottom fifth spent only $130 in 2022, so I would not read that gap as precise. See spending by income.
How much do parents spend on back-to-school shoes?
NRF and Prosper Insights found the average K-12 back-to-school shopper planned to spend $174.01 on shoes in July 2026, $8.7 billion in total. That is about 20% of the $863.86 planned for all K-12 back-to-school items. It is planned spending in one season, not a yearly figure. See back-to-school.
Is spending on shoes rising?
In dollars, yes. BEA household footwear spending grew 31.9% from 2019 to 2025, but footwear prices rose 6.9%, so the volume rise was about 23% (my calculations). The average household spent 10.0% more in 2024 than in 2019, or about 3% after footwear prices. See the trend.
What share of household spending goes to footwear?
0.59% in 2024 ($461 of $78,535, my calculation from BLS figures). Apparel and services together were $2,001, or 2.5%.
Are people buying more pairs or paying more per pair?
The signs point to price. Circana reported US footwear dollar sales up 1% in the first half of 2026 while units fell and average prices rose. In the AlixPartners and FDRA spring 2026 survey, 39% of those planning to spend more said they would buy the same amount and pay more per pair, up from 35% in 2025. See spending and trading down.
When do people buy the most shoes?
In stores, December and August. US shoe stores sold $4.59 billion in December 2025 (11.9% of the year) and $4.34 billion in August (11.2%), against $2.15 billion in January (5.6%). Census does not publish a shoe-only online monthly figure. See the monthly chart.
Why is the BEA figure so much higher than the BLS survey?
They are different measures. For 2024 the BEA reports $116.1 billion, while scaling the BLS household average of $461 to every household gives $62.6 billion, a gap of about $53 billion, or 1.85 times. I did not find a published footwear-specific explanation, so I do not assign a cause. I use BEA for totals and BLS for comparing groups.
Is it true that Americans spend $735 on shoes a year?
I could not verify it. The figure appears in a 2023 RunRepeat guide with no year or source named, and a 2026 article that repeats it also says about $350 a year, again with no source. The BEA-based figure I calculate is about $354 per person for 2025.
How often is this page updated?
I last checked every source on October 9, 2026, and plan to review the page again in January 2027, or sooner when BLS publishes its 2025 Consumer Expenditure results. Changes are listed in the freshness log.
Can I use this data in my article?
Yes, with credit to UrbanStyle Footwear, and cite the original source for any single statistic where you can. The dataset, charts and a printable list of key statistics are in the media kit, with citation formats.